


Liquidity Heatmap in SubFlow Terminal
Before jumping into the heatmap itself, let's first go over what liquidity is.
Liquidity refers to buy and sell orders placed in an orderbook at various price levels. Depth of liquidity refers to how many buy and sell orders are clustered around various price levels.
Deep liquidity | Thin liquidity |
|---|---|
Buy/sell orders clustered in a narrow area in price | Buy/sell orders spread out across a larger area |
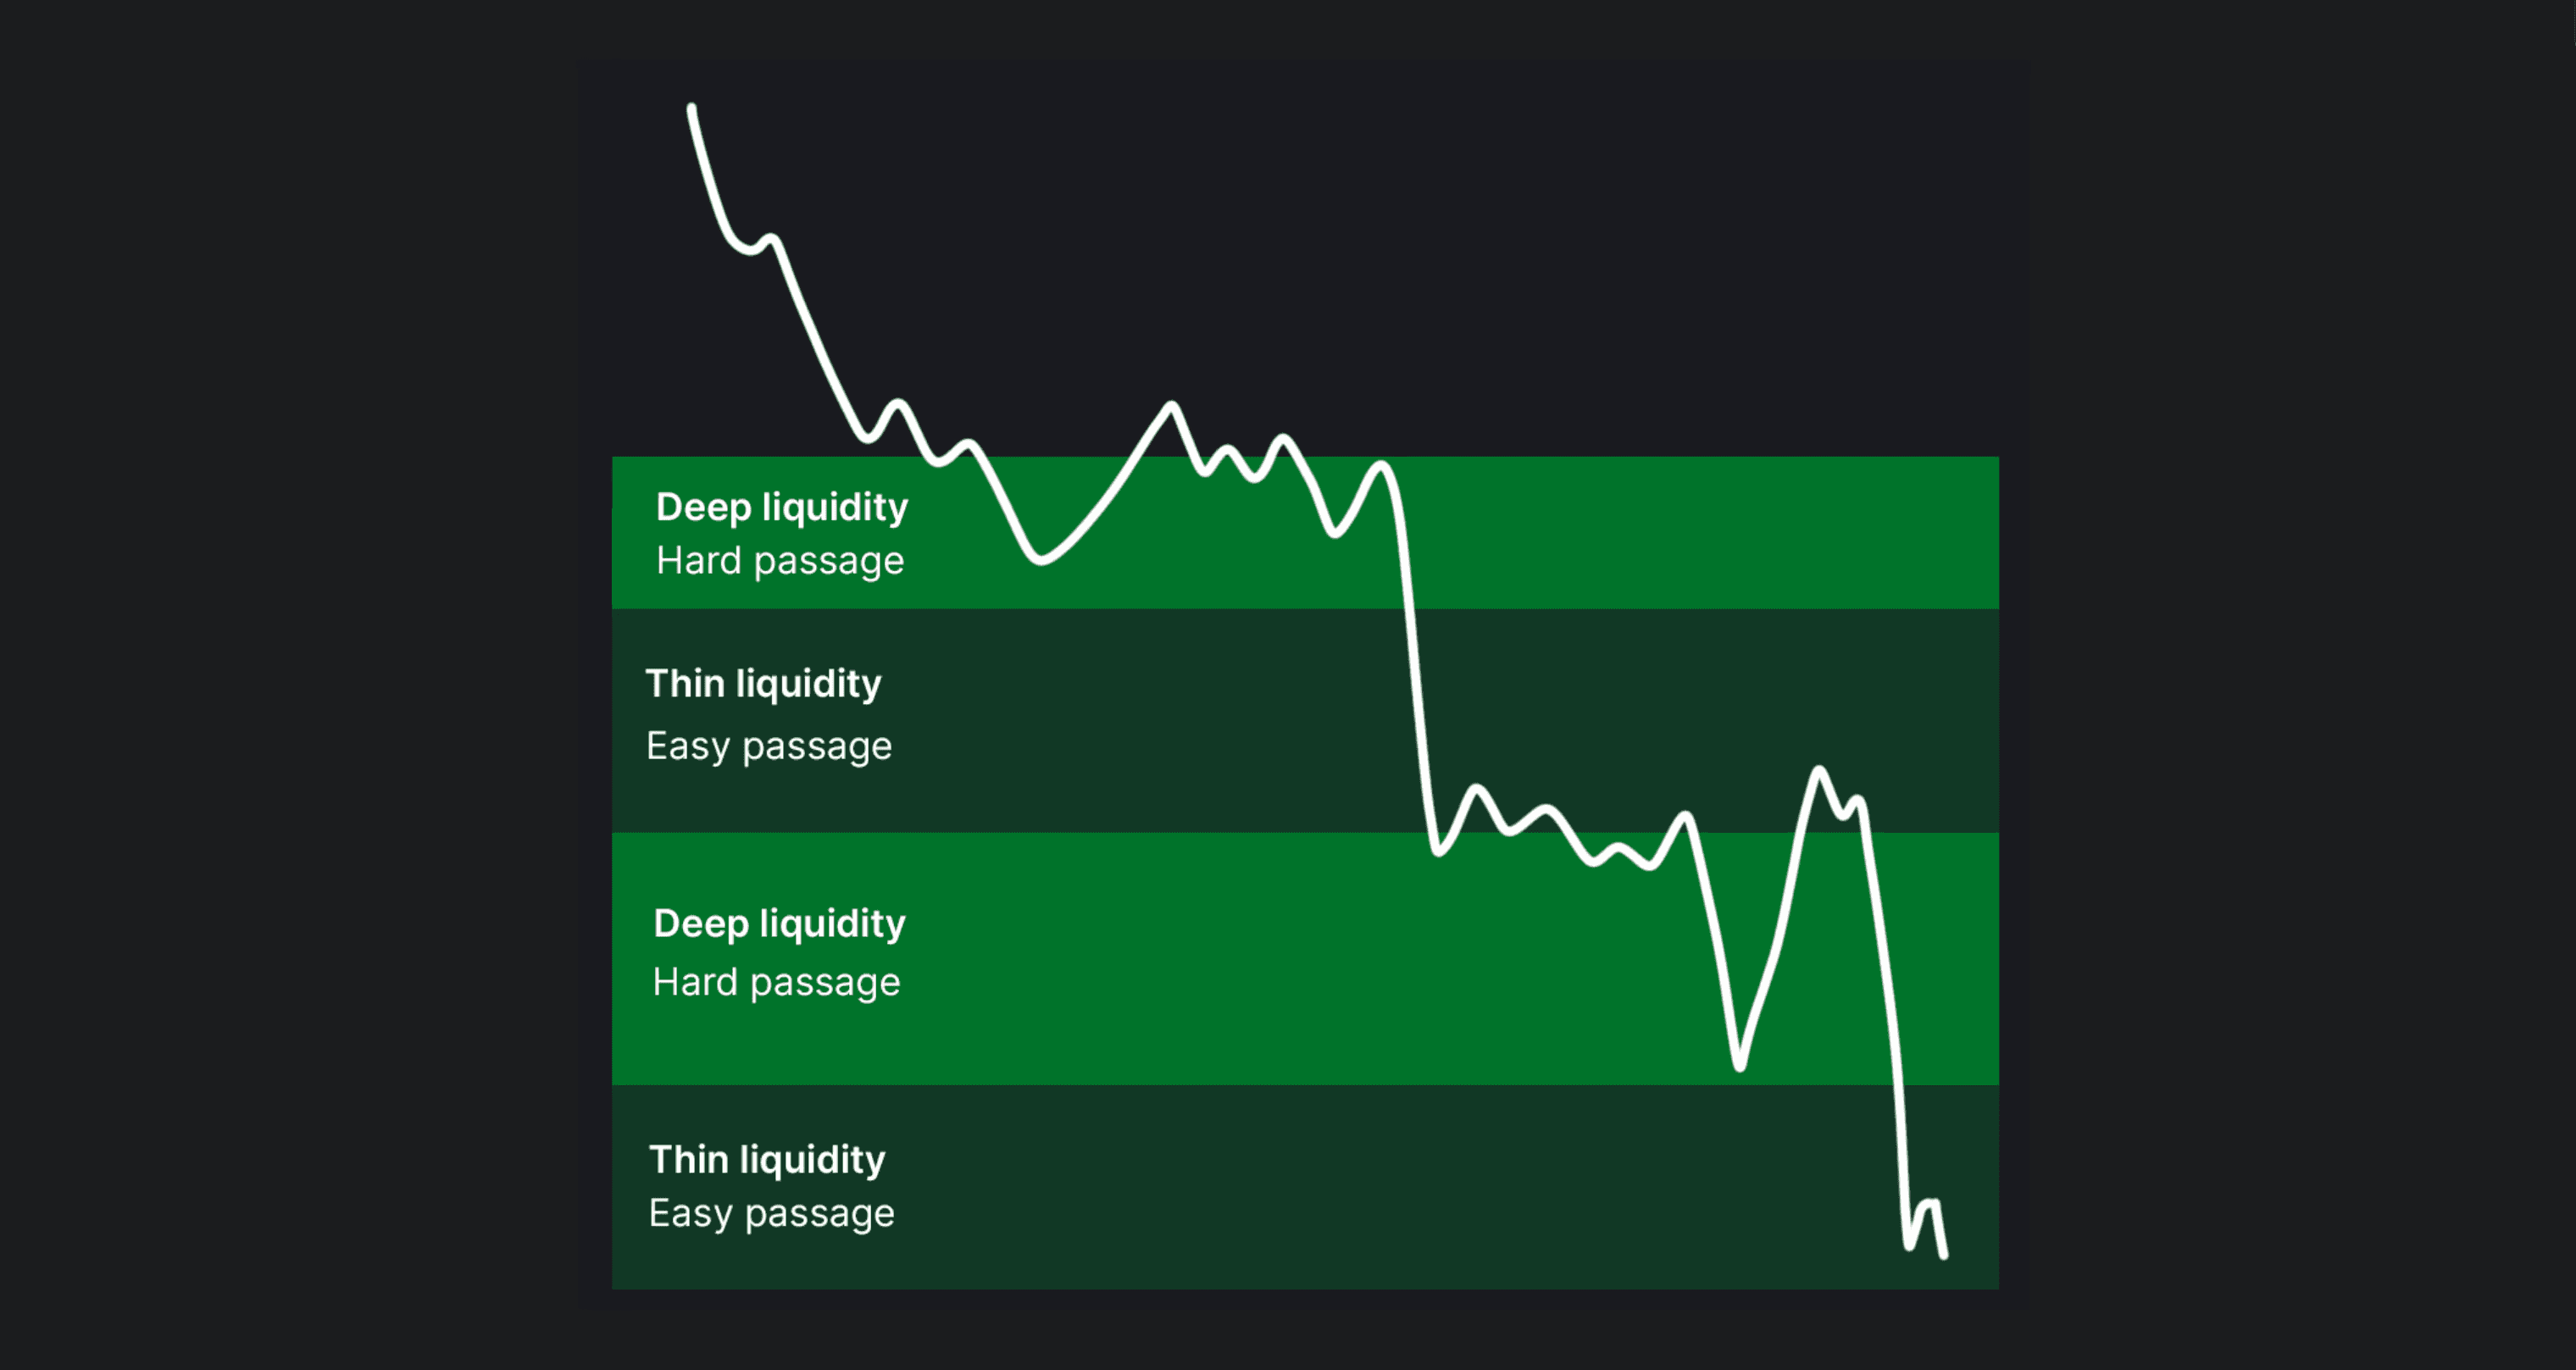
Price struggles to move to higher/lower prices, hard passage | Price doesn't struggle to move to higher/lower prices, easy passage |
Here's what deep and thin liquidity looks like in an orderbook.
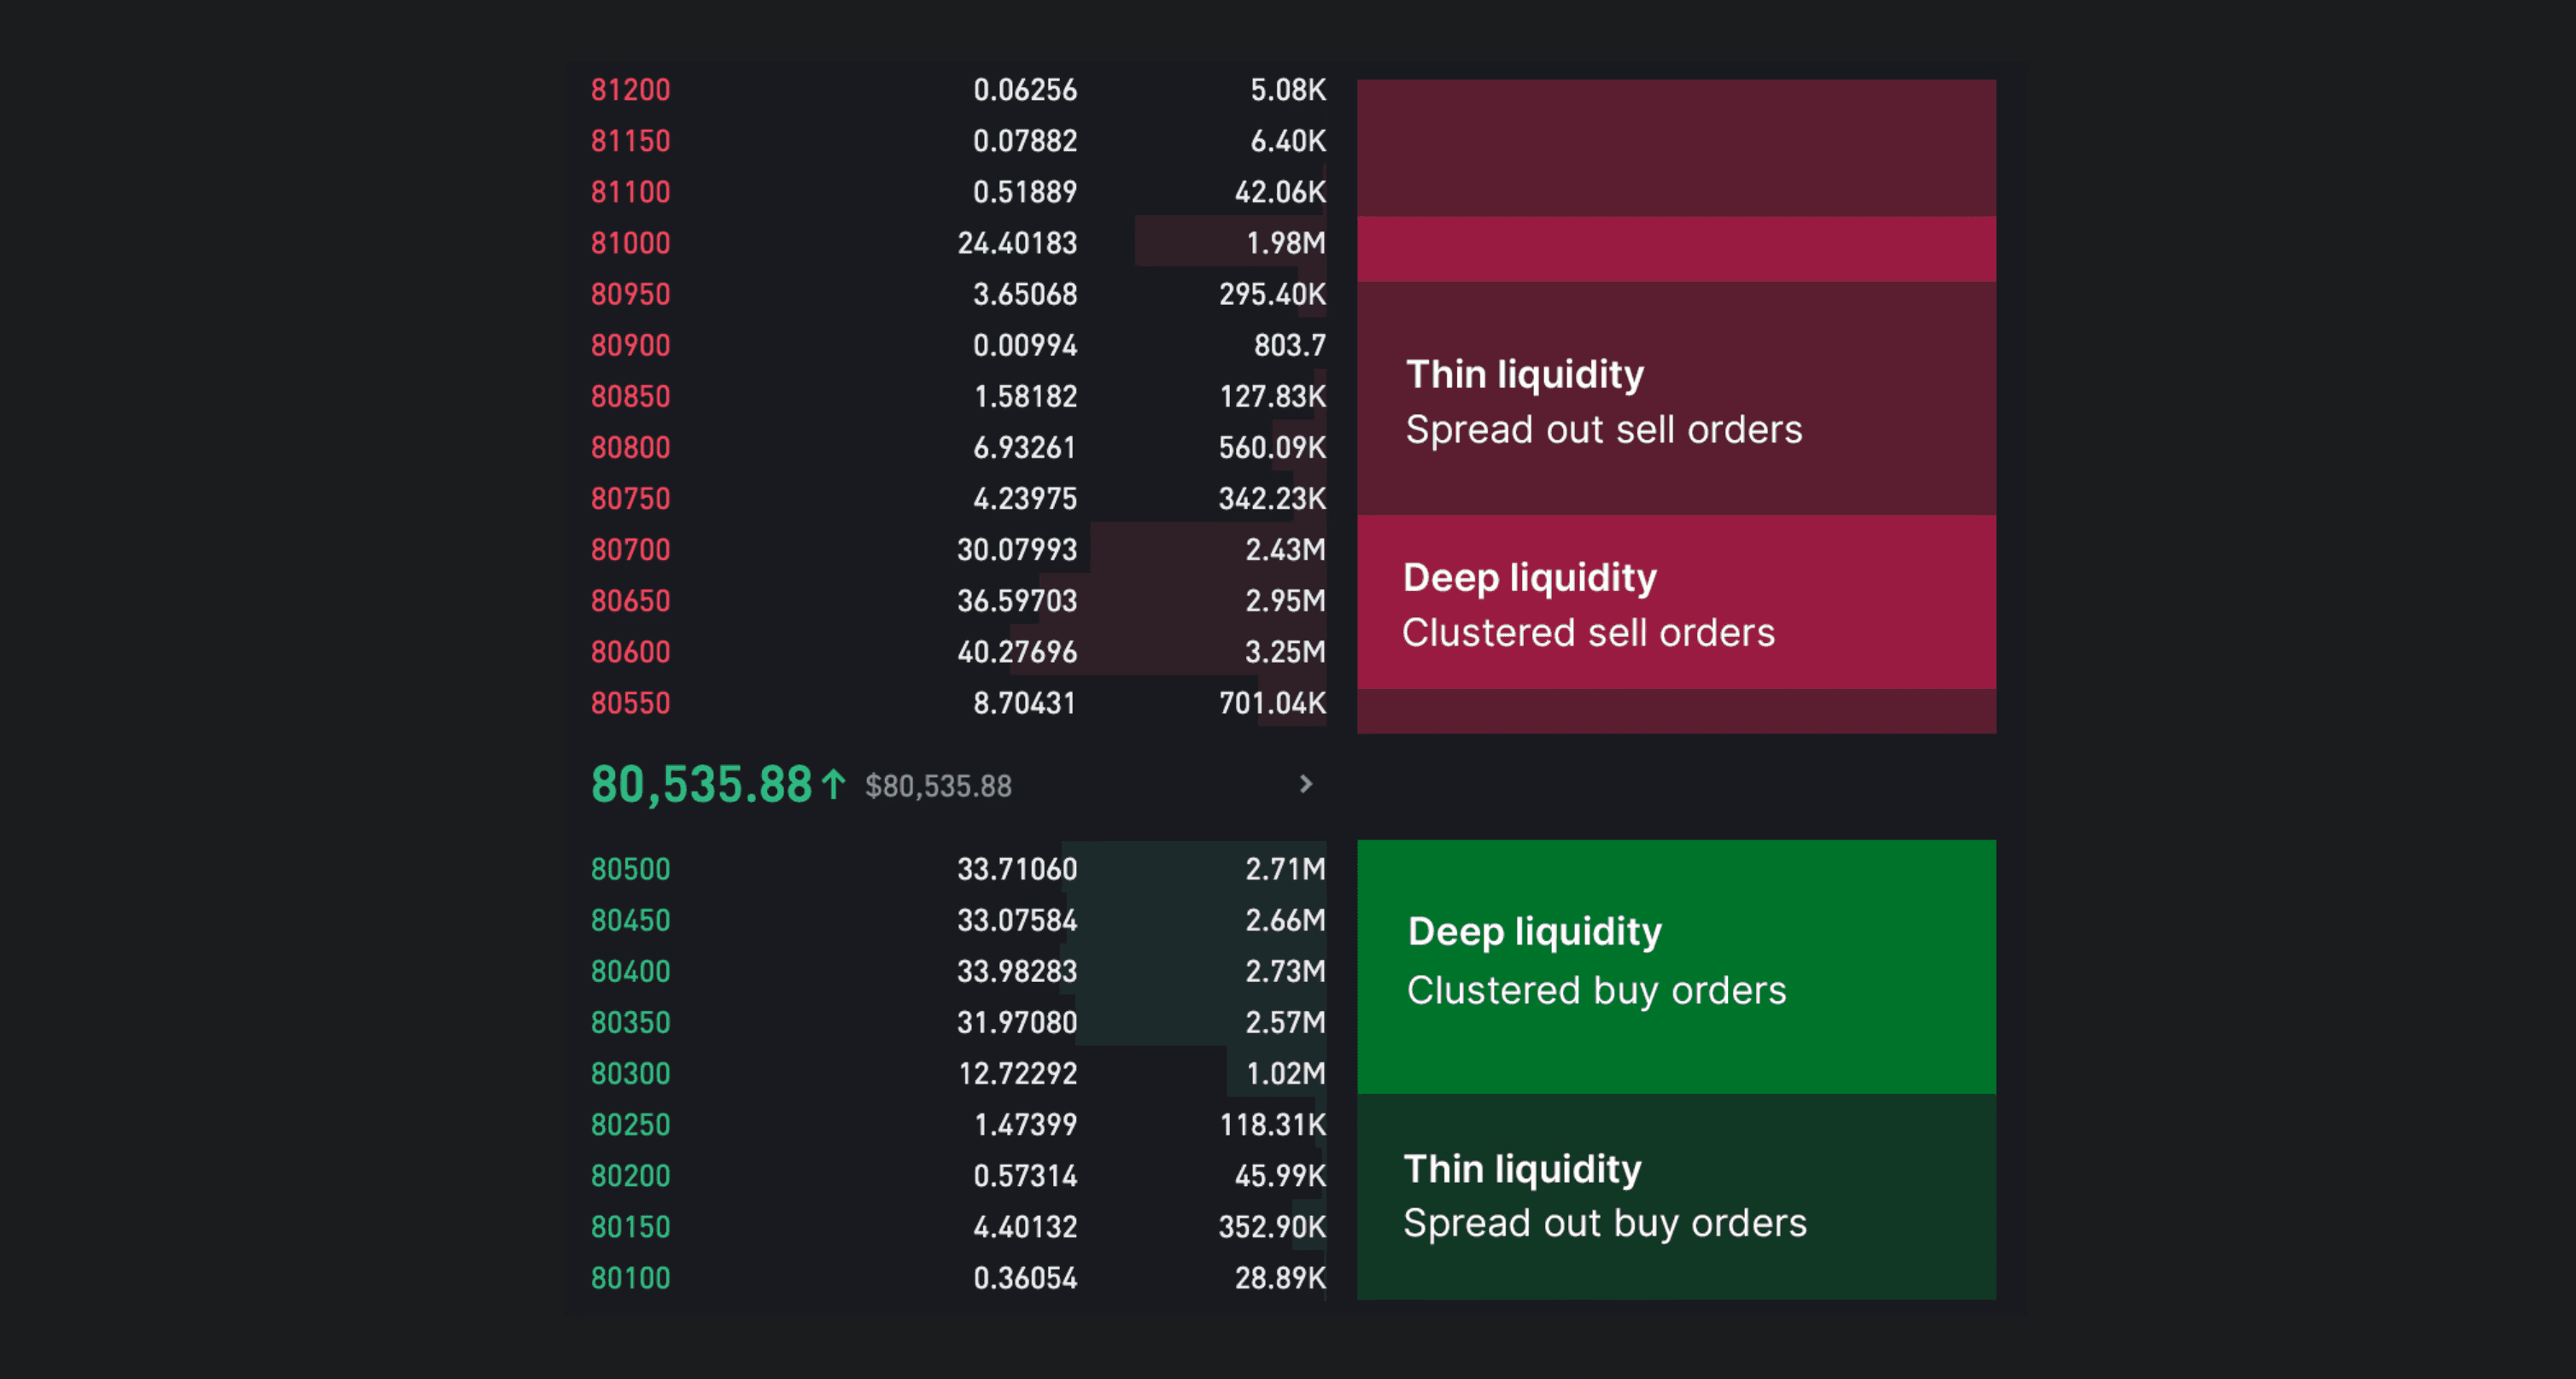
As every buy order needs a seller and every sell order needs a buyer, price naturally finds resistance at deep liquidity where resting limit orders are overwhelming incoming market orders.
Here’s a ball-park illustration of how price can be expected to react at deep vs. thin liquidity.
How SubFlow Terminal estimates liquidity pools
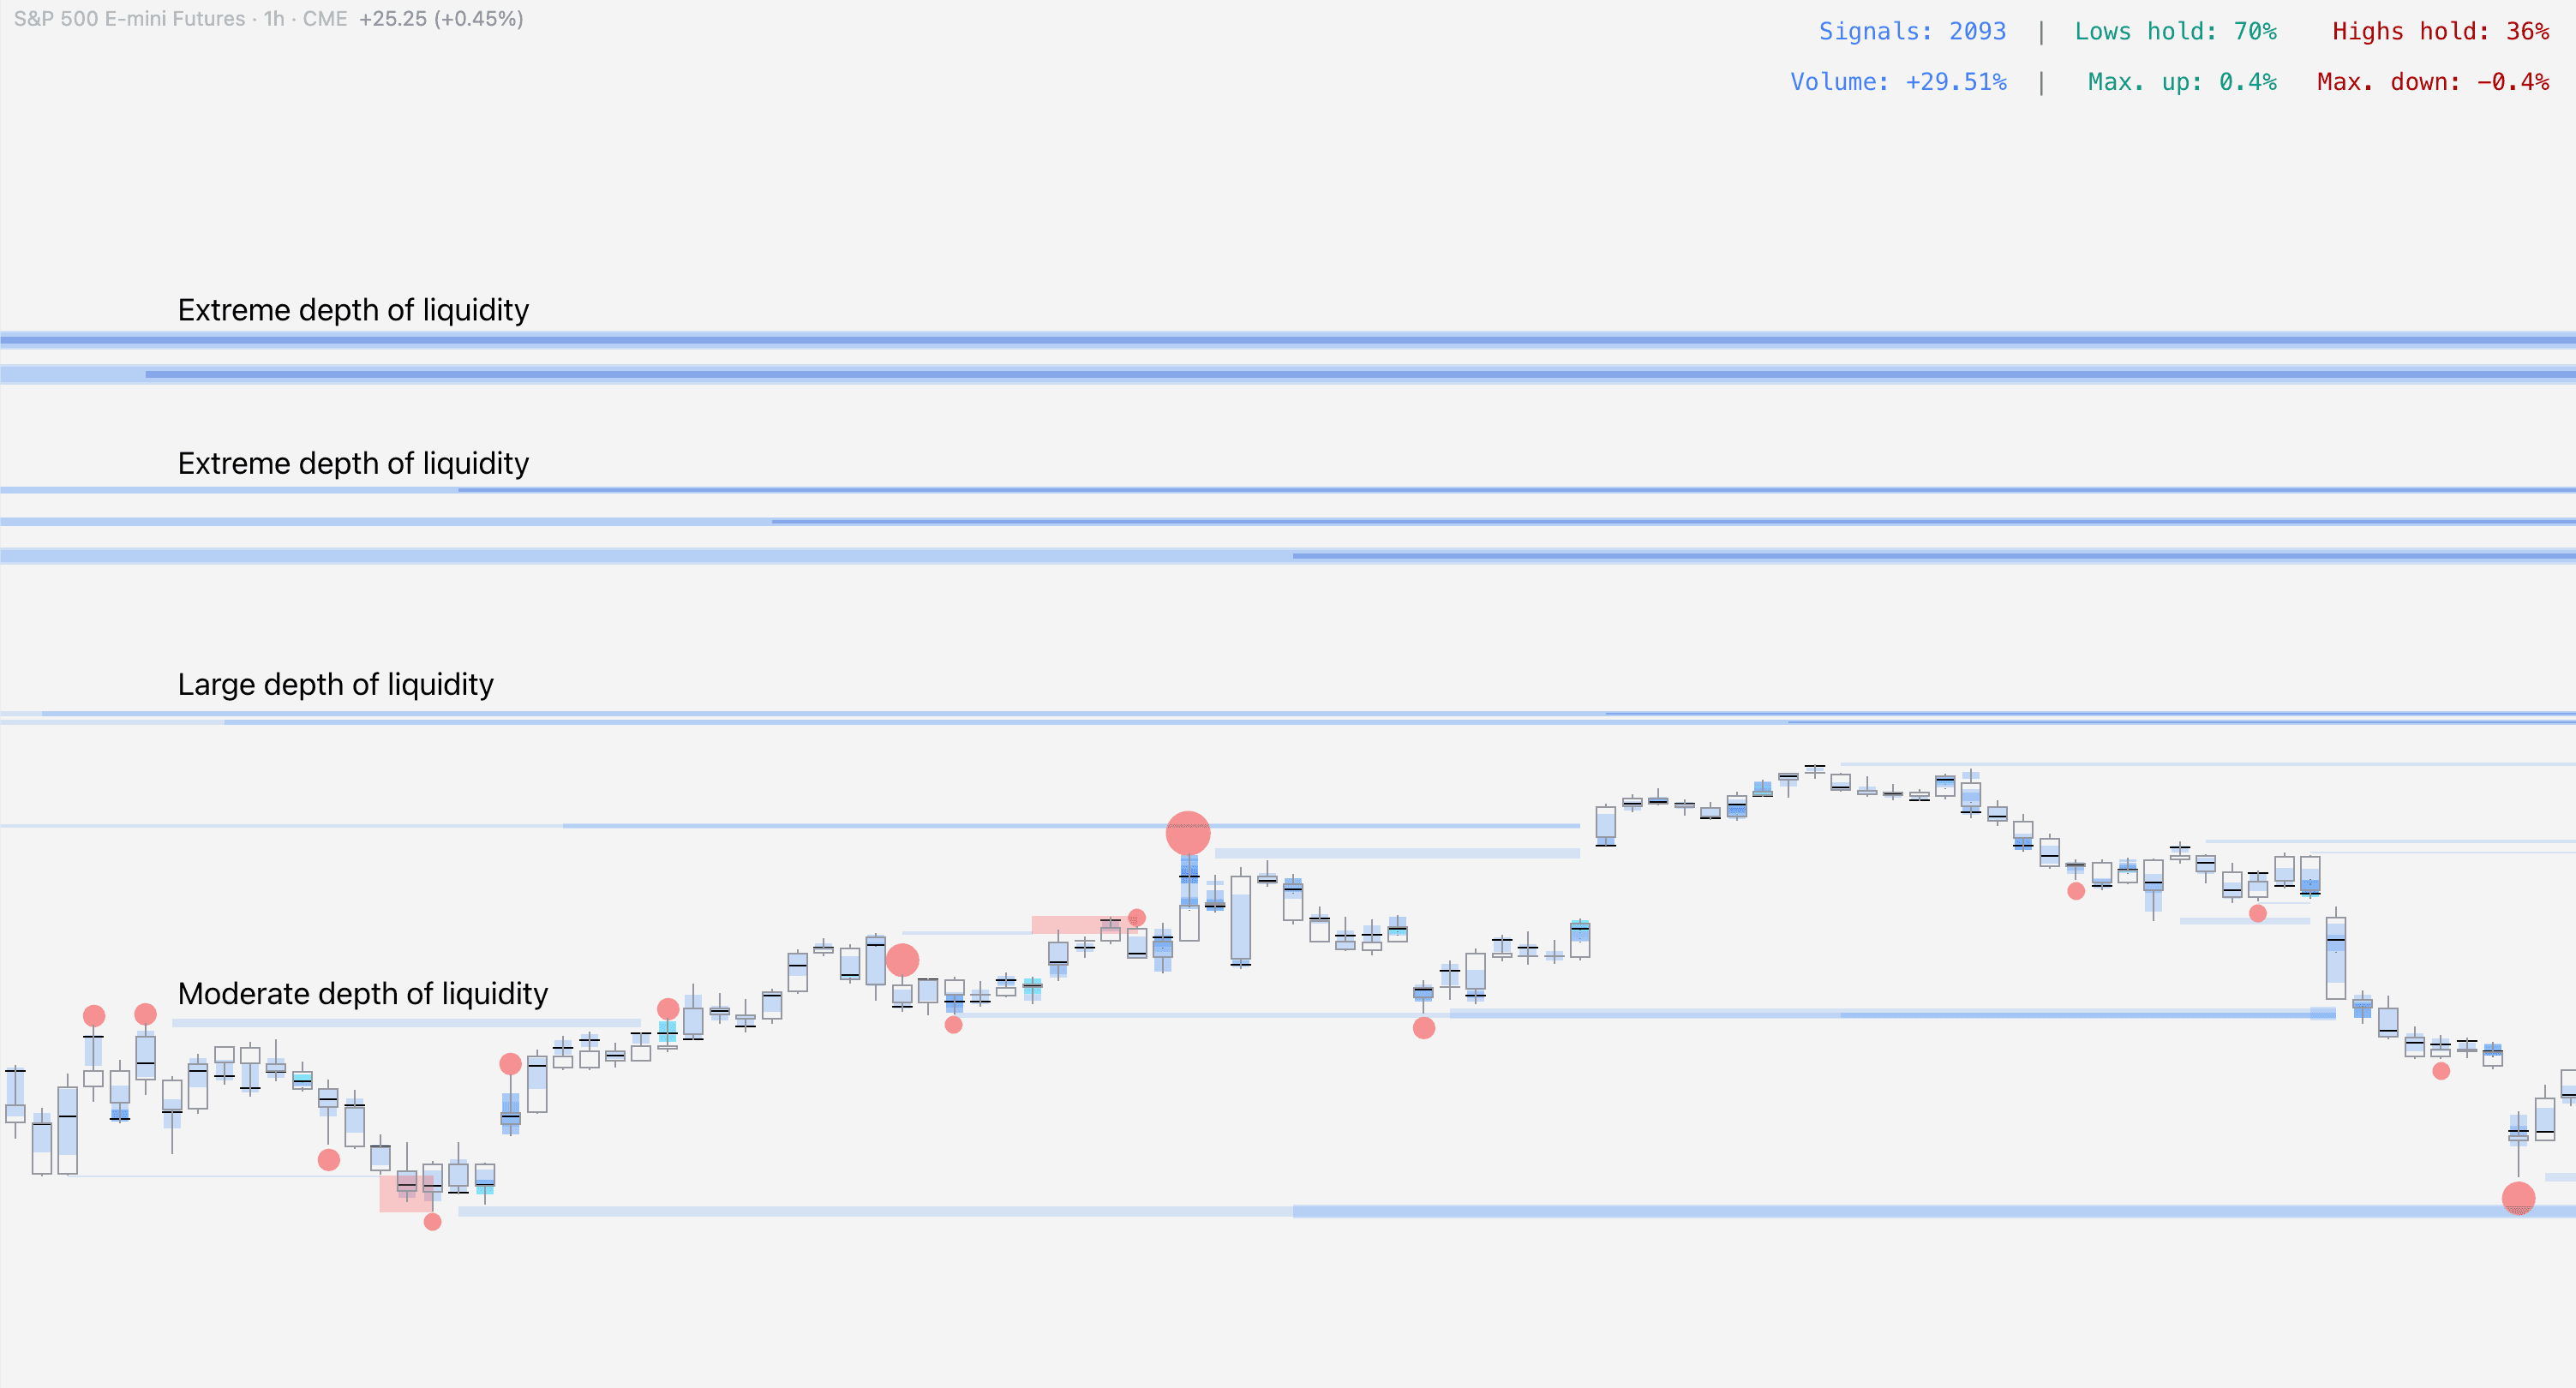
SubFlow Terminal is built to detect only deep liquidity where price is likely to find resistance. Deep liquidity is detected using specific type of turns in price that signal an underlying liquidity pool, responsible for the turn.
When a liquidity pool is detected, SubFlow Terminal estimates its depth using volume traded at the pool and amount of time it remains untapped.
The larger the estimated liquidity pool, the larger the line and brighter the color. Deep liquidity can also be gauged by looking for multiple overlapping lines.
Liquidity pool manipulation
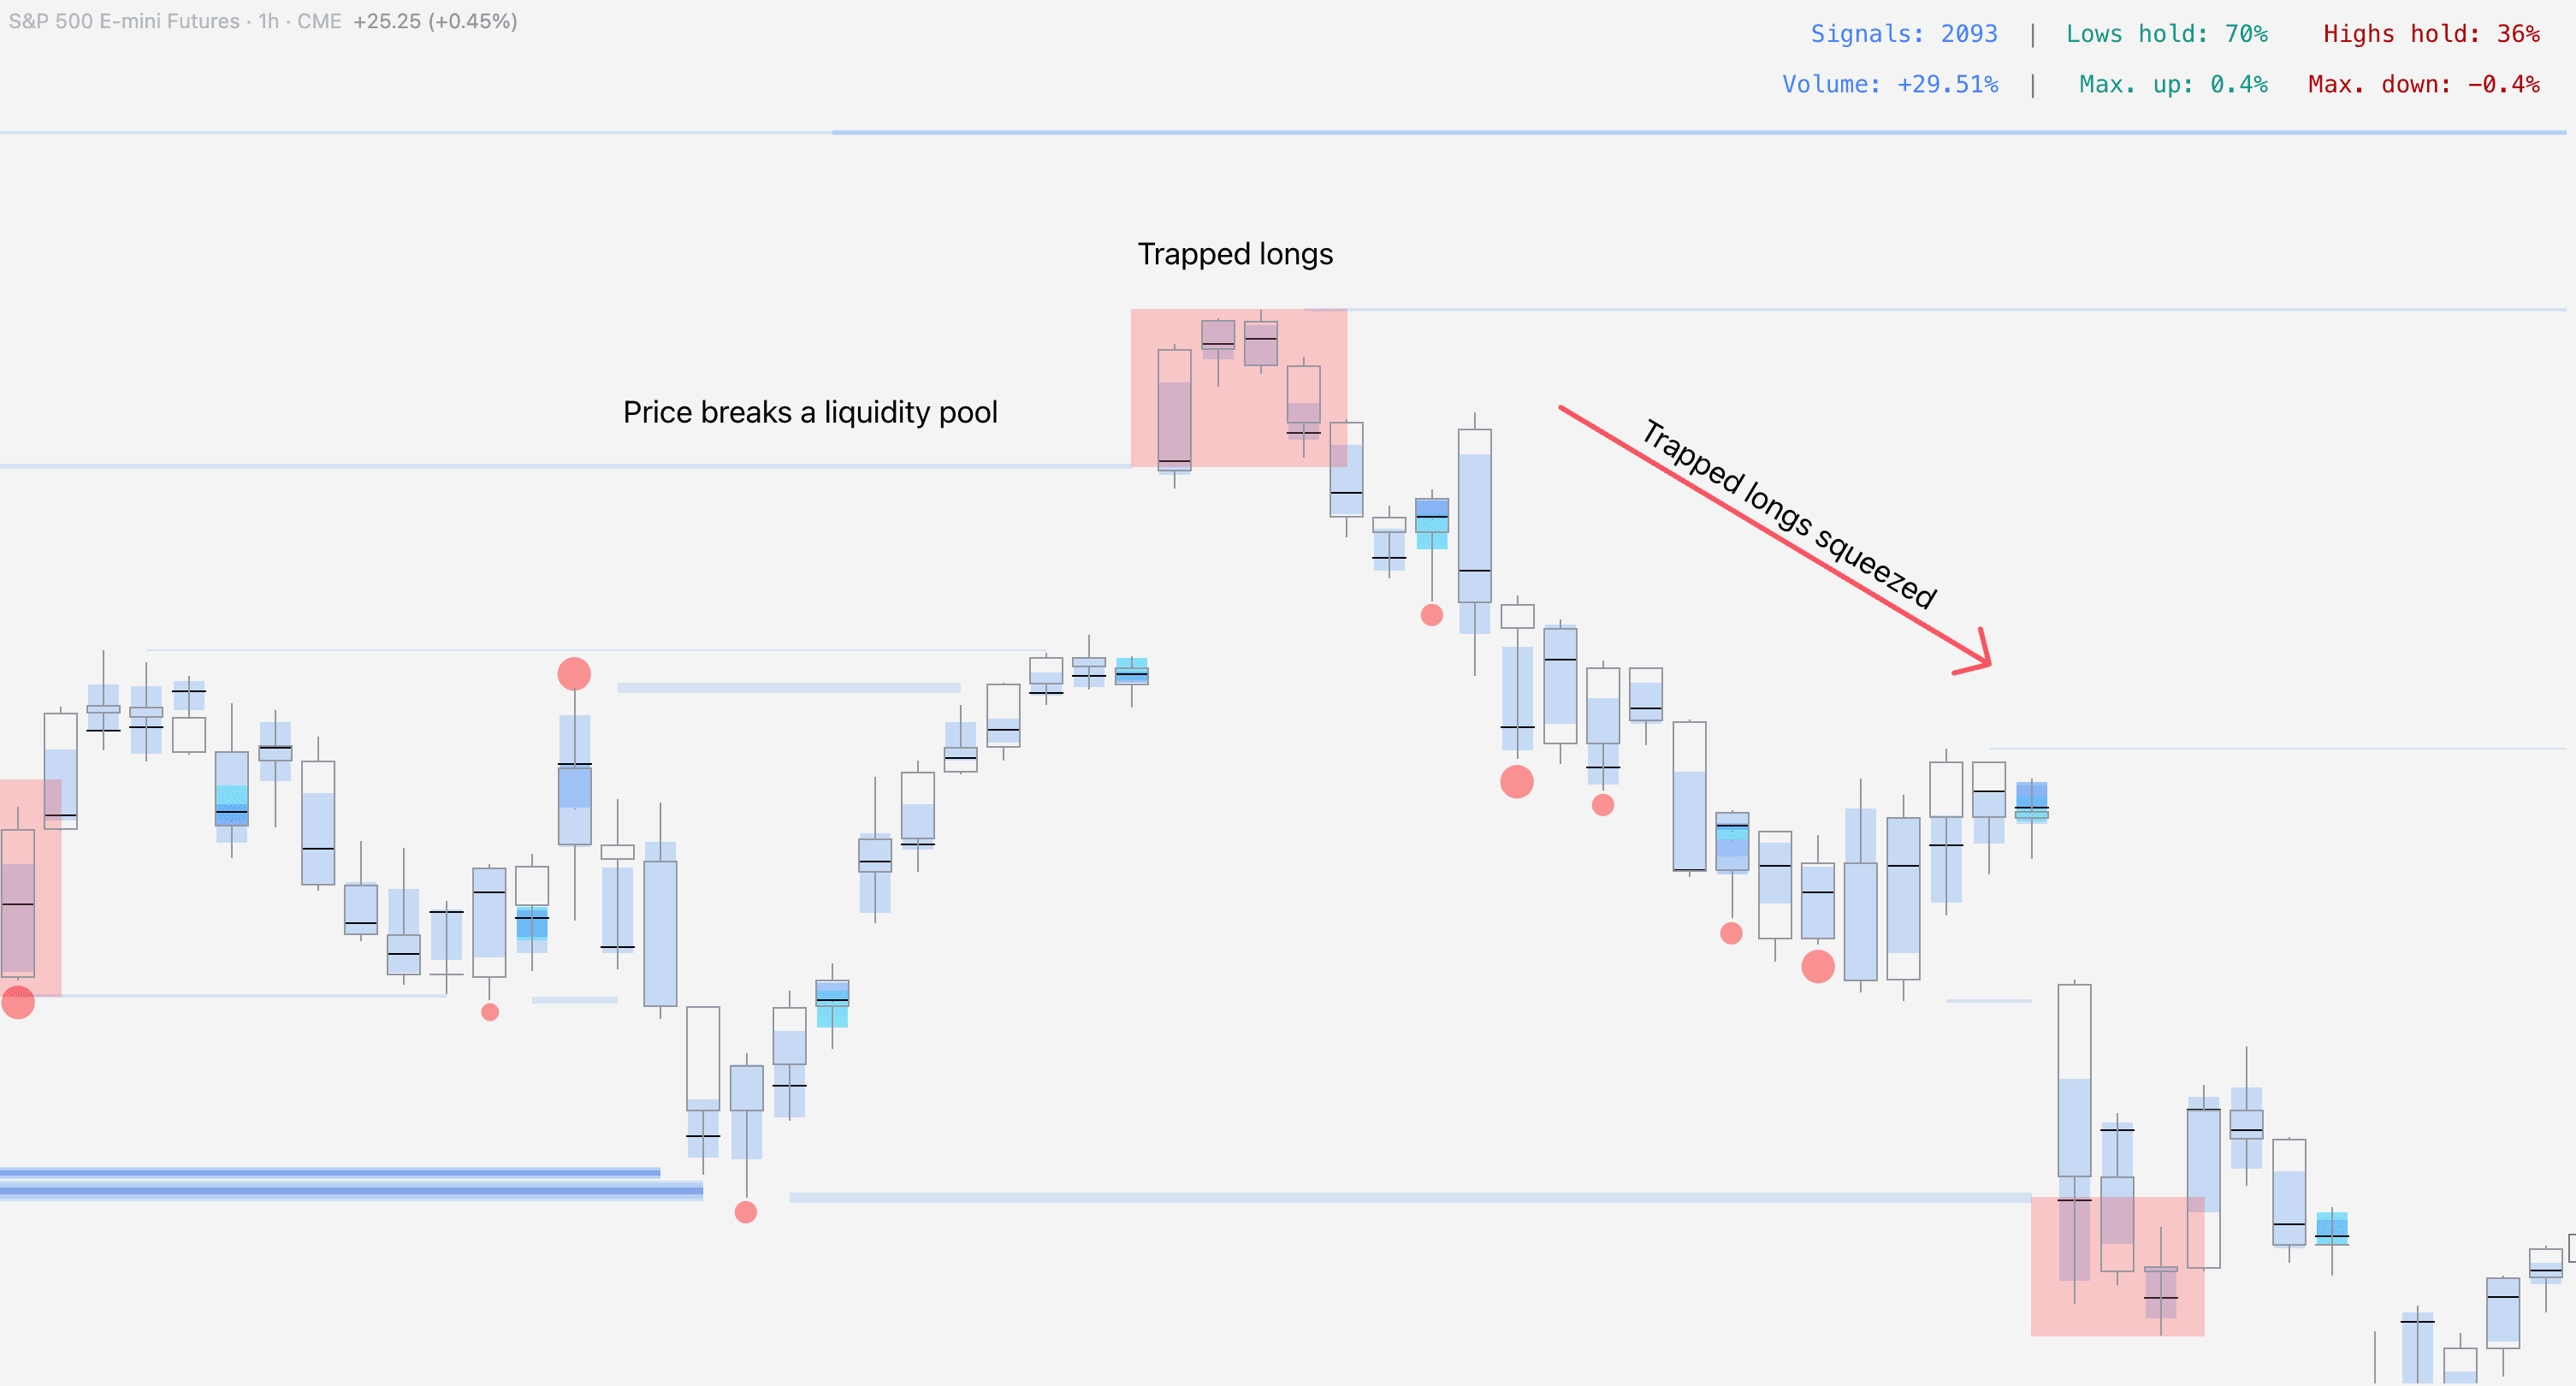
SubFlow Terminal also highlights events where a liquidity pool is exceeded and price closes back in, referred to as manipulation.
The idea behind manipulation is to identify extremes where traders have sold or bought into overwhelming limit orders set by larger players, leaving the participating traders as exit liquidity.
When market psychology starts to play out, these traders are compelled to cover their losses, further fueling a reversal.
Liquidity Heatmap in SubFlow Terminal
Before jumping into the heatmap itself, let's first go over what liquidity is.
Liquidity refers to buy and sell orders placed in an orderbook at various price levels. Depth of liquidity refers to how many buy and sell orders are clustered around various price levels.
Deep liquidity | Thin liquidity |
|---|---|
Buy/sell orders clustered in a narrow area in price | Buy/sell orders spread out across a larger area |
Price struggles to move to higher/lower prices, hard passage | Price doesn't struggle to move to higher/lower prices, easy passage |
Here's what deep and thin liquidity looks like in an orderbook.
As every buy order needs a seller and every sell order needs a buyer, price naturally finds resistance at deep liquidity where resting limit orders are overwhelming incoming market orders.
Here’s a ball-park illustration of how price can be expected to react at deep vs. thin liquidity.
How SubFlow Terminal estimates liquidity pools
SubFlow Terminal is built to detect only deep liquidity where price is likely to find resistance. Deep liquidity is detected using specific type of turns in price that signal an underlying liquidity pool, responsible for the turn.
When a liquidity pool is detected, SubFlow Terminal estimates its depth using volume traded at the pool and amount of time it remains untapped.
The larger the estimated liquidity pool, the larger the line and brighter the color. Deep liquidity can also be gauged by looking for multiple overlapping lines.
Liquidity pool manipulation
SubFlow Terminal also highlights events where a liquidity pool is exceeded and price closes back in, referred to as manipulation.
The idea behind manipulation is to identify extremes where traders have sold or bought into overwhelming limit orders set by larger players, leaving the participating traders as exit liquidity.
When market psychology starts to play out, these traders are compelled to cover their losses, further fueling a reversal.
Mentioned in this section
Dive deeper into topics mentioned
Mentioned in this section
Dive deeper into topics mentioned

Internal Flow in SubFlow Terminal
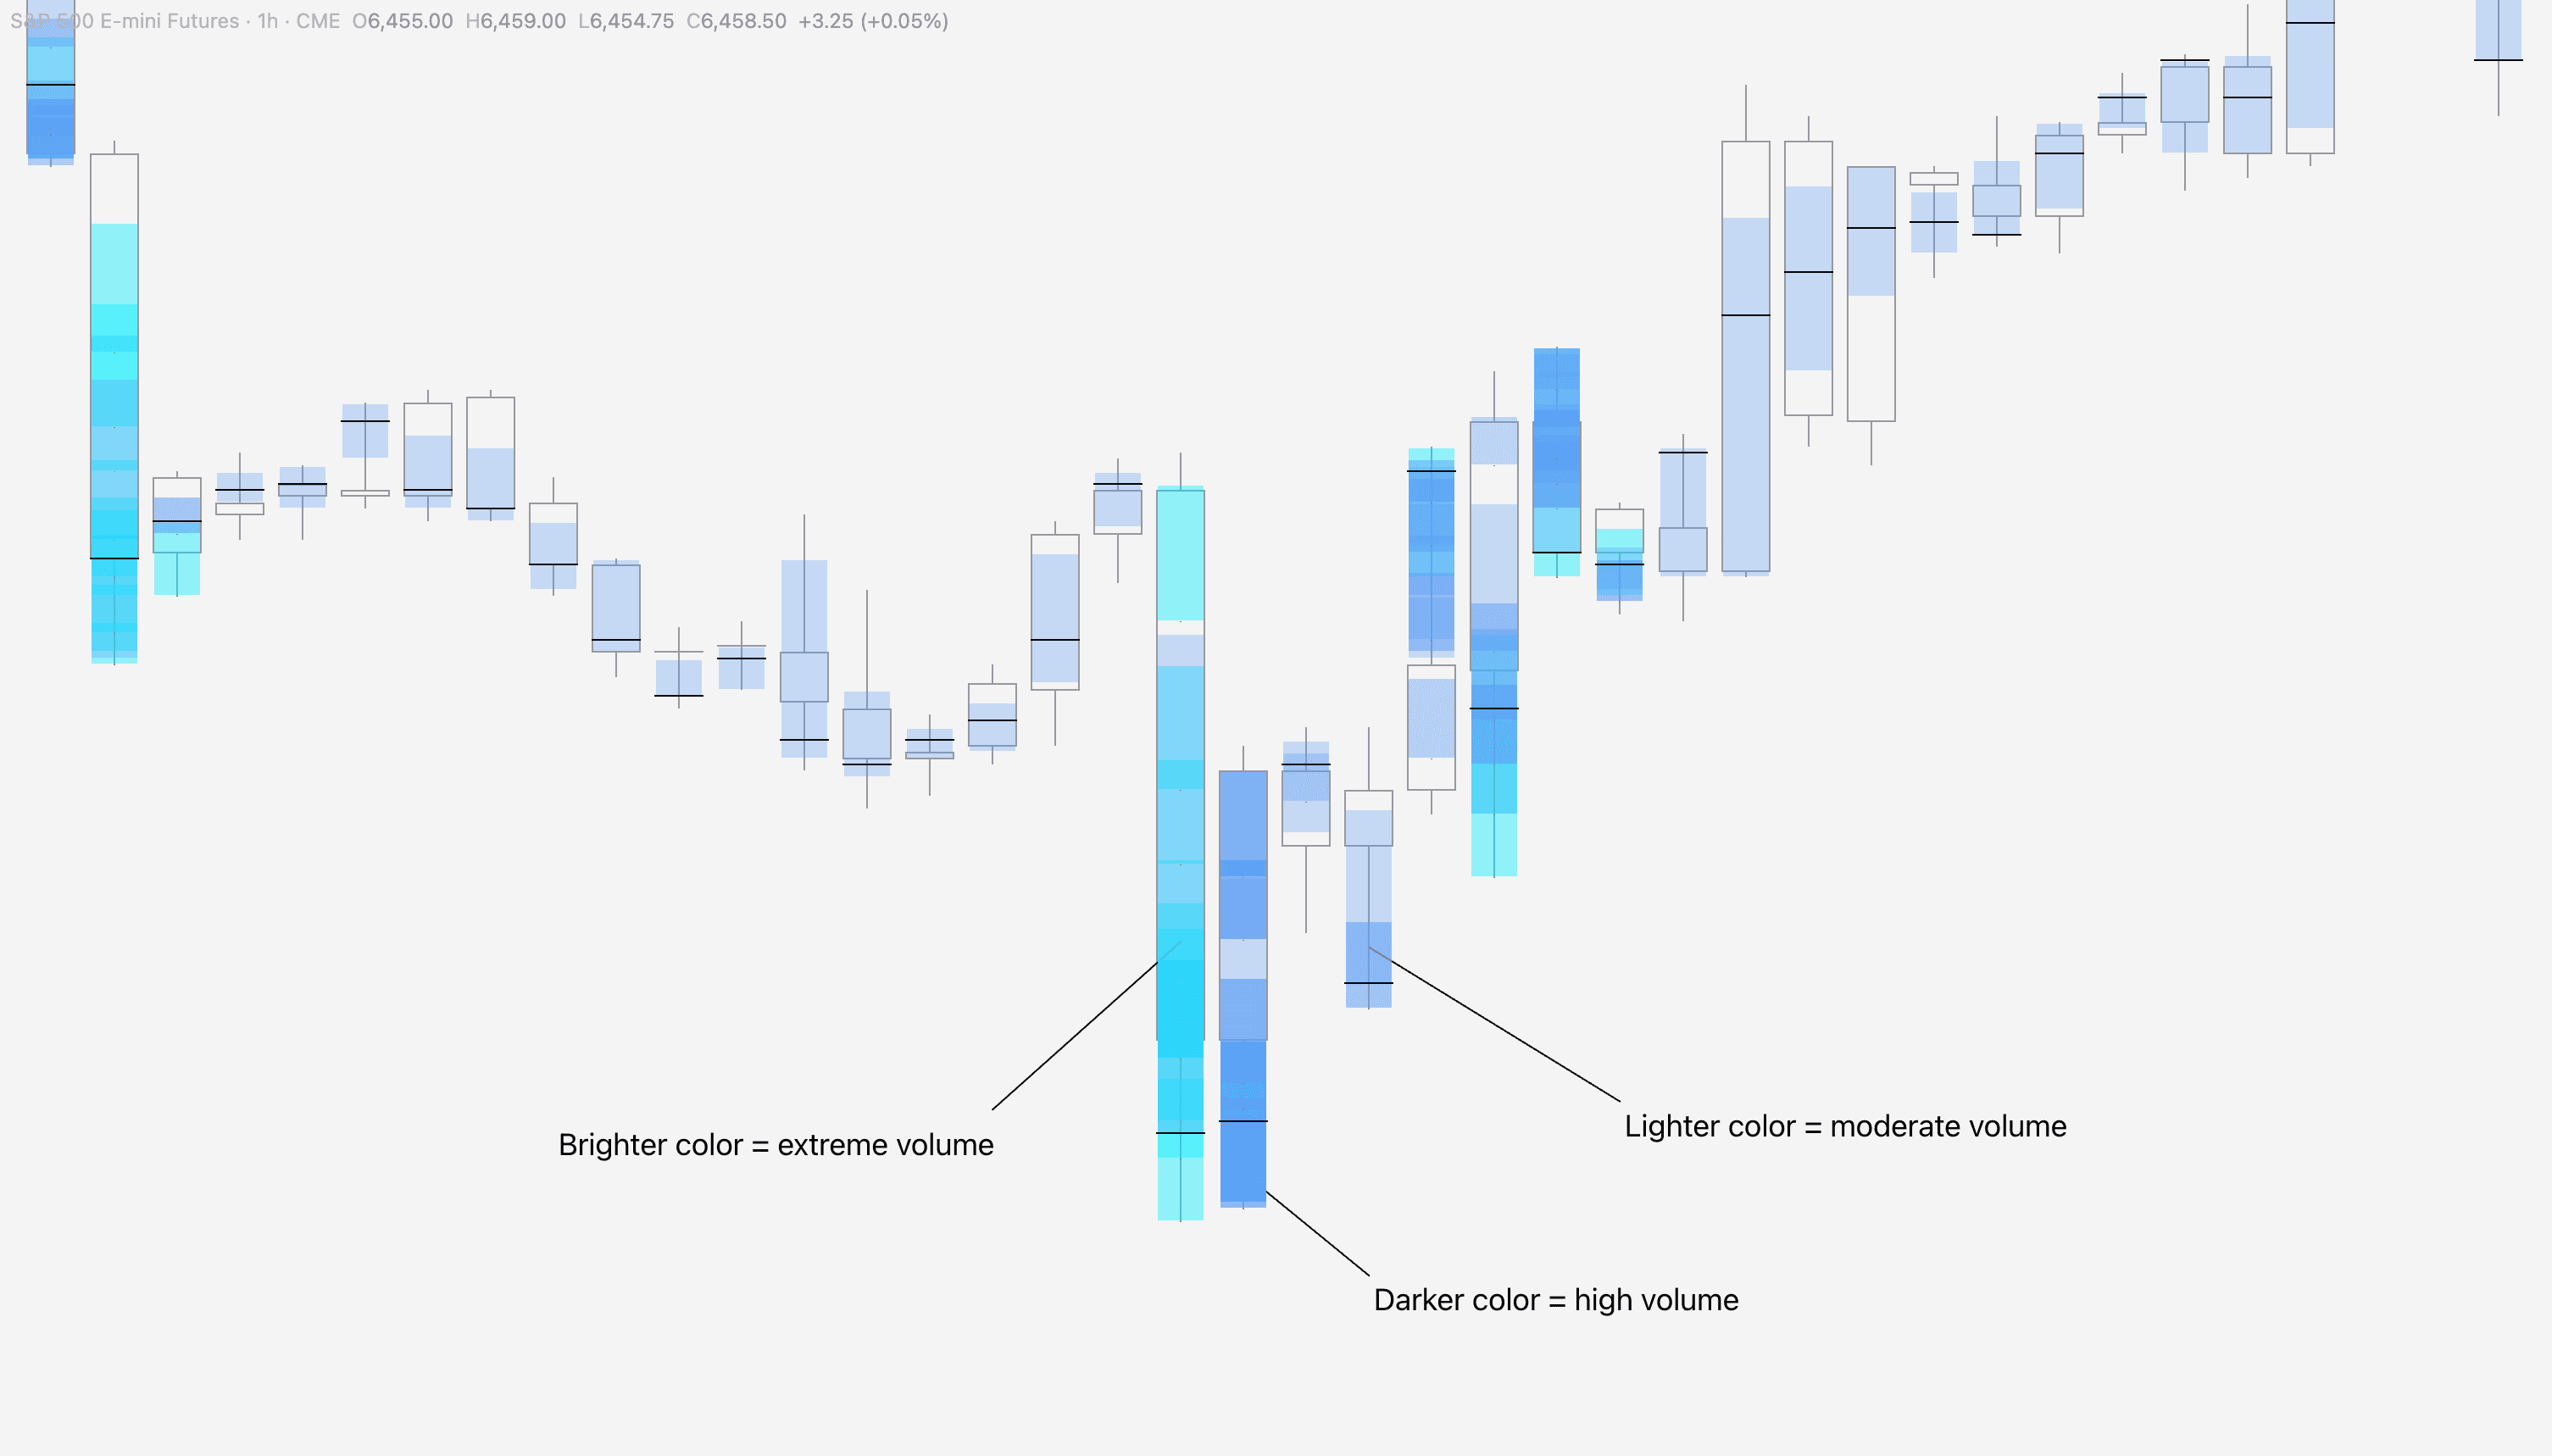
Internal Flow displays unusual volume activity taking place inside a candle, highlighted in a heatmap style - brighter color corresponding to higher volume.
In simple terms, Internal Flow shows an X-ray view of activity inside candles, revealing high value orders and key flows.
How Internal Flow is calculated in SubFlow Terminal
Internal Flow is calculated using lower timeframe price moves and the volume associated with them.
For example, on 1H chart SubFlow Terminal goes over 60x1 minute price moves inside the candle, assesses their volume and visualizes unusual activity.
SubFlow Terminal automatically chooses an appropriate lower timeframe that maintains same level of accuracy across all charts and timeframes.
Internal Flow in SubFlow Terminal
Internal Flow displays unusual volume activity taking place inside a candle, highlighted in a heatmap style - brighter color corresponding to higher volume.
In simple terms, Internal Flow shows an X-ray view of activity inside candles, revealing high value orders and key flows.
How Internal Flow is calculated in SubFlow Terminal
Internal Flow is calculated using lower timeframe price moves and the volume associated with them.
For example, on 1H chart SubFlow Terminal goes over 60x1 minute price moves inside the candle, assesses their volume and visualizes unusual activity.
SubFlow Terminal automatically chooses an appropriate lower timeframe that maintains same level of accuracy across all charts and timeframes.
Mentioned in this section
Dive deeper into topics mentioned
Mentioned in this section
Dive deeper into topics mentioned

Value Area & Point of Control in SubFlow Terminal
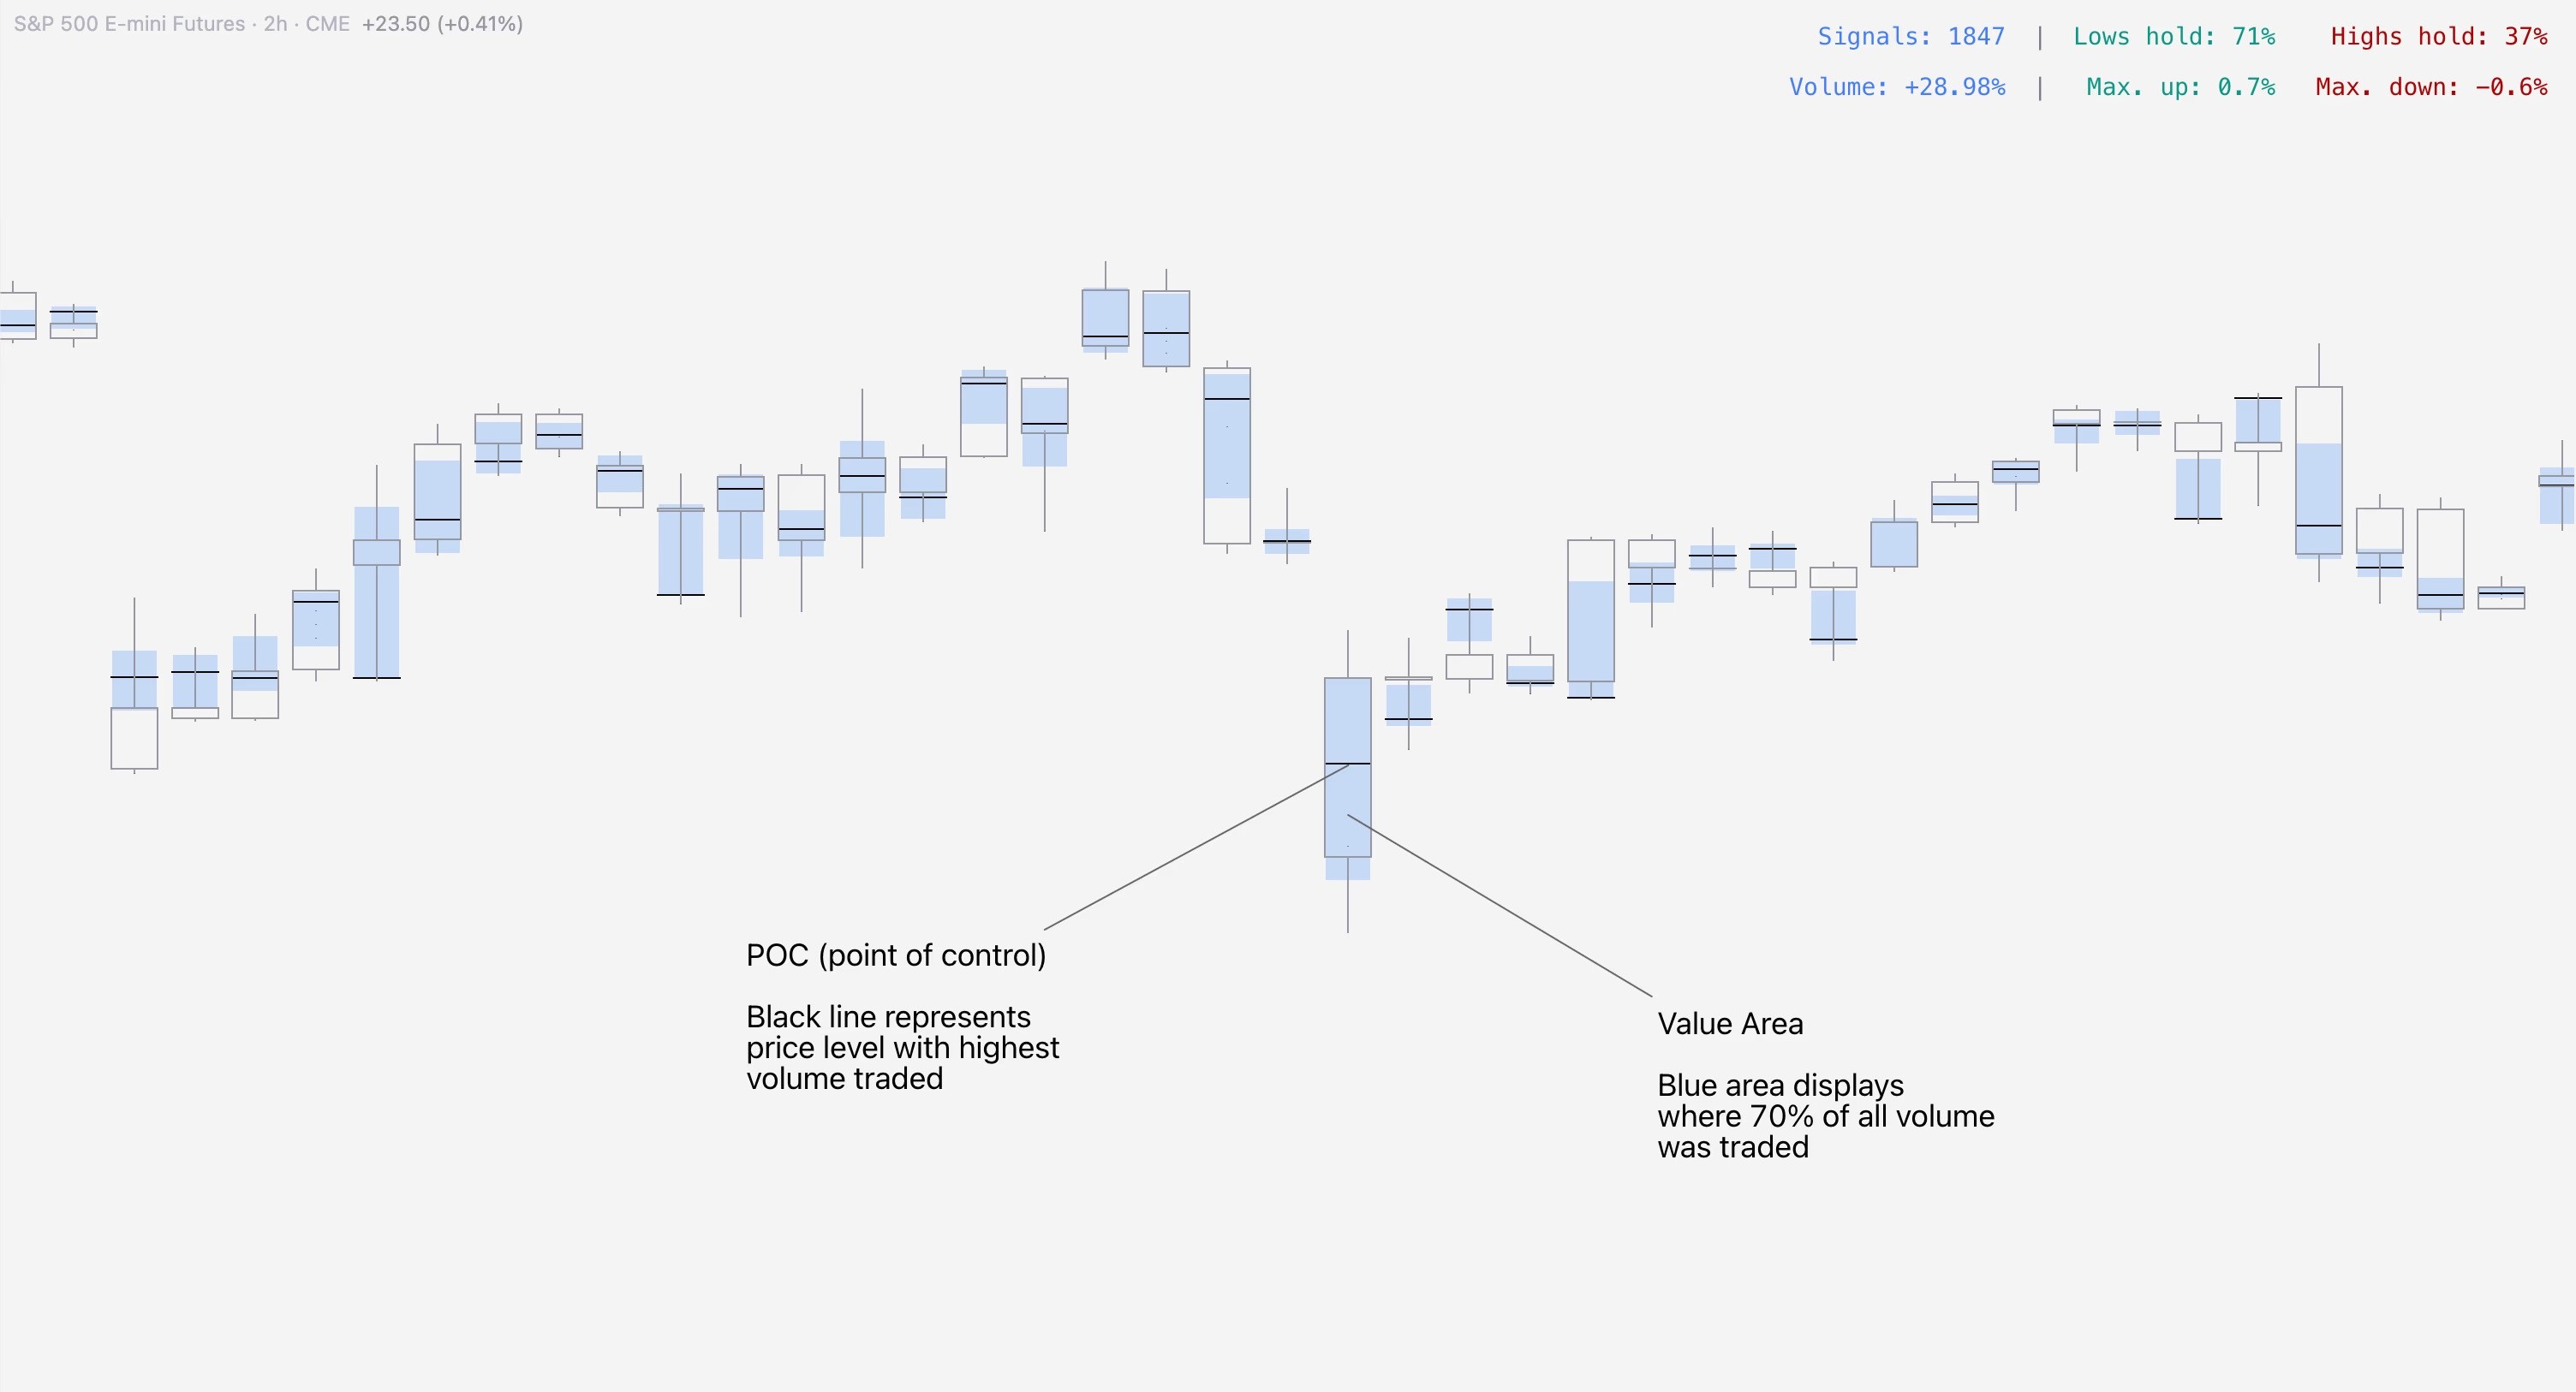
Sometimes a candle does not have high value orders or extreme activity, but it is regardless useful to know where most volume and highest volume was traded.
Value Area displays area in each candle where 70% (customizable) of the volume was traded, visualized using a blue box.
Point of Control (POC), displays point in price where highest amount of volume was traded, visualized using a black horizontal line.
How Value Area & POC are calculated in SubFlow Terminal
Like with Internal Flow, Value Area and POC are also calculated using lower timeframe price moves.
Using same 1H chart example, SubFlow Terminal goes over 60x1 minute price moves inside the candle to calculate range where 70% of all volume was traded (Value Area) and where the highest amount of volume was traded (Point of Control).
Value Area & Point of Control in SubFlow Terminal
Sometimes a candle does not have high value orders or extreme activity, but it is regardless useful to know where most volume and highest volume was traded.
Value Area displays area in each candle where 70% (customizable) of the volume was traded, visualized using a blue box.
Point of Control (POC), displays point in price where highest amount of volume was traded, visualized using a black horizontal line.
How Value Area & POC are calculated in SubFlow Terminal
Like with Internal Flow, Value Area and POC are also calculated using lower timeframe price moves.
Using same 1H chart example, SubFlow Terminal goes over 60x1 minute price moves inside the candle to calculate range where 70% of all volume was traded (Value Area) and where the highest amount of volume was traded (Point of Control).
Mentioned in this section
Dive deeper into topics mentioned
Mentioned in this section
Dive deeper into topics mentioned

Liquidations in SubFlow Terminal
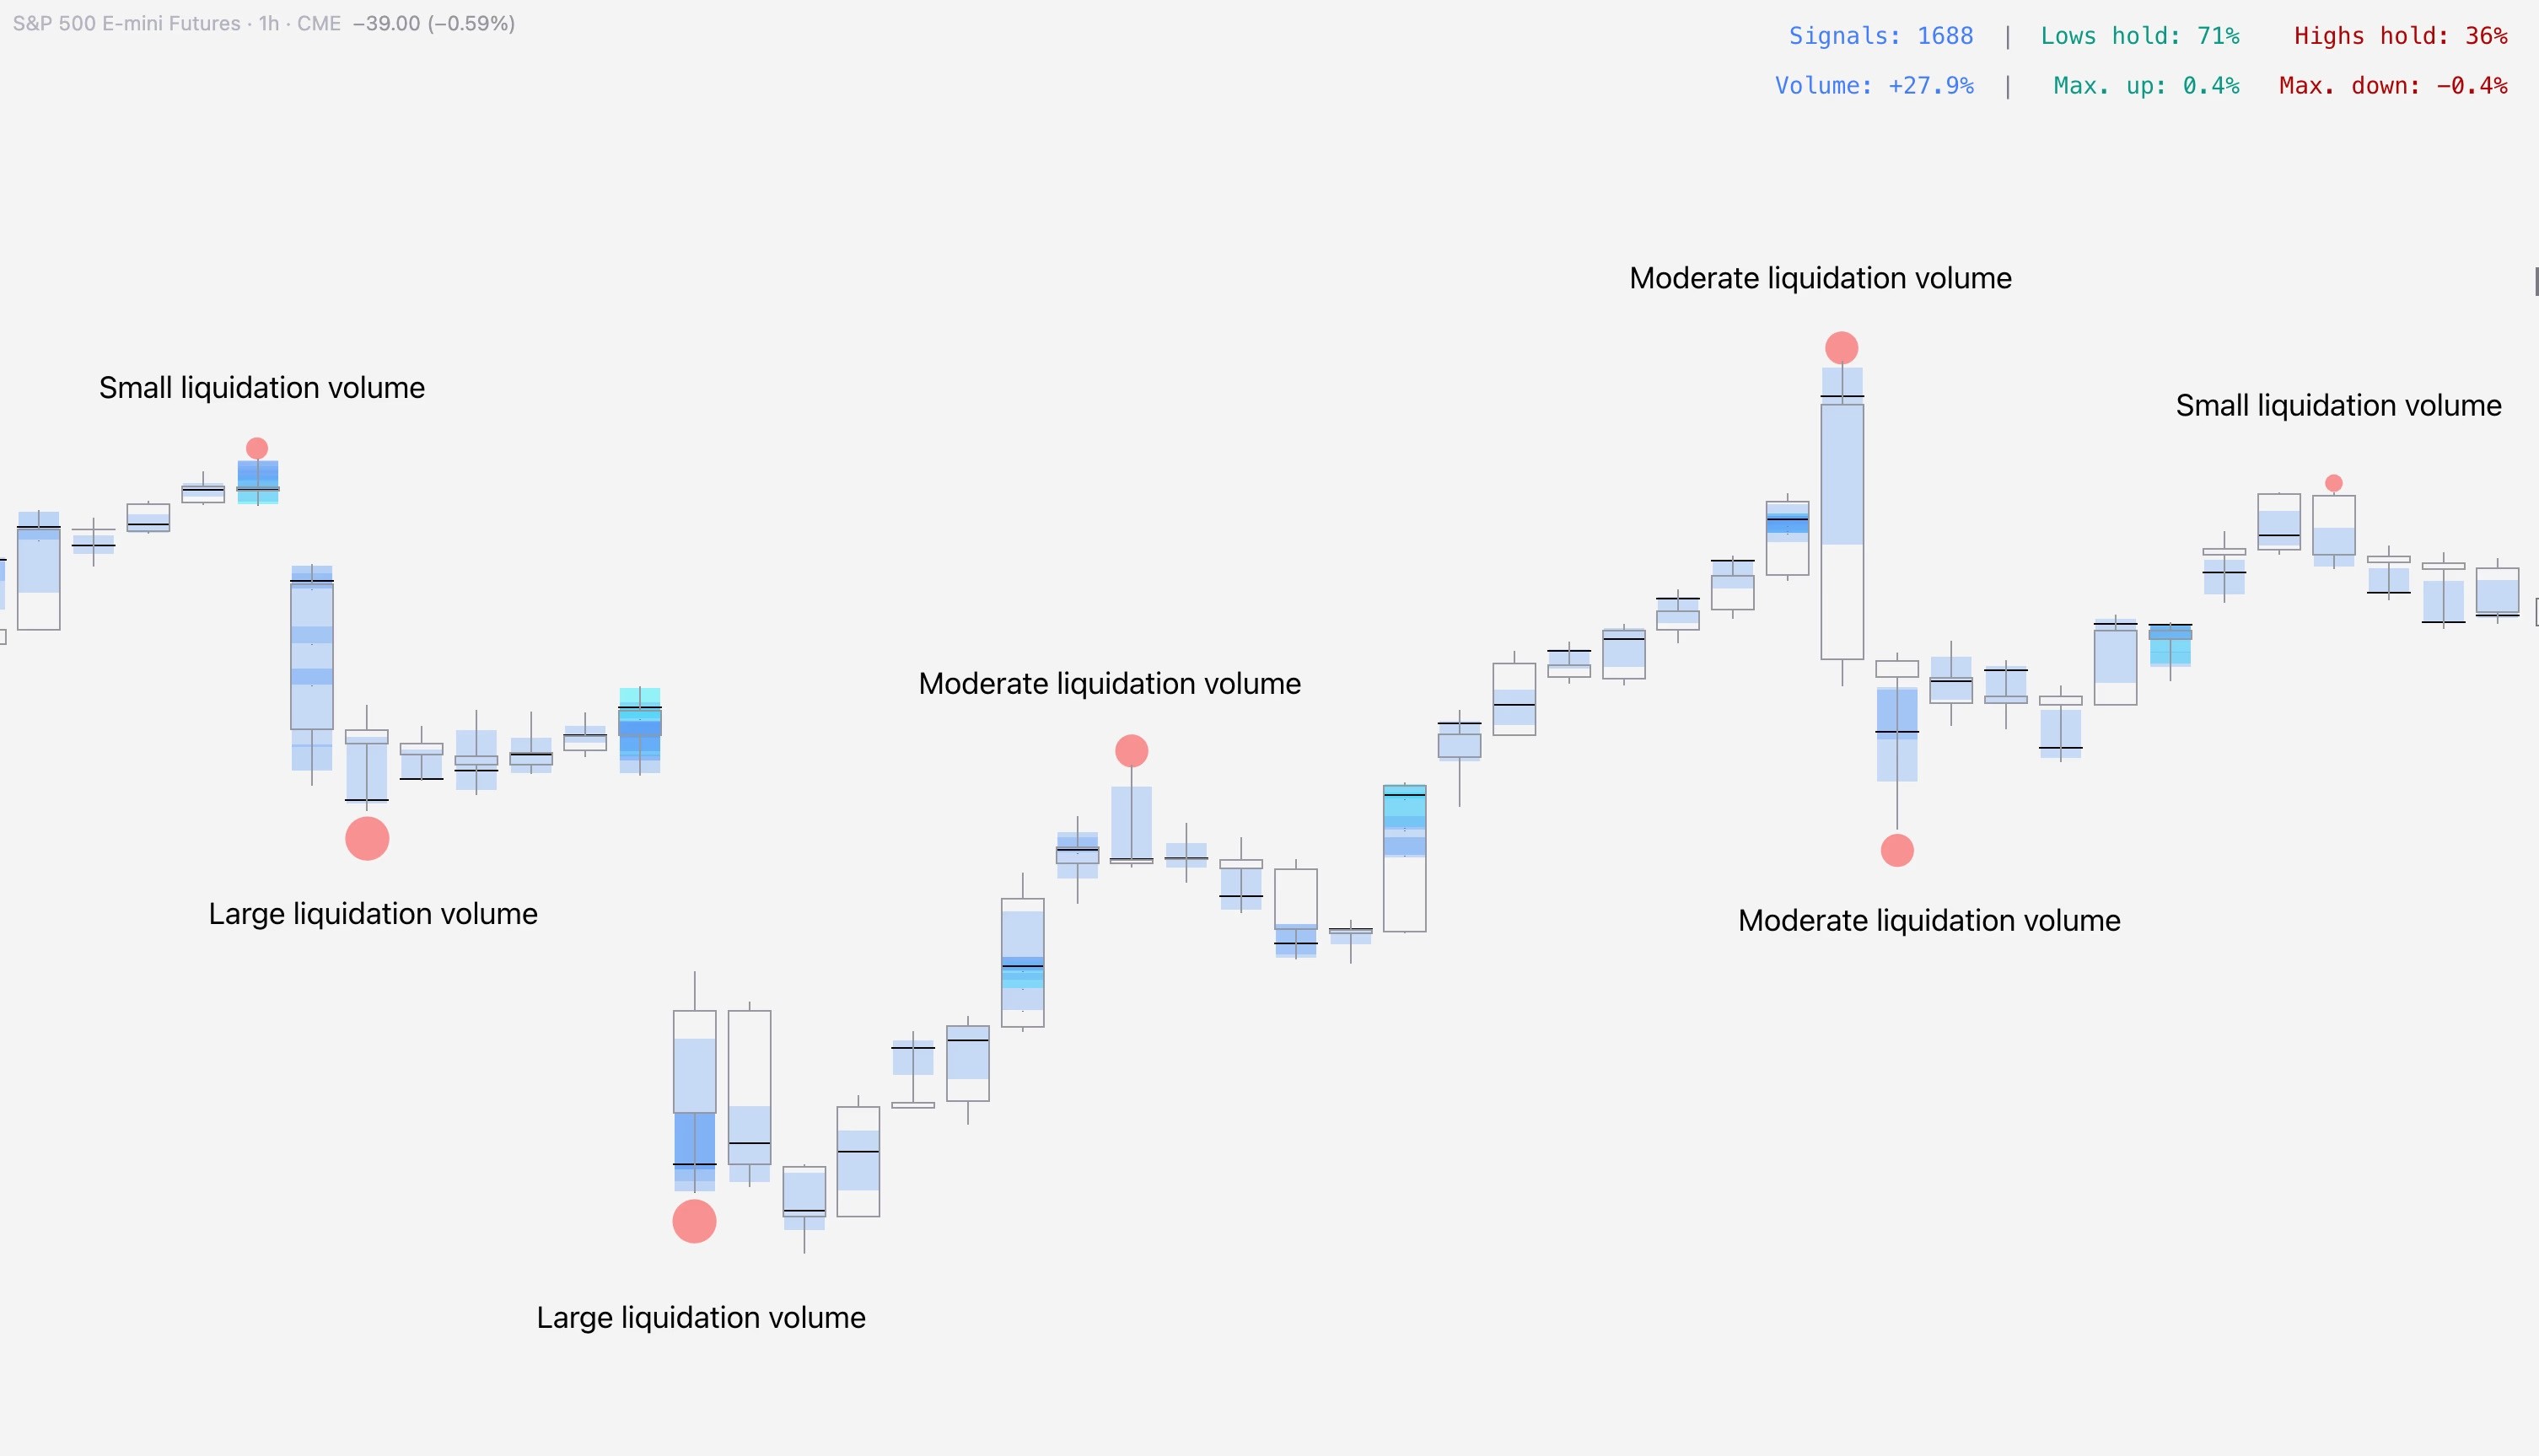
Liquidations are detected by a complex algorithm that uses volume and price anomalies to identify events where traders were forcefully liquidated.
In simple terms, liquidations signify traders who have suffered significant losses and pain, leaving price exhausted and creating a window of opportunity for a reversal/halt in price.
Size of the bubbles indicate estimated amount of realized liquidations. The bigger the bubble, the more liquidations.
Liquidations in SubFlow Terminal
Liquidations are detected by a complex algorithm that uses volume and price anomalies to identify events where traders were forcefully liquidated.
In simple terms, liquidations signify traders who have suffered significant losses and pain, leaving price exhausted and creating a window of opportunity for a reversal/halt in price.
Size of the bubbles indicate estimated amount of realized liquidations. The bigger the bubble, the more liquidations.
Mentioned in this section
Dive deeper into topics mentioned
Mentioned in this section
Dive deeper into topics mentioned

Signal builder
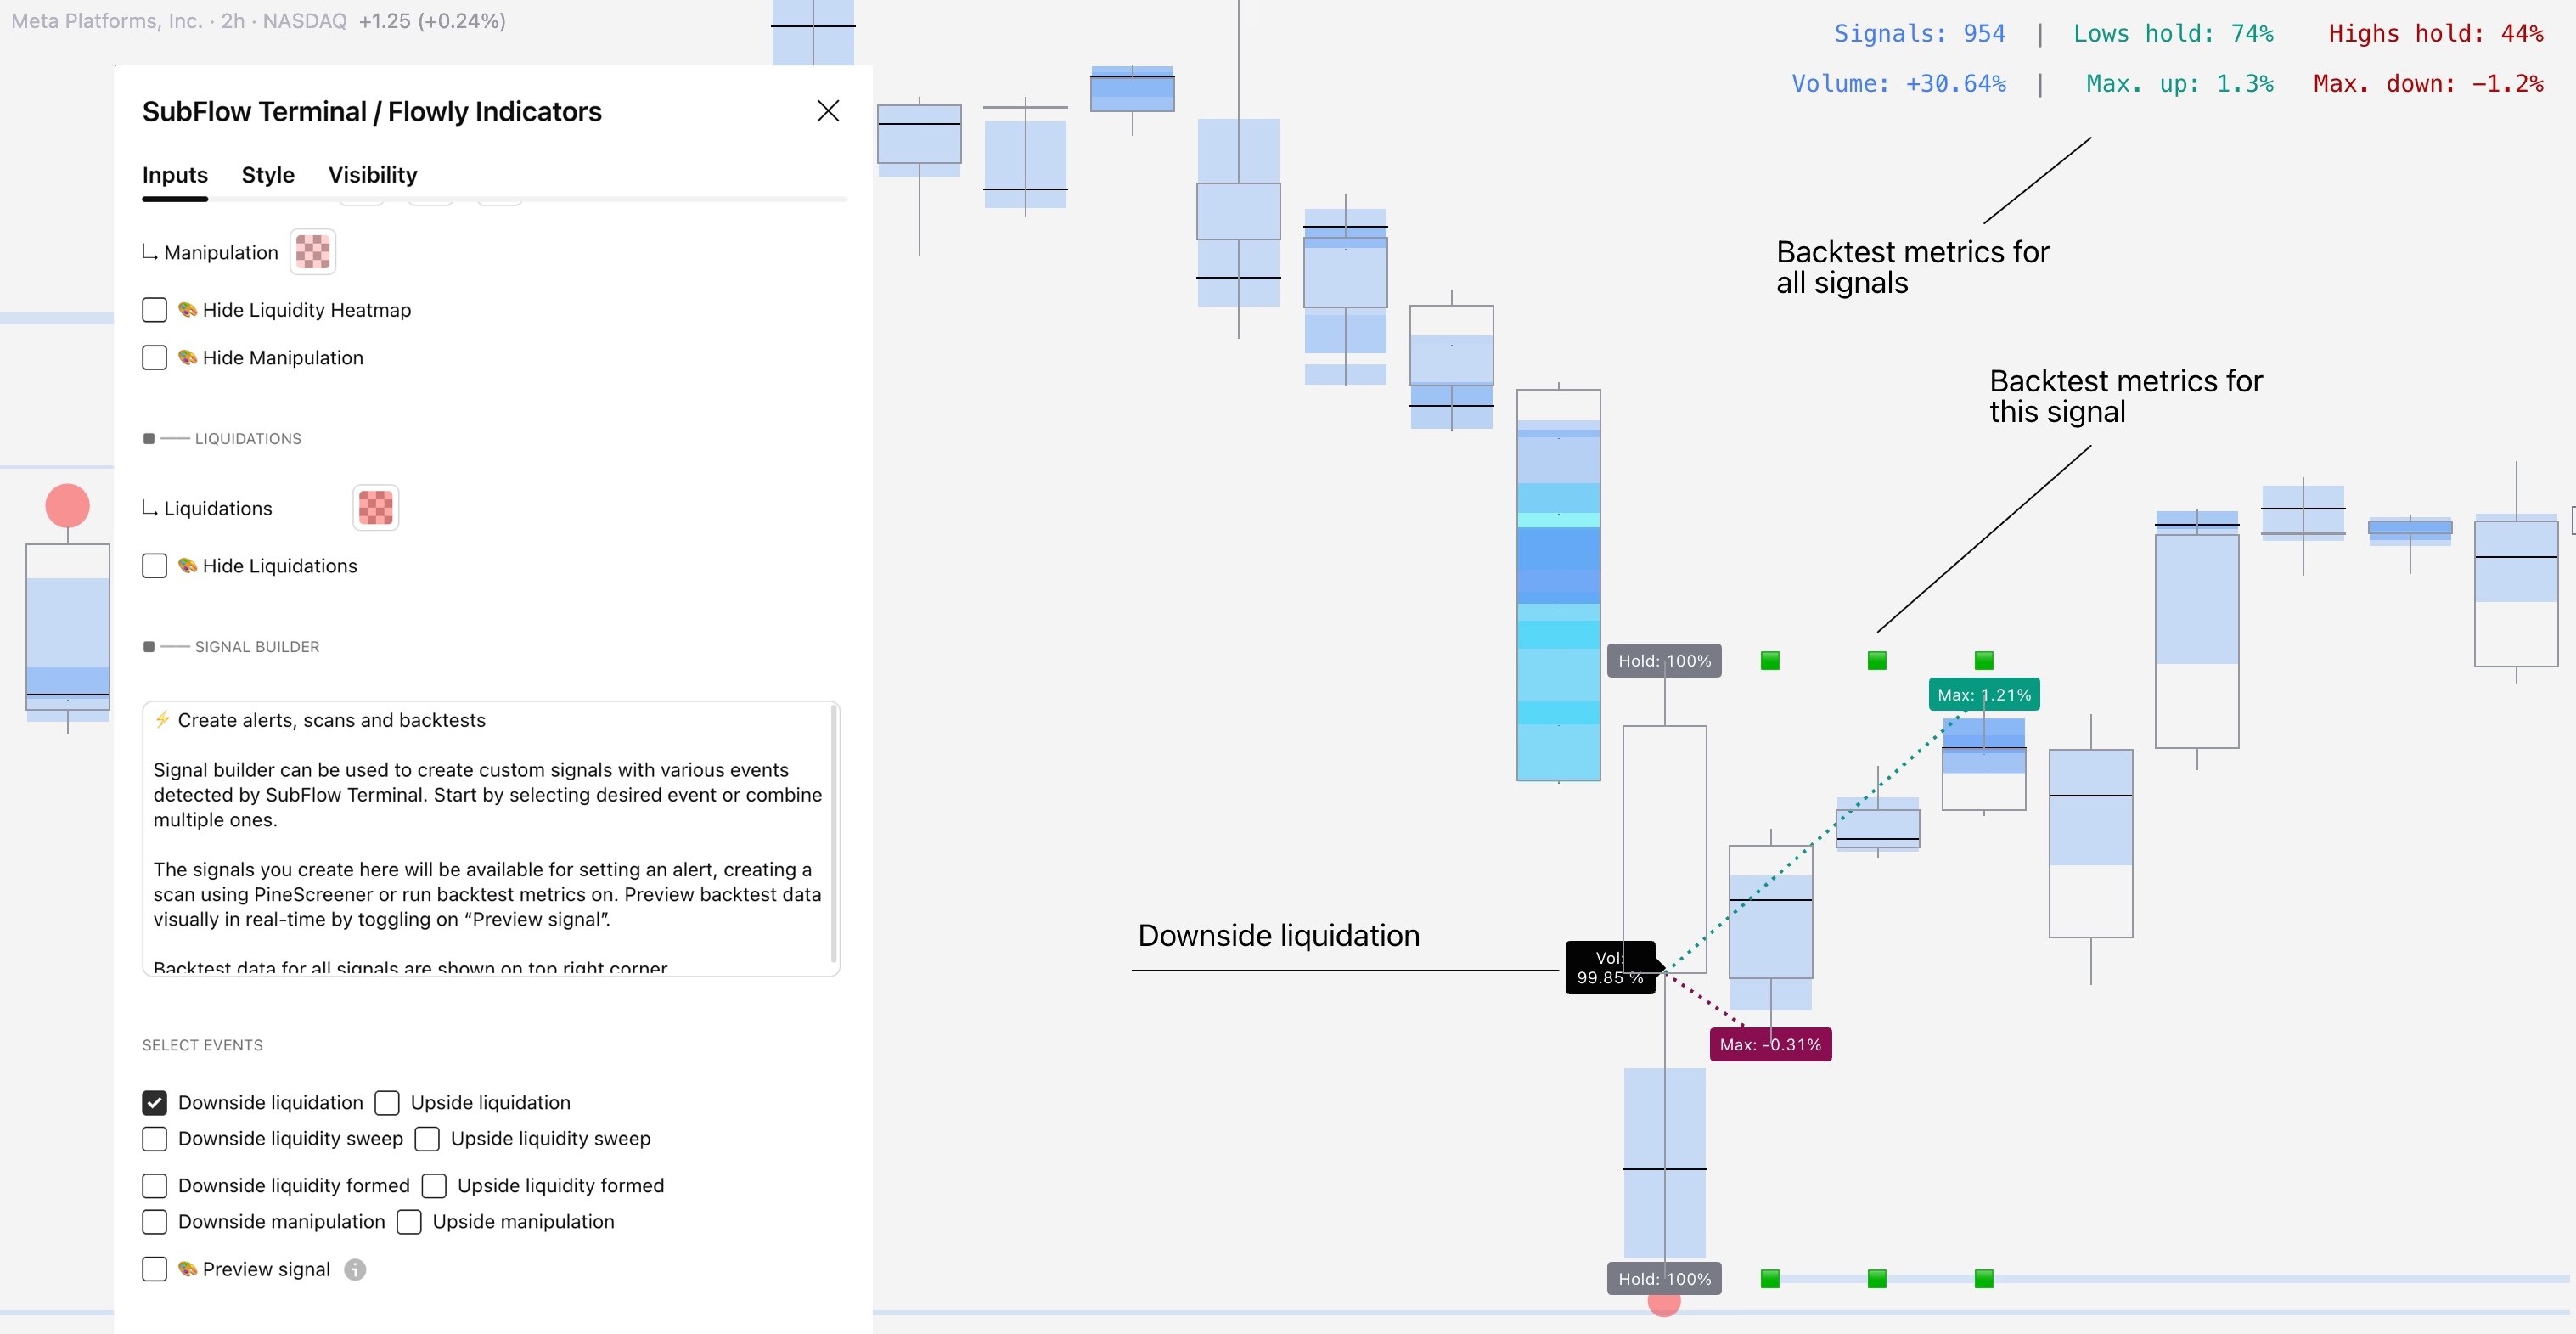
Signal builder can be used to build custom orderflow based signals using any single event or combining multiple. Once signal is defined and built, it can be used for backtesting, creating alerts and market scans.
The following events are available for creating a signal:
- Liquidations
- Liquidity pool sweeps
- Liquidity pool confirmed
- Manipulation
Signals can be previewed on chart visually, showing where they have historically triggered. Preview mode also shows backtest metrics for each signal.
Signal builder
Signal builder can be used to build custom orderflow based signals using any single event or combining multiple. Once signal is defined and built, it can be used for backtesting, creating alerts and market scans.
The following events are available for creating a signal:
- Liquidations
- Liquidity pool sweeps
- Liquidity pool confirmed
- Manipulation
Signals can be previewed on chart visually, showing where they have historically triggered. Preview mode also shows backtest metrics for each signal.
Backtesting & Analytics
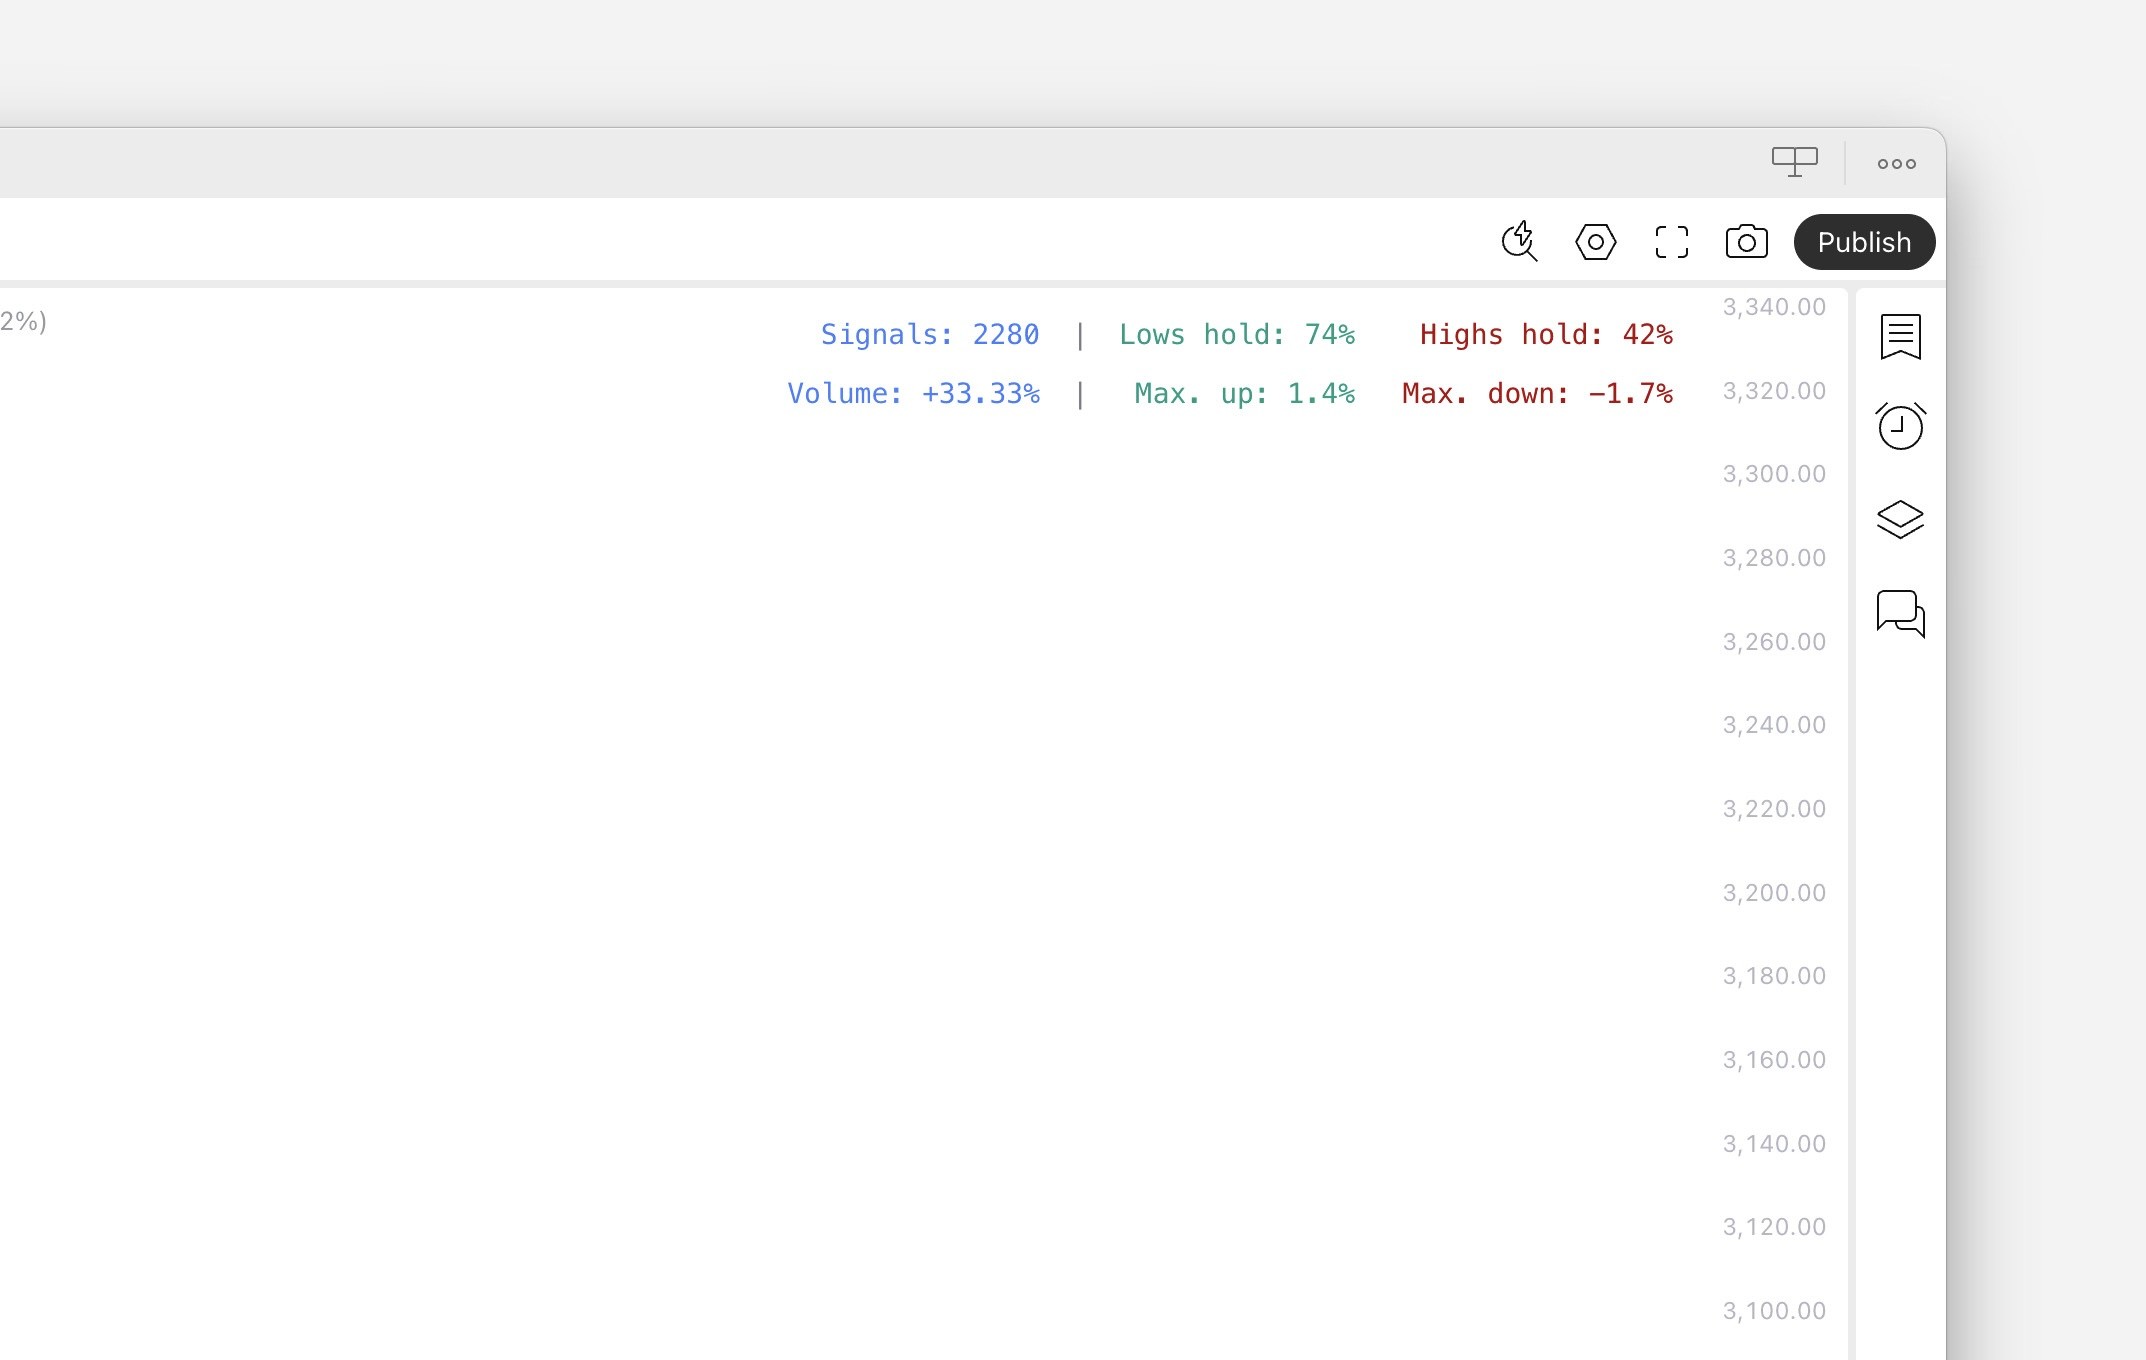
Once conditions are defined using Signal builder, SubFlow Terminal detects each occurrence of the signal and measures its performance using price and volume metrics, shown on the right side table.
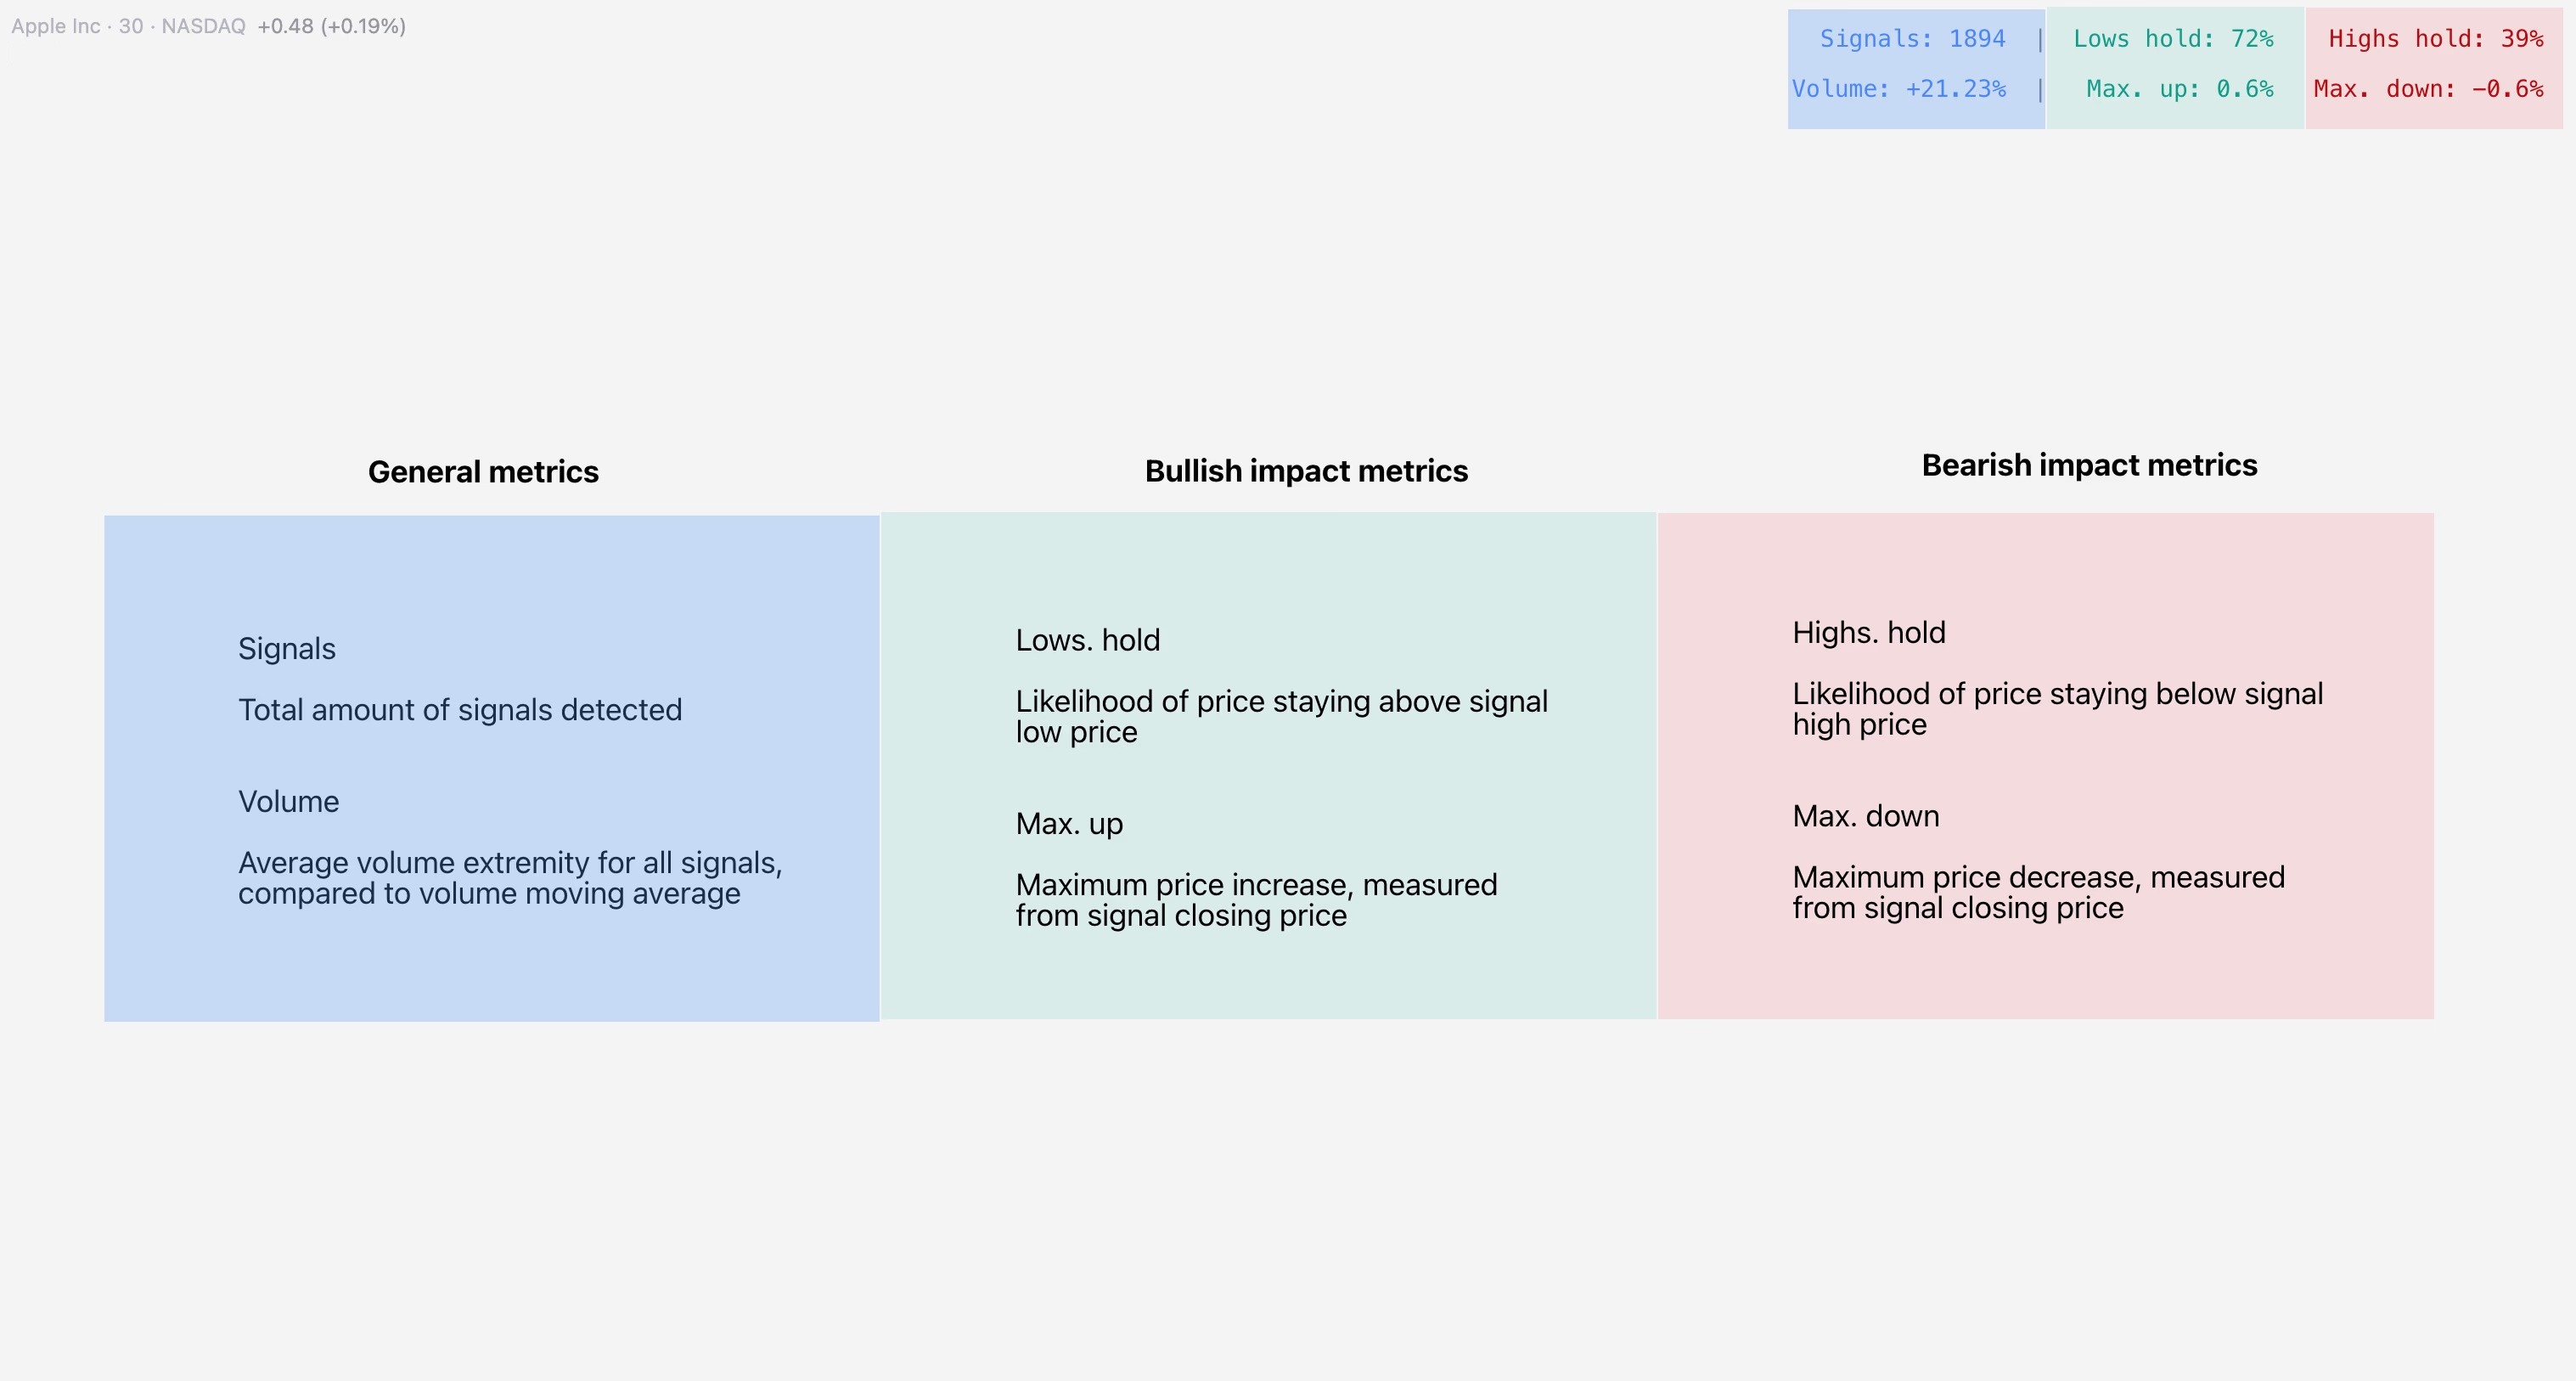
Amount of signals
Amount of signals shows how many times the custom signal has occurred through the chart’s history.
Volume test
Volume test refers to how much volume traded at signal is above/below average volume. This concept is also known as relative volume, comparing current volume traded to a historical average (average of 20 historical candles).
Example: When volume gain is +30%, volume traded at signal is typically 30% higher than average. Volume test allows us to validate and measure liquidity depth typically found when signal fires.
Highs/lows hold test
Highs/lows hold test measures likelihood of price staying above signal low price (bullish impact test) and staying below signal high price (bearish impact test). This test is measured for 3 candles after signal confirmation, giving us an idea of resistance in price.
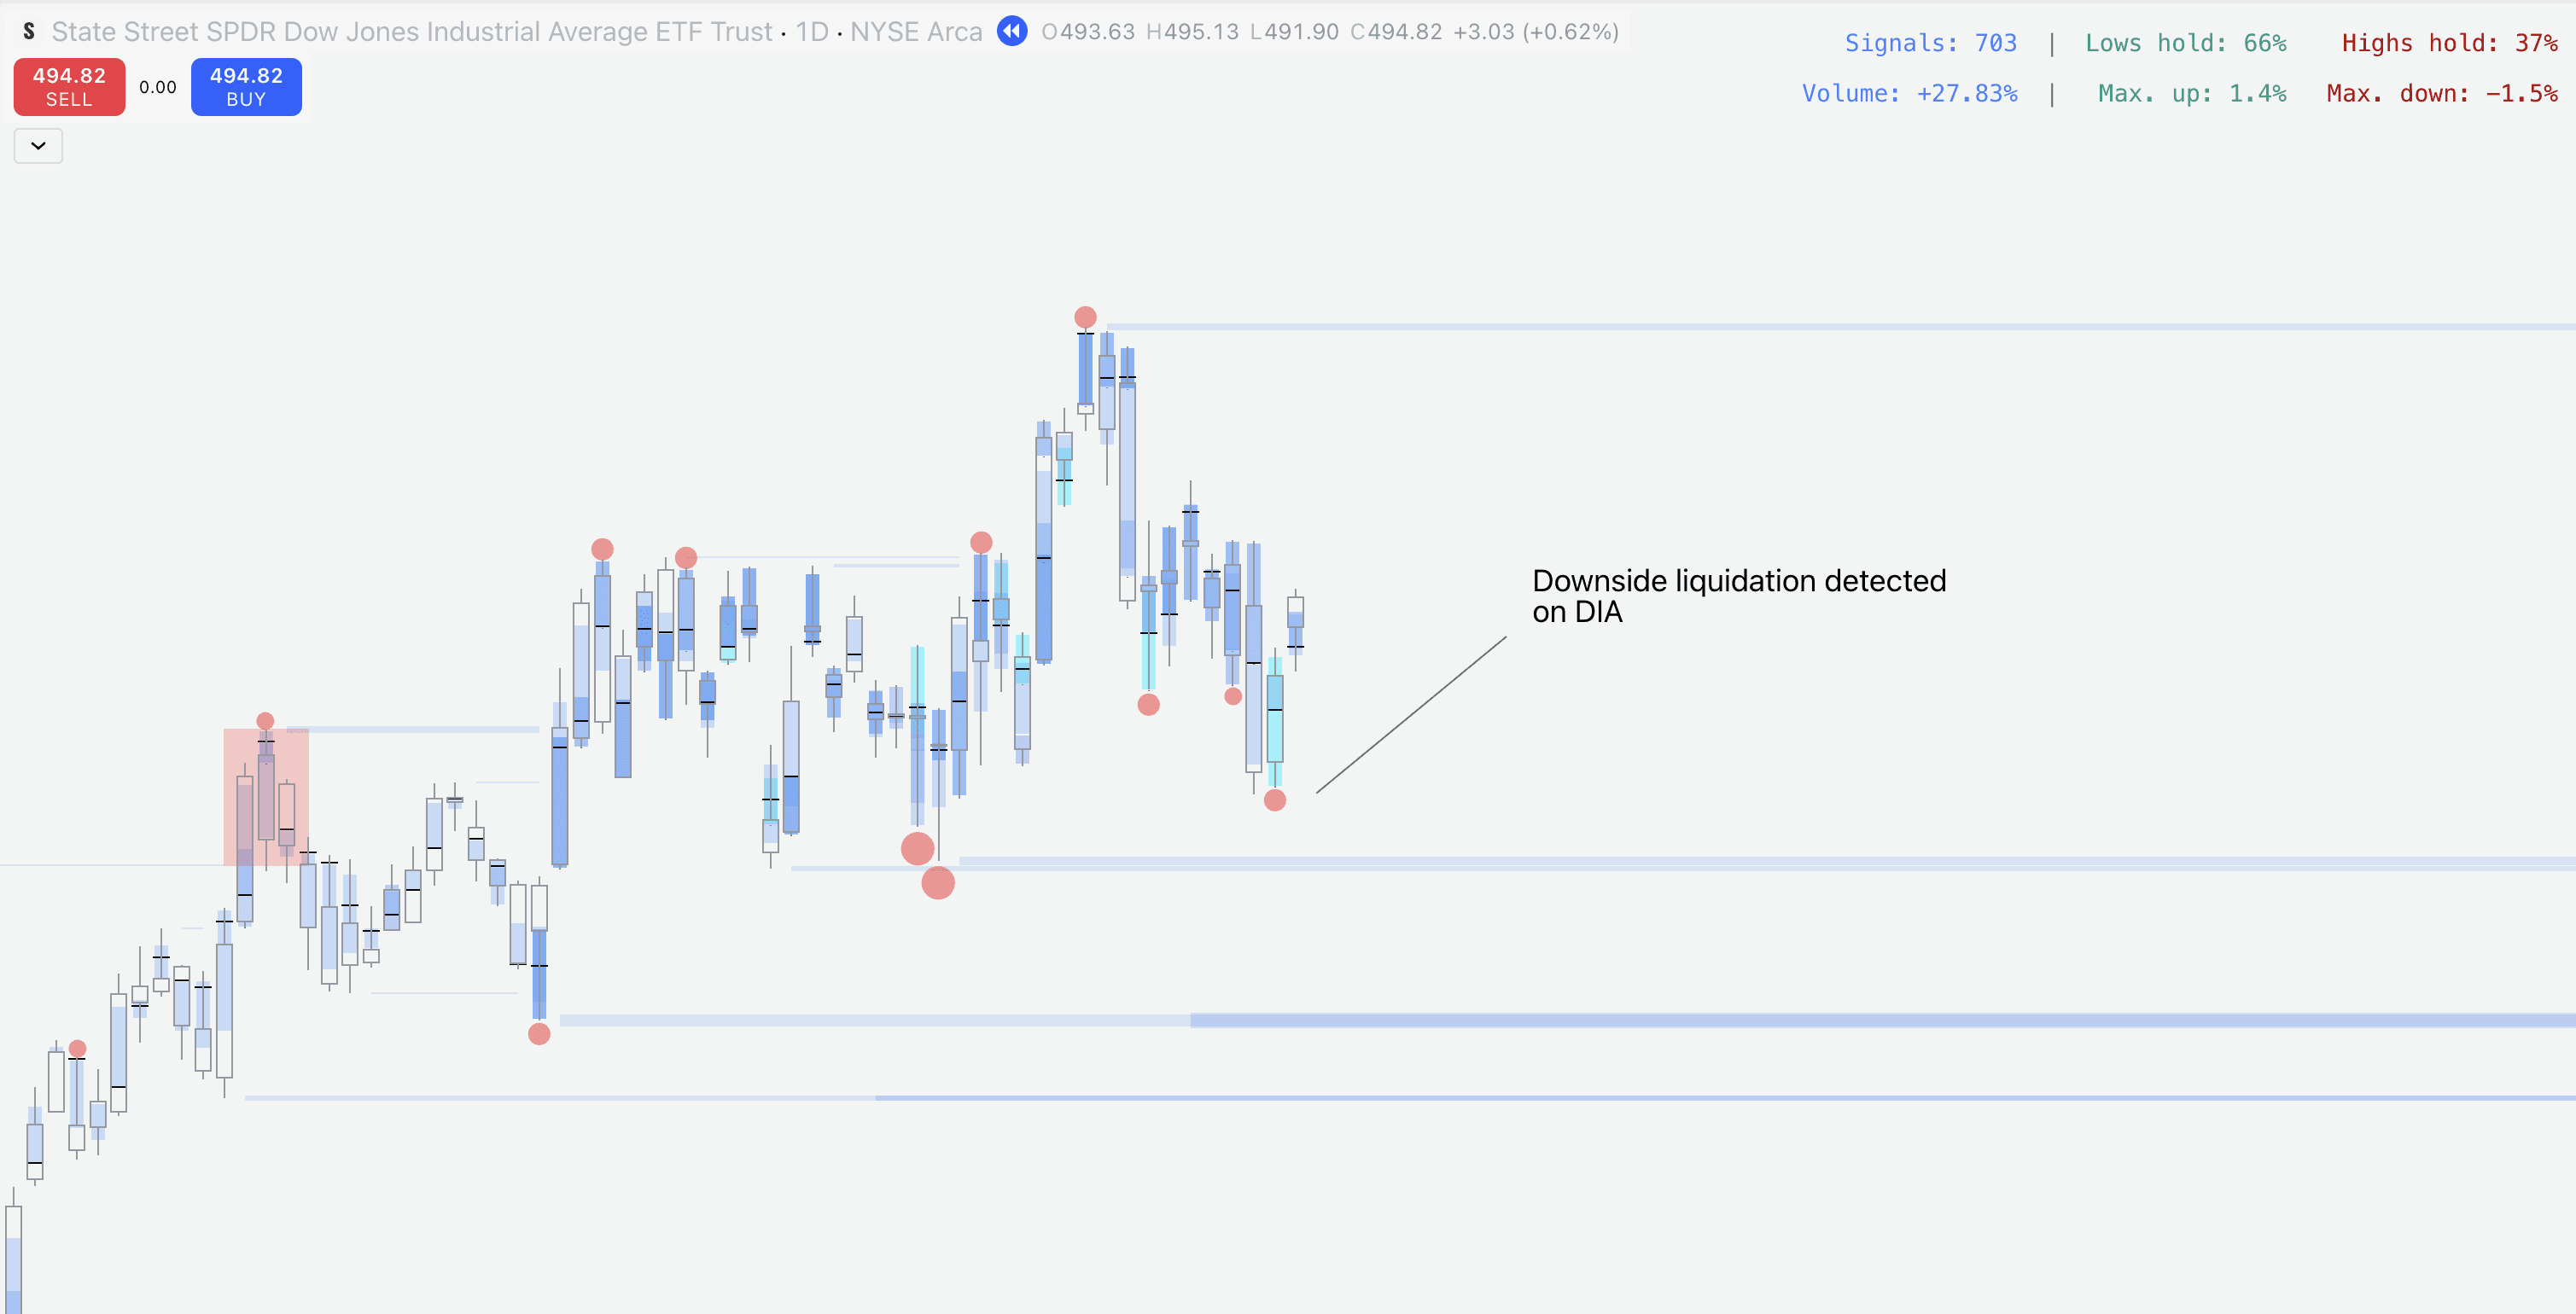
Example: Highs hold score of 66% indicates two out of three candles after a signal stay below signal high price, indicating price at least stops trending up most of the time.
Max. run test
Max. run test measures maximum price increase (bullish impact test) and decrease (bearish impact test) after a confirmed signal, expressed in percentage change.
Max. run is calculated by measuring highest/lowest price within 3 candles after a signal, compared to signal closing price. This test gives an idea for typical reversal magnitude.
Example: Max. run up score of +1.2% indicates that a signal typically leads to 1.2% upside move.
Backtesting & Analytics
Once conditions are defined using Signal builder, SubFlow Terminal detects each occurrence of the signal and measures its performance using price and volume metrics, shown on the right side table.
Amount of signals
Amount of signals shows how many times the custom signal has occurred through the chart’s history.
Volume test
Volume test refers to how much volume traded at signal is above/below average volume. This concept is also known as relative volume, comparing current volume traded to a historical average (average of 20 historical candles).
Example: When volume gain is +30%, volume traded at signal is typically 30% higher than average. Volume test allows us to validate and measure liquidity depth typically found when signal fires.
Highs/lows hold test
Highs/lows hold test measures likelihood of price staying above signal low price (bullish impact test) and staying below signal high price (bearish impact test). This test is measured for 3 candles after signal confirmation, giving us an idea of resistance in price.
Example: Highs hold score of 66% indicates two out of three candles after a signal stay below signal high price, indicating price at least stops trending up most of the time.
Max. run test
Max. run test measures maximum price increase (bullish impact test) and decrease (bearish impact test) after a confirmed signal, expressed in percentage change.
Max. run is calculated by measuring highest/lowest price within 3 candles after a signal, compared to signal closing price. This test gives an idea for typical reversal magnitude.
Example: Max. run up score of +1.2% indicates that a signal typically leads to 1.2% upside move.
Mentioned in this section
Dive deeper into topics mentioned
Mentioned in this section
Dive deeper into topics mentioned
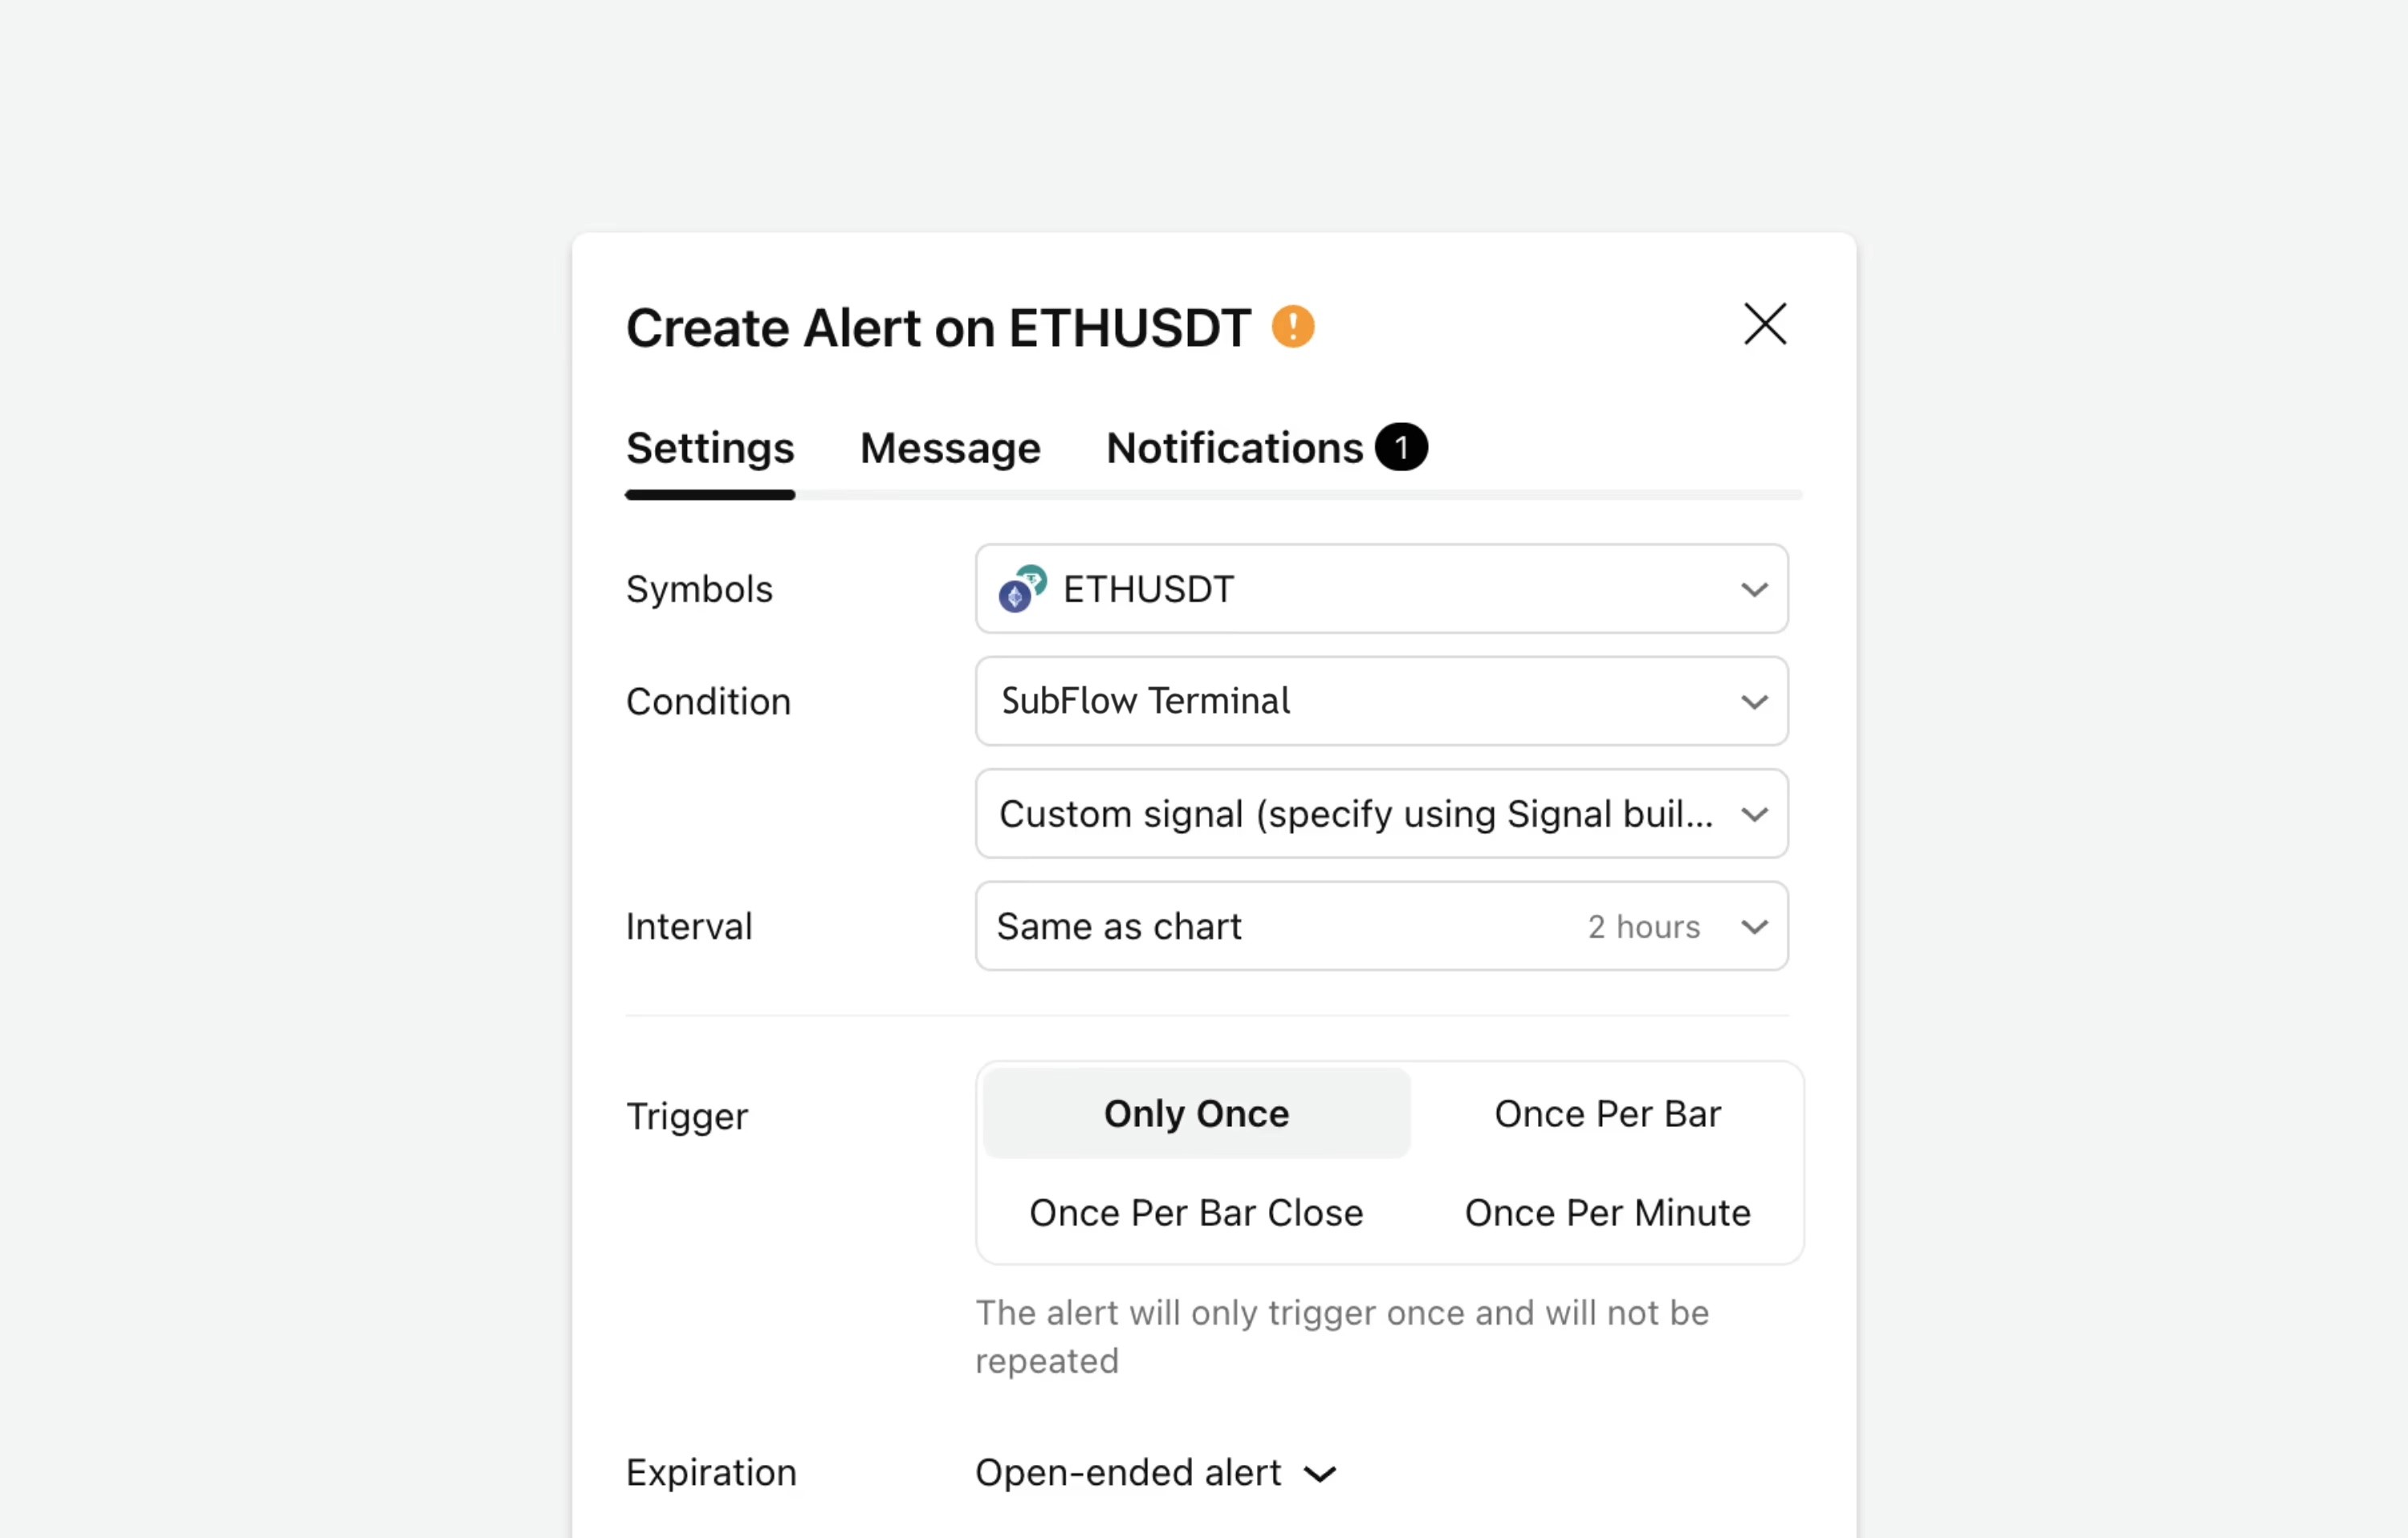
Creating alerts
Custom signals can also be used for alerts. Once we have defined the conditions for the signal we wish to get notified on, we can enable an alert for it using TradingView's alert menu.
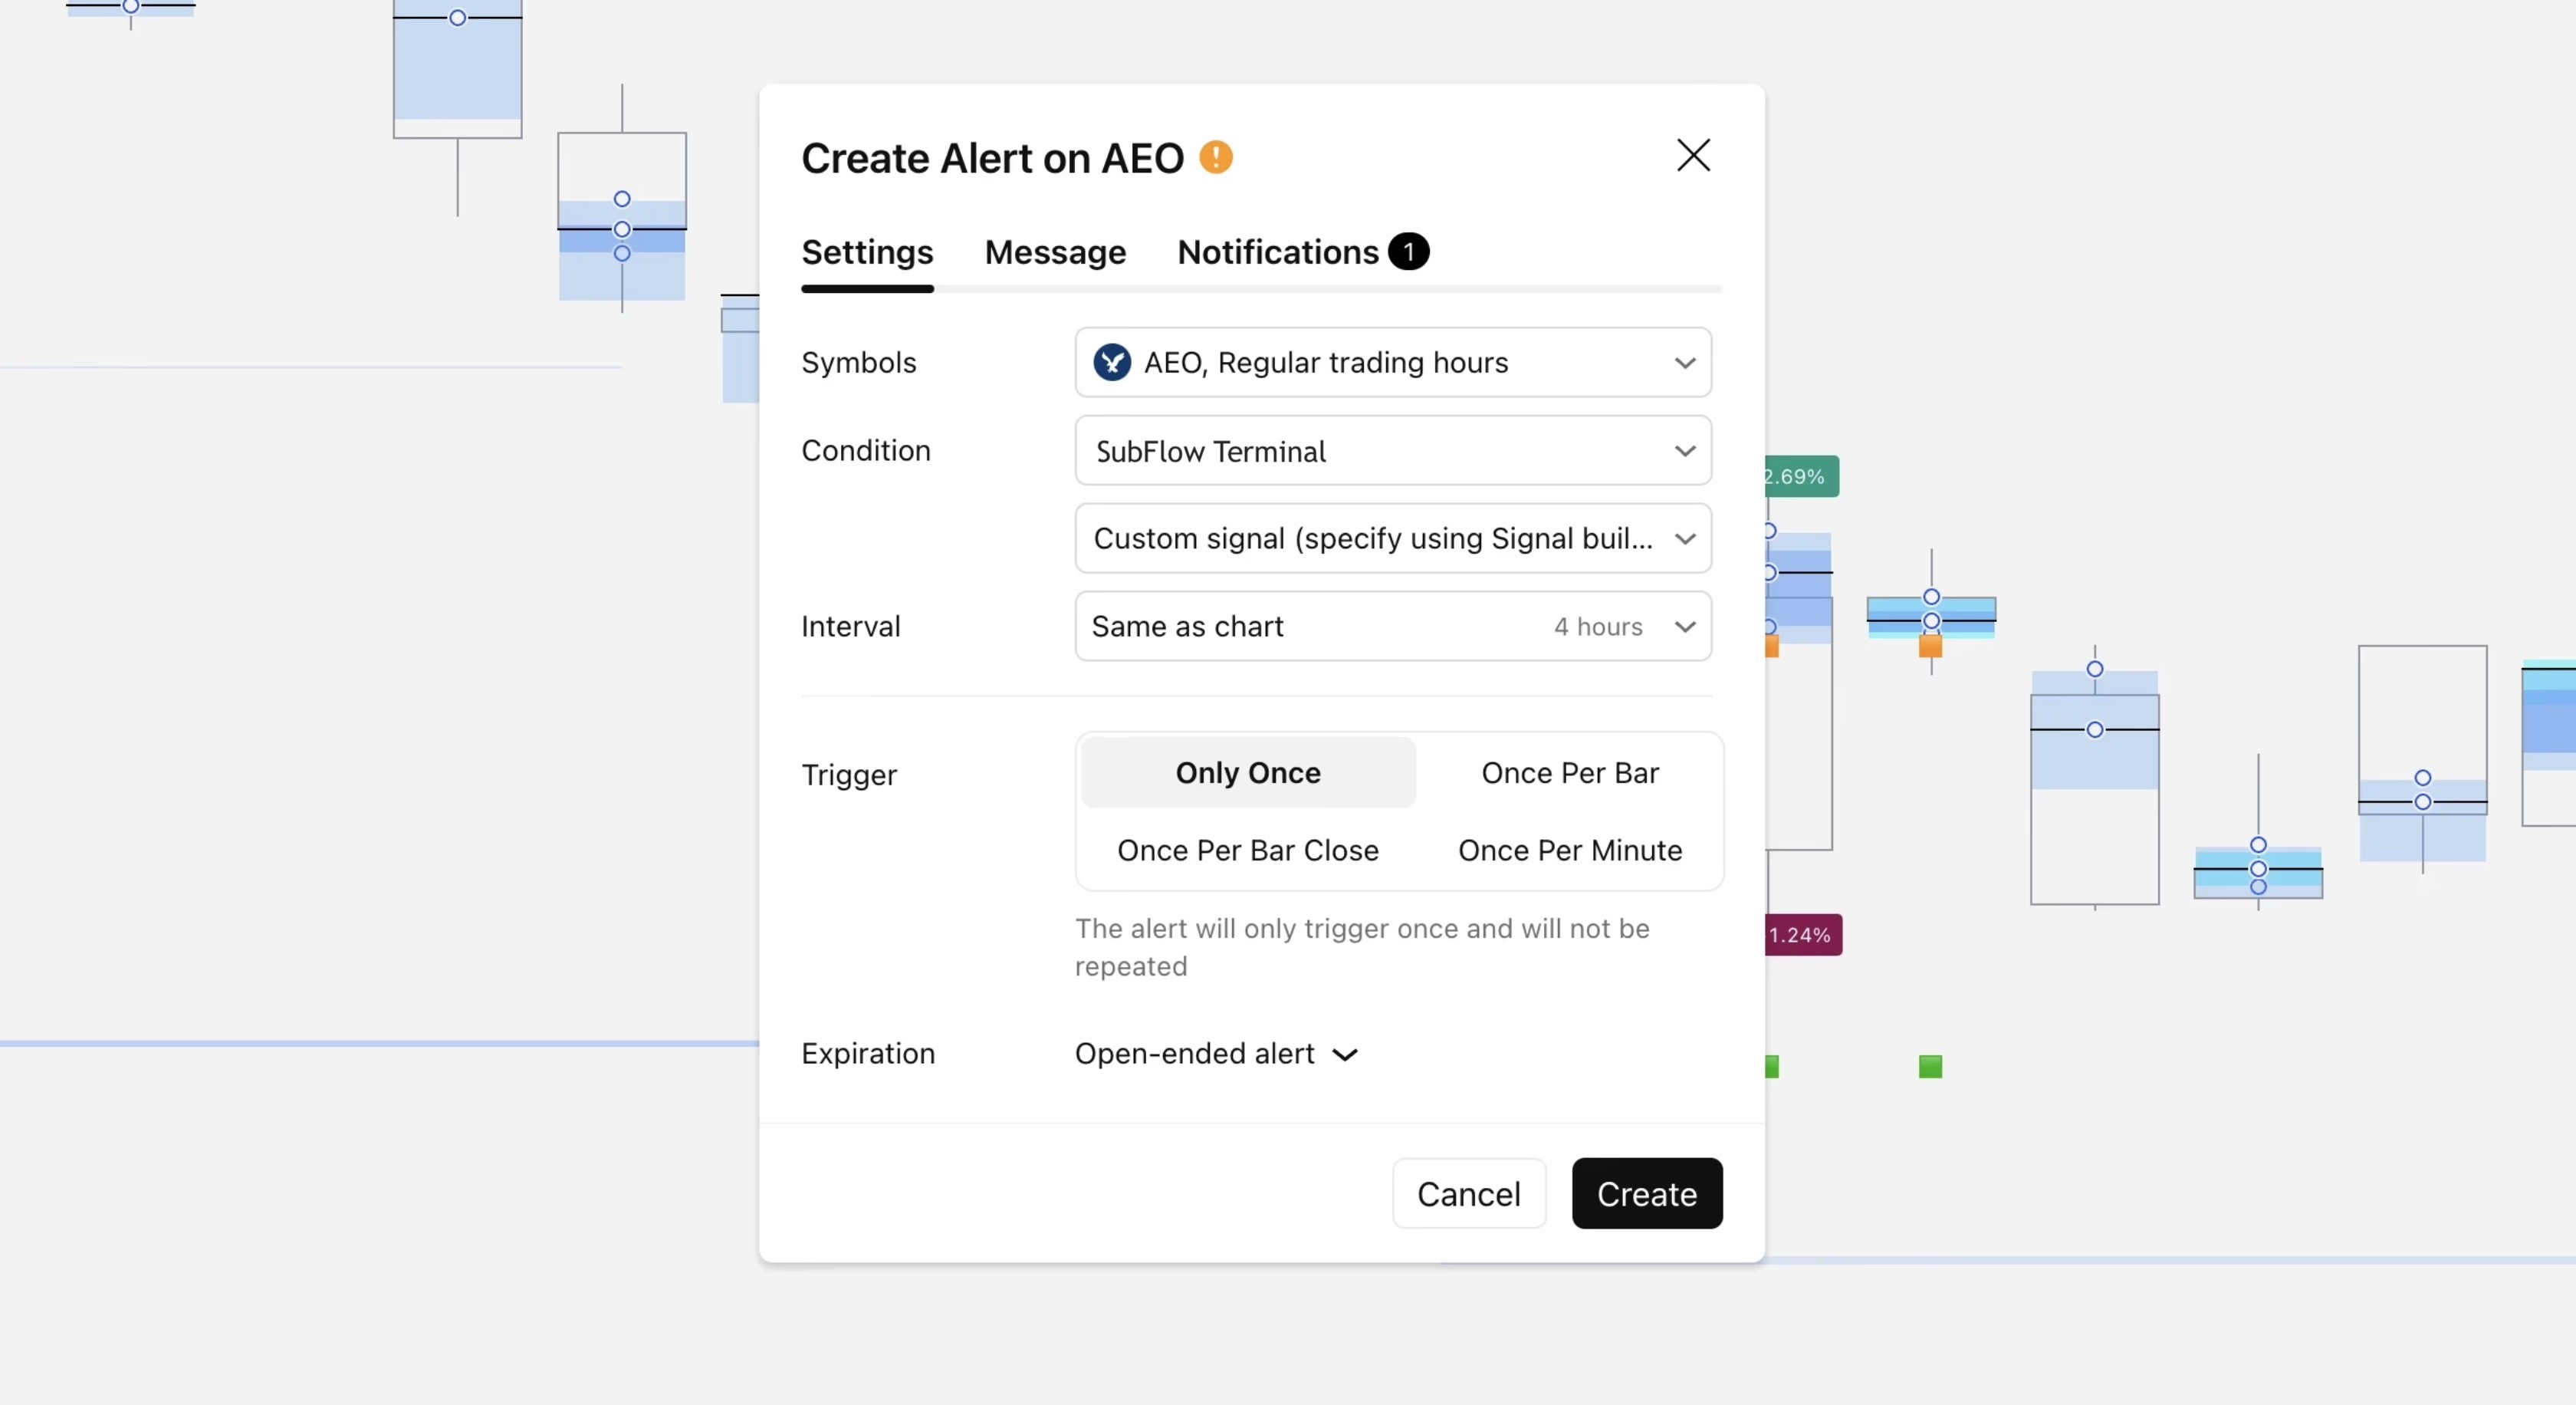
Once alert for chosen conditions is set, you can create a new alert by changing Signal builder settings from the same indicator menu.
Set alerts remain unchanged once they're active, even when SubFlow Terminal settings are changed or indicator is removed from the chart.
Creating scans
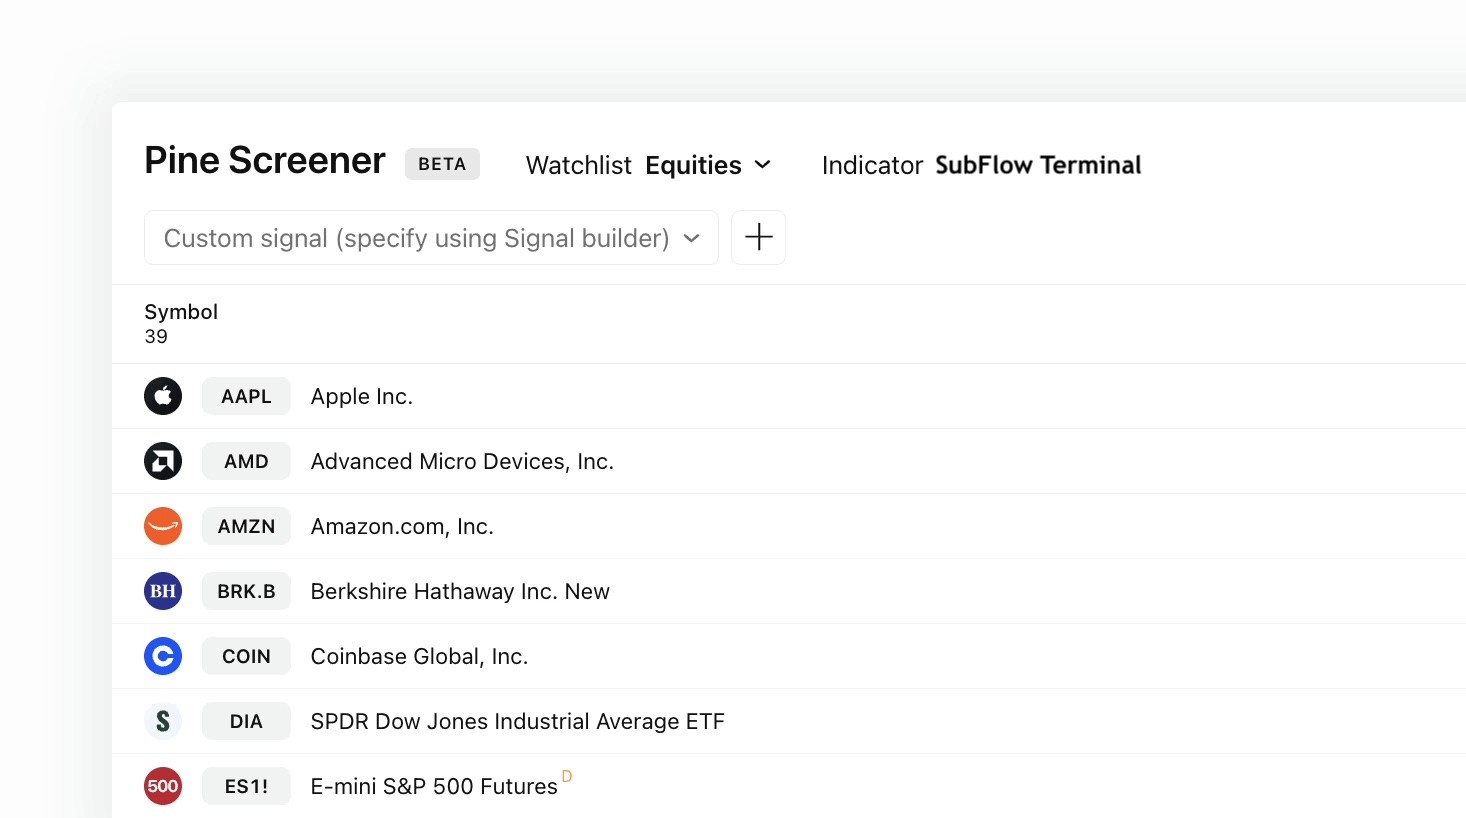
In the same way, custom signals can be used for market scans using PineScreener. PineScreener allows scanning custom watchlists for signals using any indicator, including SubFlow Terminal.
❗️ Note that PineScreener is available only for paid TradingView plans.
Head to PineScreener and select SubFlow Terminal under Indicators to prepare for a scan.
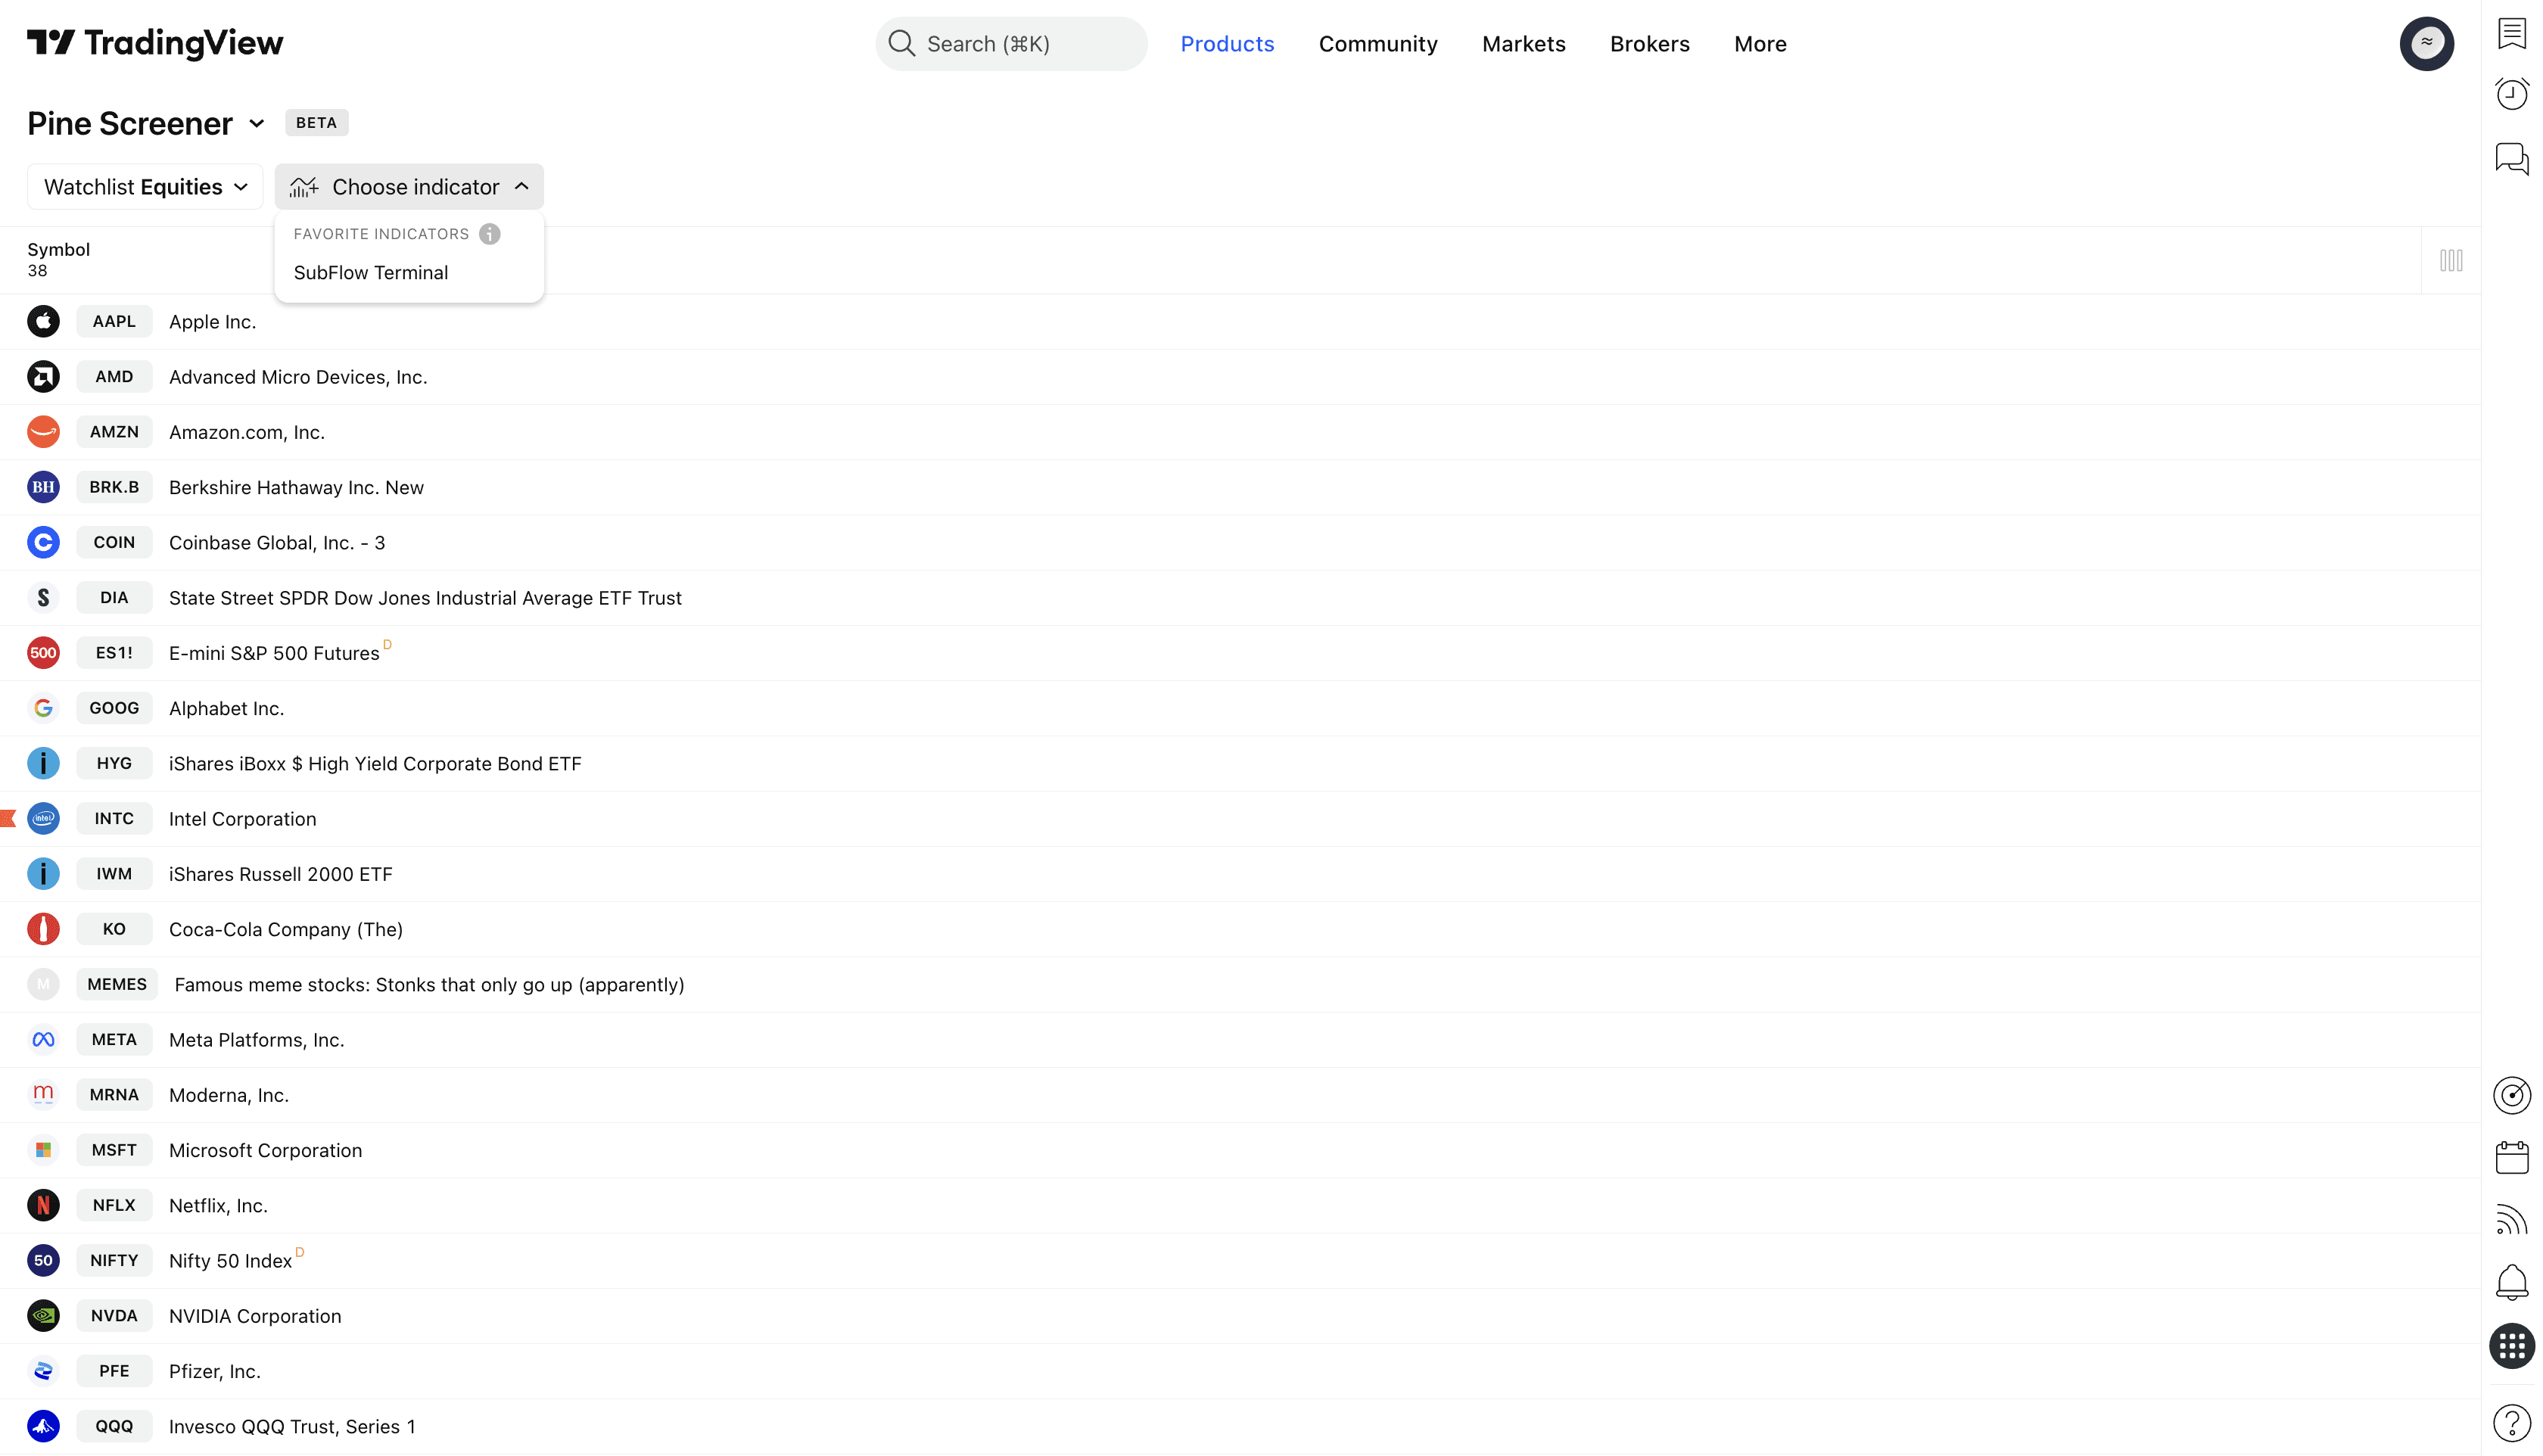
Scroll down in SubFlow Terminal's settings menu to find all available events. In this example, we're scanning for downside liquidations.
Once we have selected downside liquidation from the events, let's click "Apply" to save the changes.
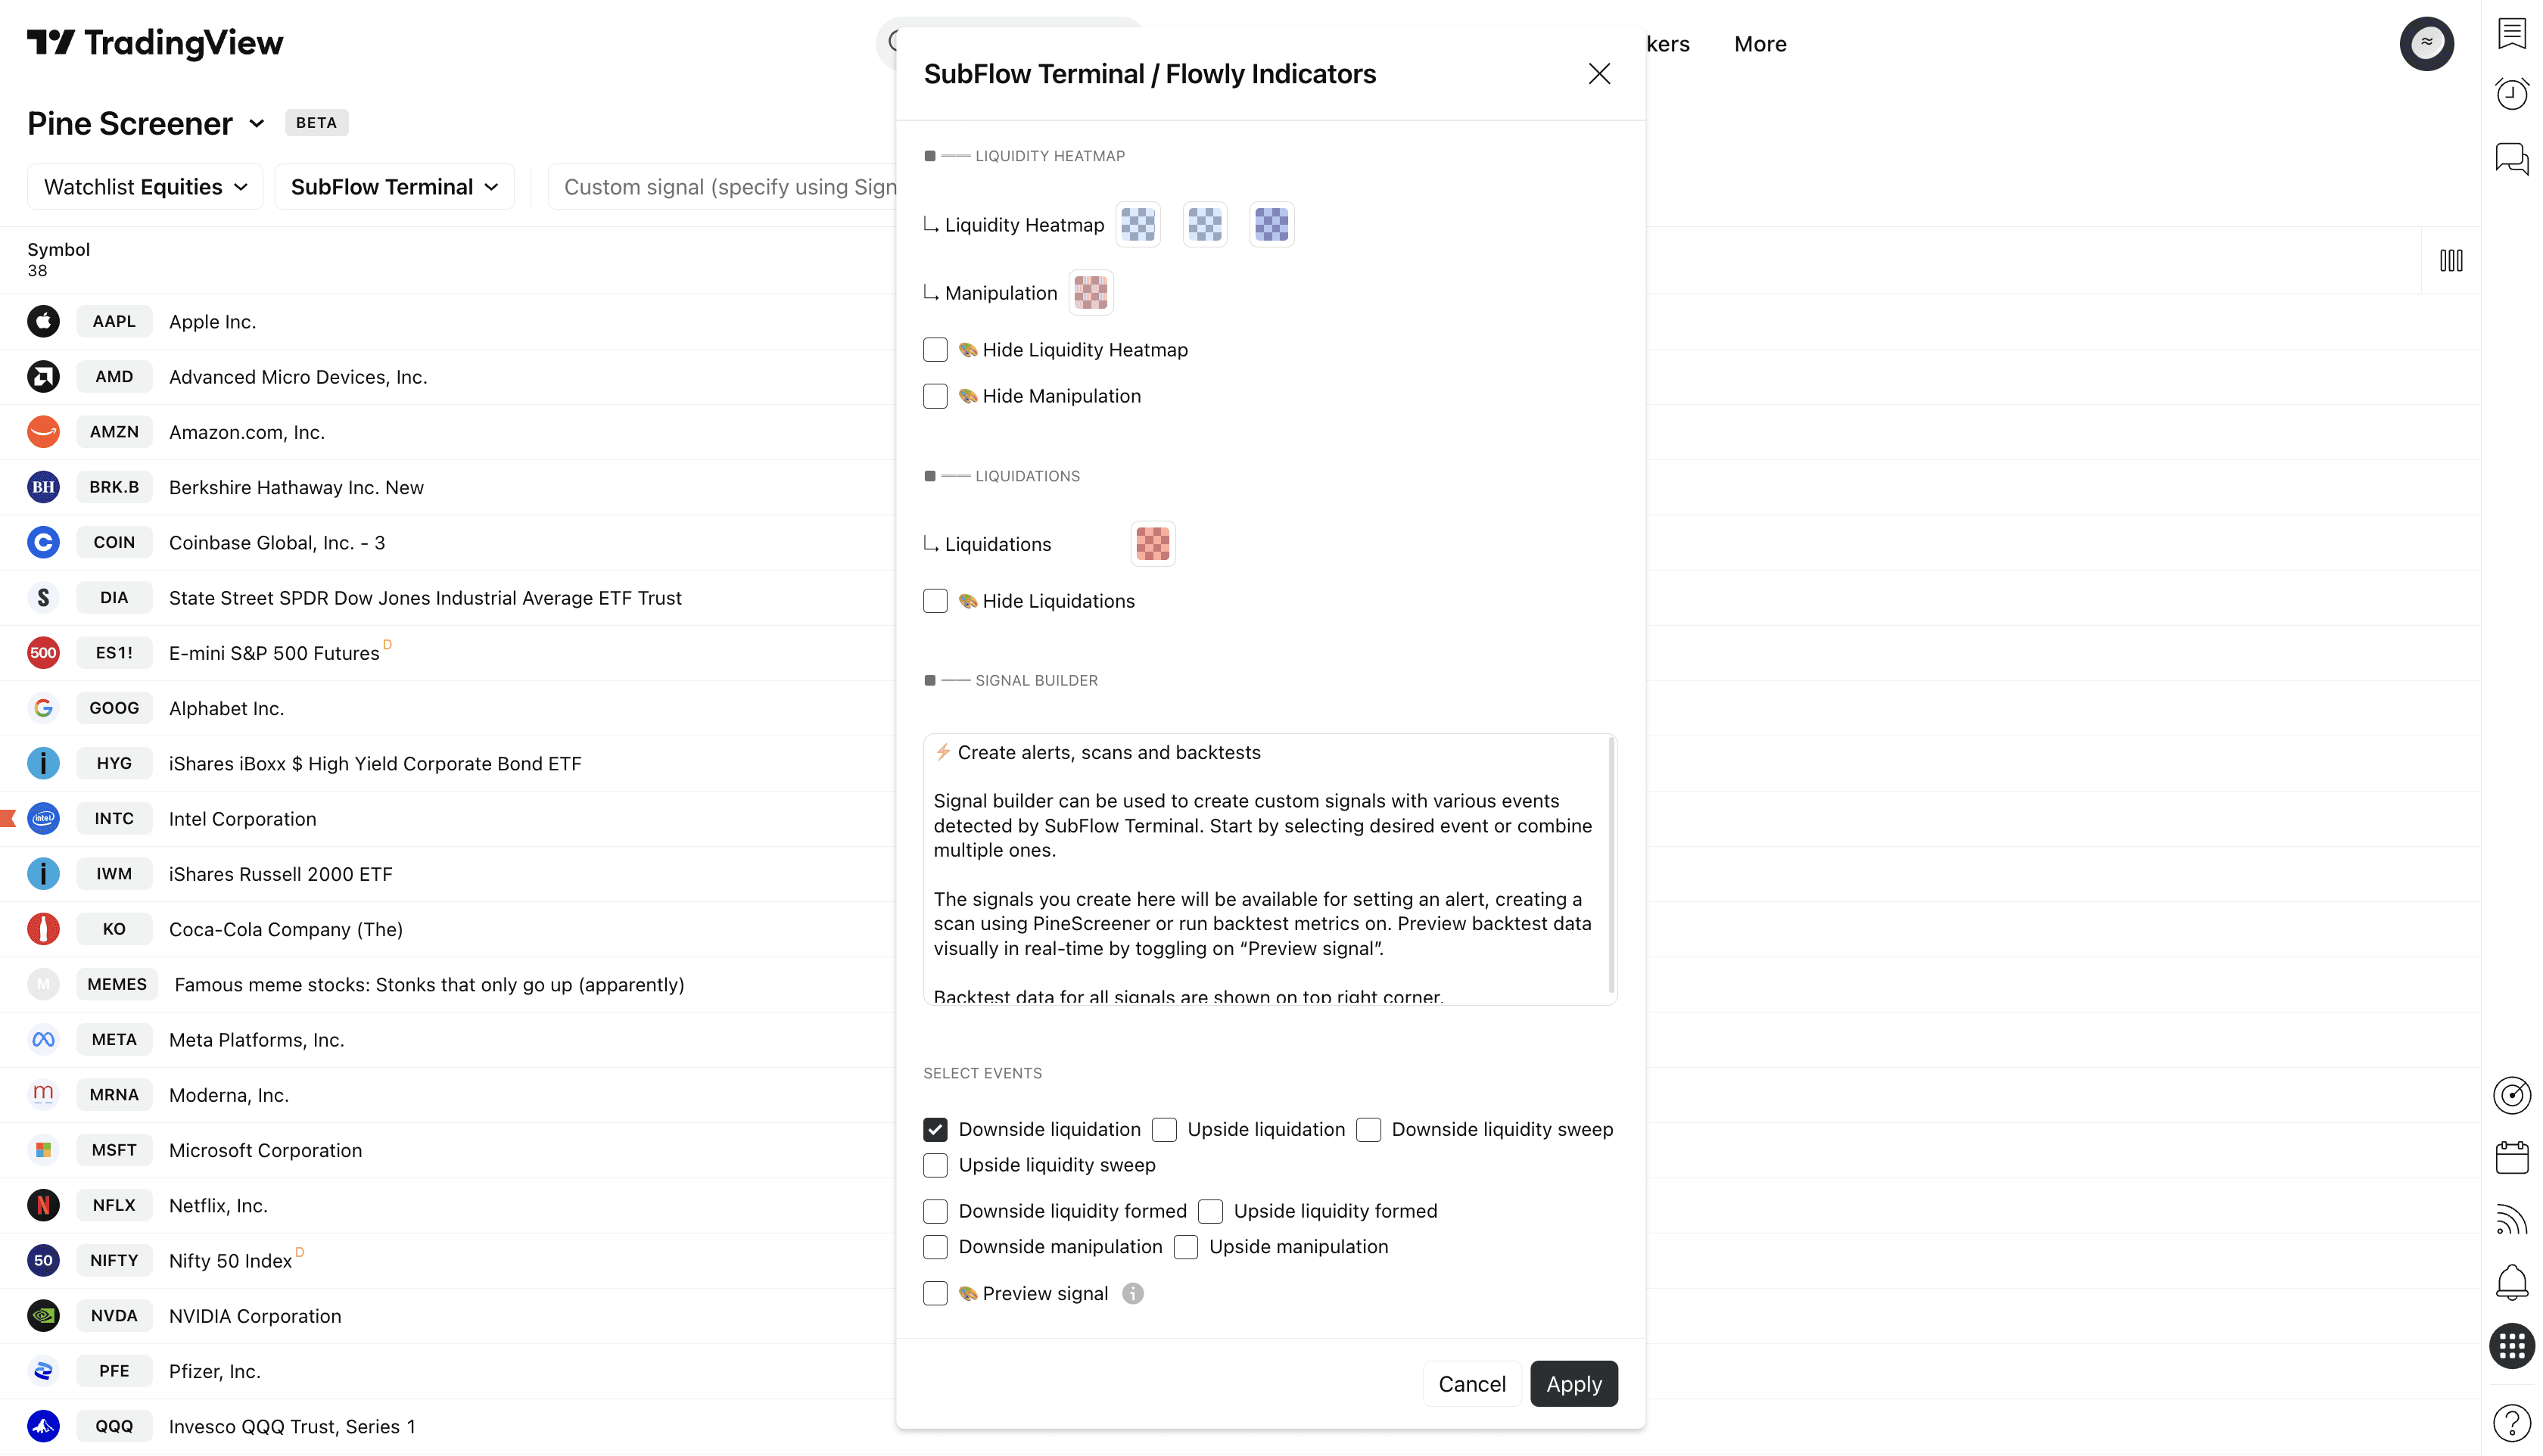
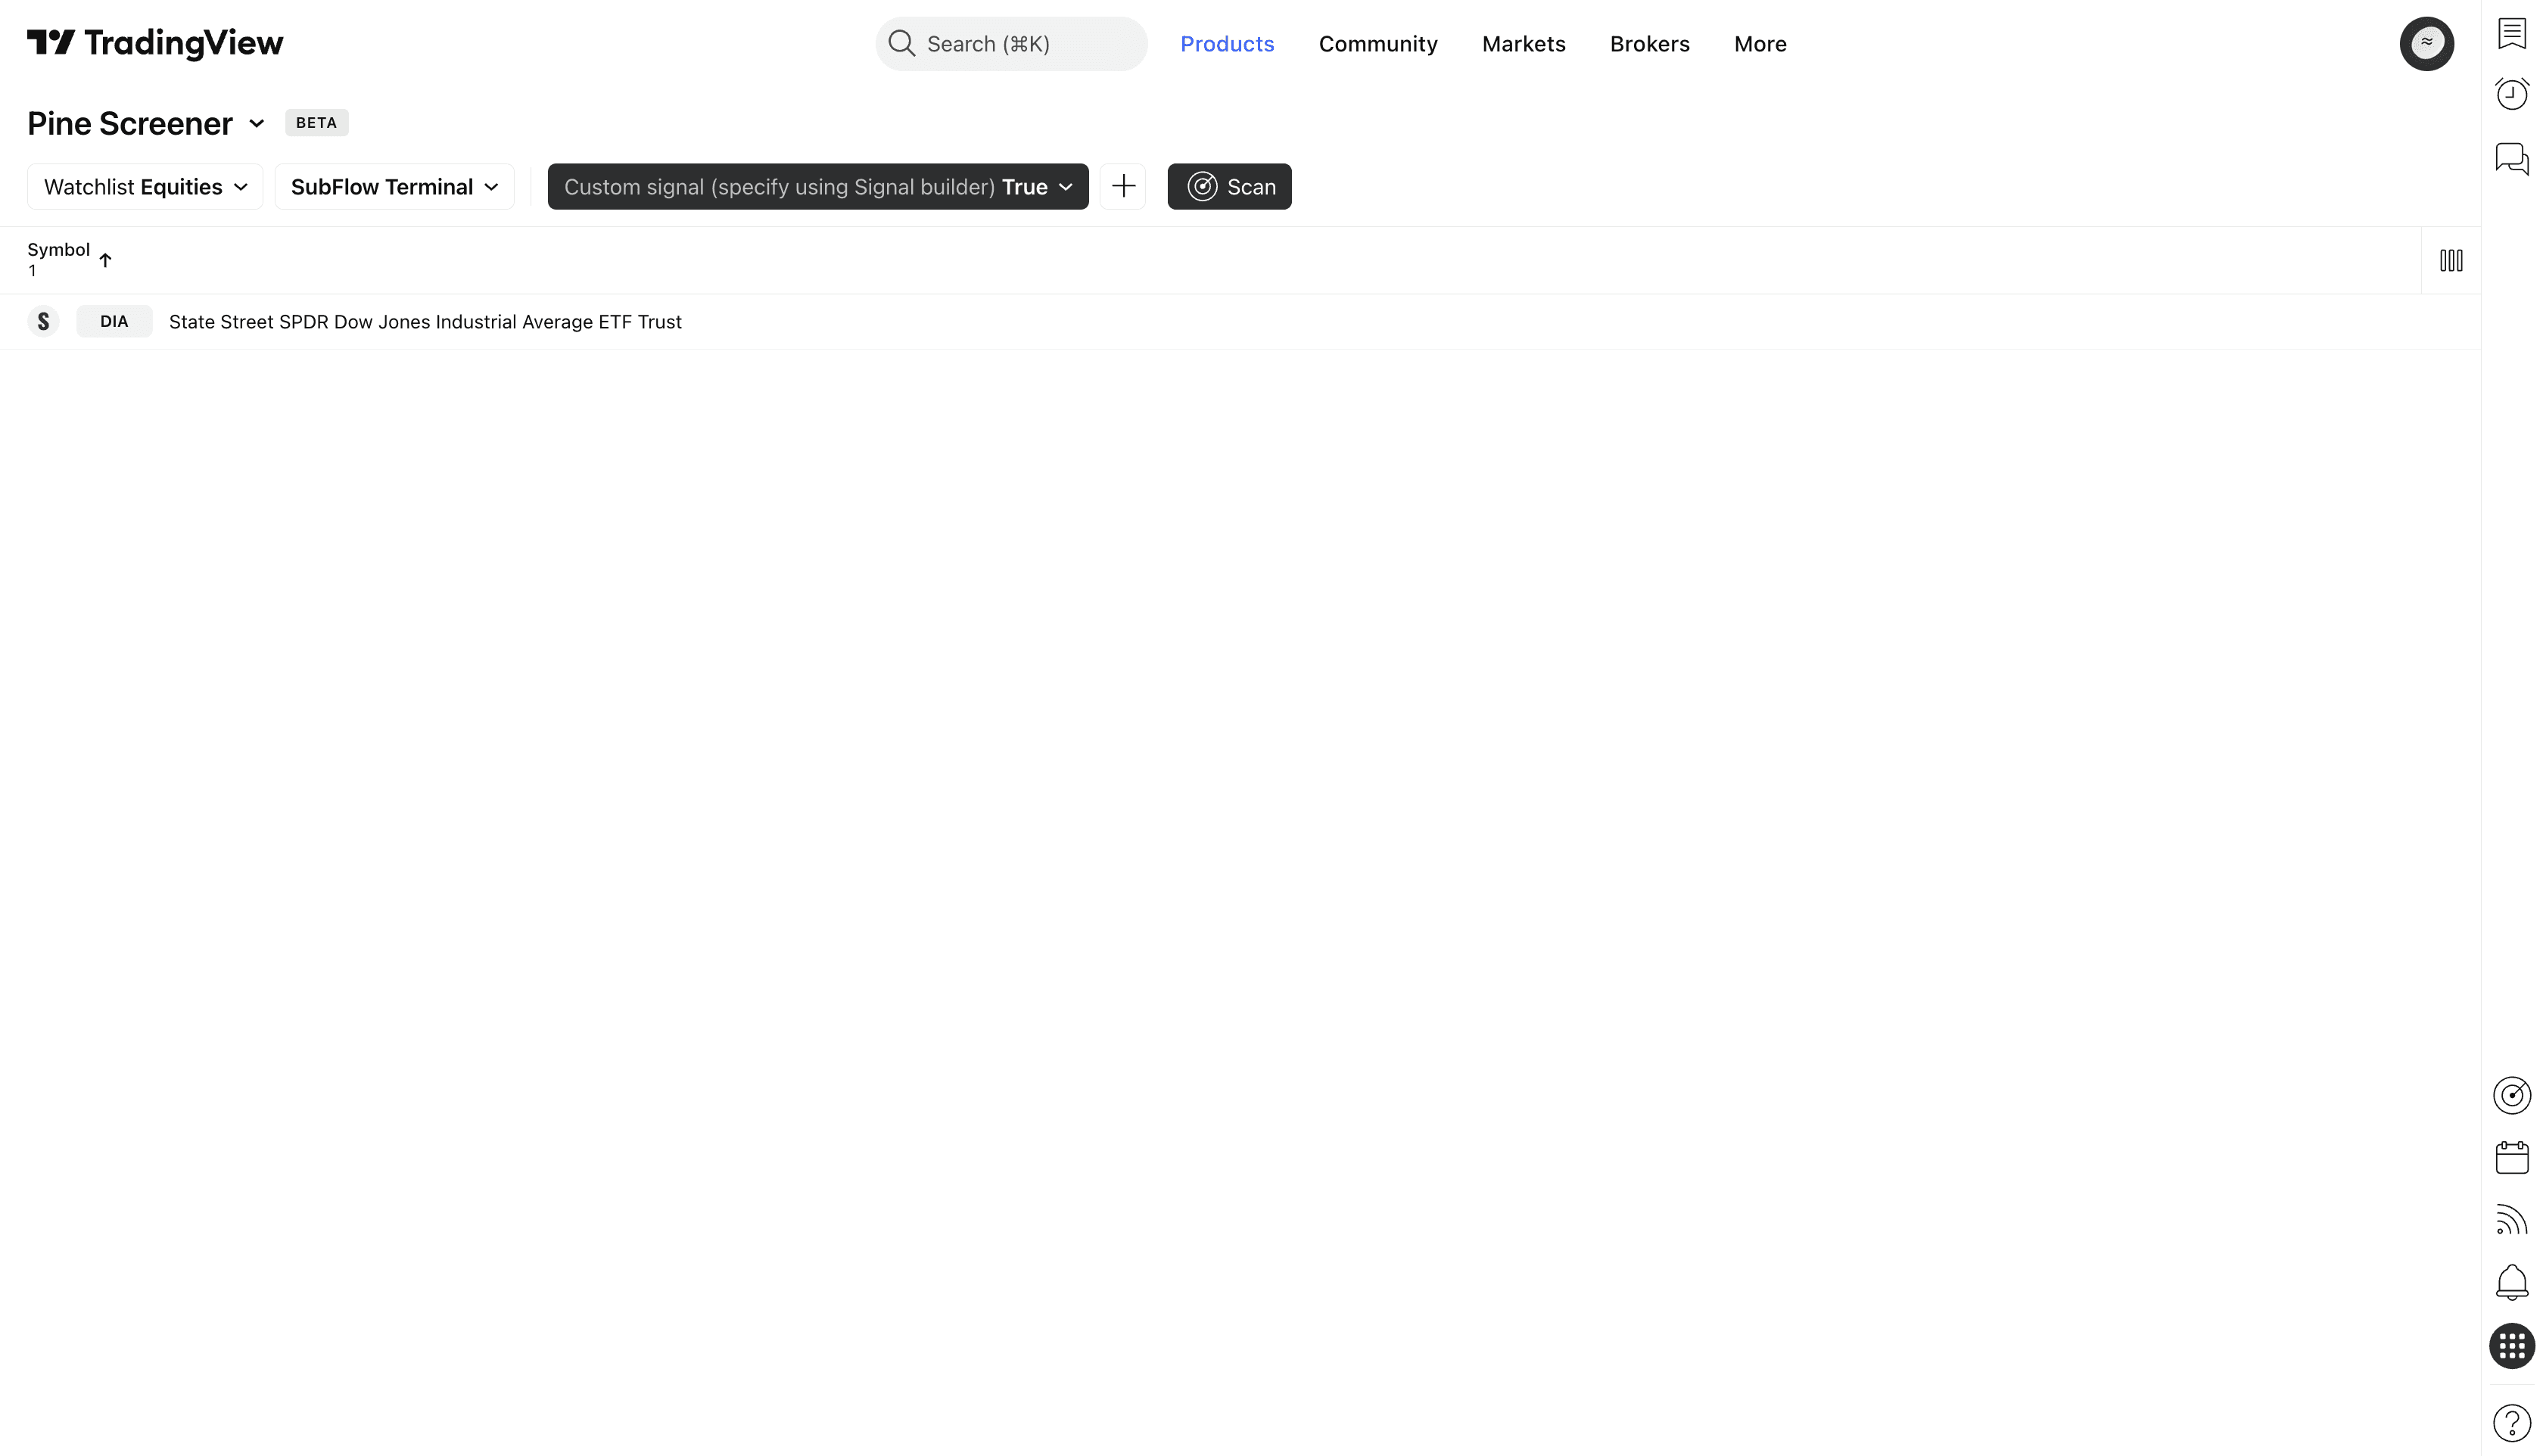
To scan the selected watchlist of charts, set “Custom signal” to “True”. Then just click “Scan”.
PineScreener will begin to look for charts where downside liquidation has recently occurred, shown as a list of symbols where signal was found.
We can see that PineScreener found a downside liquidation on DIA (Dow Jones Industrial Average).
We can then hop over to TradingView and open up DIA chart to confirm a downside liquidation is indeed there.
Creating alerts
Custom signals can also be used for alerts. Once we have defined the conditions for the signal we wish to get notified on, we can enable an alert for it using TradingView's alert menu.
Once alert for chosen conditions is set, you can create a new alert by changing Signal builder settings from the same indicator menu.
Set alerts remain unchanged once they're active, even when SubFlow Terminal settings are changed or indicator is removed from the chart.
Creating scans
In the same way, custom signals can be used for market scans using PineScreener. PineScreener allows scanning custom watchlists for signals using any indicator, including SubFlow Terminal.
❗️ Note that PineScreener is available only for paid TradingView plans.
Head to PineScreener and select SubFlow Terminal under Indicators to prepare for a scan.
Scroll down in SubFlow Terminal's settings menu to find all available events. In this example, we're scanning for downside liquidations.
Once we have selected downside liquidation from the events, let's click "Apply" to save the changes.
To scan the selected watchlist of charts, set “Custom signal” to “True”. Then just click “Scan”.
PineScreener will begin to look for charts where downside liquidation has recently occurred, shown as a list of symbols where signal was found.
We can see that PineScreener found a downside liquidation on DIA (Dow Jones Industrial Average).
We can then hop over to TradingView and open up DIA chart to confirm a downside liquidation is indeed there.
Mentioned in this section
Dive deeper into topics mentioned
Mentioned in this section
Dive deeper into topics mentioned
Limitations and considerations
SubFlow Terminal is based on algorithmic orderflow, which significantly differs from orderbook based orderflow. That being said, SubFlow Terminal has some unique advantages and disadvantages that users should be aware of.
Advantages | Disadvantages |
|---|---|
✅ Reduced noise, clearer read on orderflow | ❌ Some orderflow events have a slight delay (see below) |
✅ Can be validated using backtest metrics | ❌ Not based on volume tick data |
✅ Can be used for alerts and market scans |
Confirmation times
Due to the nature of algorithmic orderflow, some events are not detected in real-time.
The algorithm powering SubFlow Terminal is designed to be at a sweet spot for less noise/more accurate indications without sacrificing reasonable confirmation times.
Liquidity pool sweep: ⚡️ Real-time, no delays
Liquidity pool sweeps are detected real-time, drawn as they develop without delays.
Internal Flow: ⚡️ Real-time, no delays
High value trades shown by Internal Flow are real-time, drawn as they develop without delays.
Liquidations: ⏱️ On candle close
Liquidation conditions are checked on candle close, after which they are considered confirmed.
Manipulation: ⏱️ On candle close
Manipulation pattern confirms once price has closed back inside exceeded liquidity pool.
Liquidity pool confirmation: ⏱️ 2-3 candle delay
Liquidity pools are confirmed on average in 2-3 candles after a qualifying turn in price.
TradingView related limitations
While SubFlow Terminal can be used on free plans, due to TradingView related restrictions some functionality are available only for users with a paid plan.
Internal Flow and Value Area & POC on 1 minute charts
Internal Flow and Value Area & POC can be used on 1 minute timeframe only if you have a Premium plan or above (as of writing this guide).
This is due to TradingView restricting seconds based timeframes only for these plans, which SubFlow Terminal uses on 1 minute charts.
Market scans
Market scans using PineScreener are only available if you have a Premium plan or above (as of writing this guide).
All other functionality of SubFlow Terminal works the same way for free plans.
Mentioned in this section
Dive deeper into topics mentioned
Mentioned in this section
Dive deeper into topics mentioned

How to use SubFlow Terminal
SubFlow Terminal is a simple, yet a powerful tool allowing one to see inside charts and identify when the flows are favorable.
Let's cover a few practical ways on how to take advantage of SubFlow Terminal.
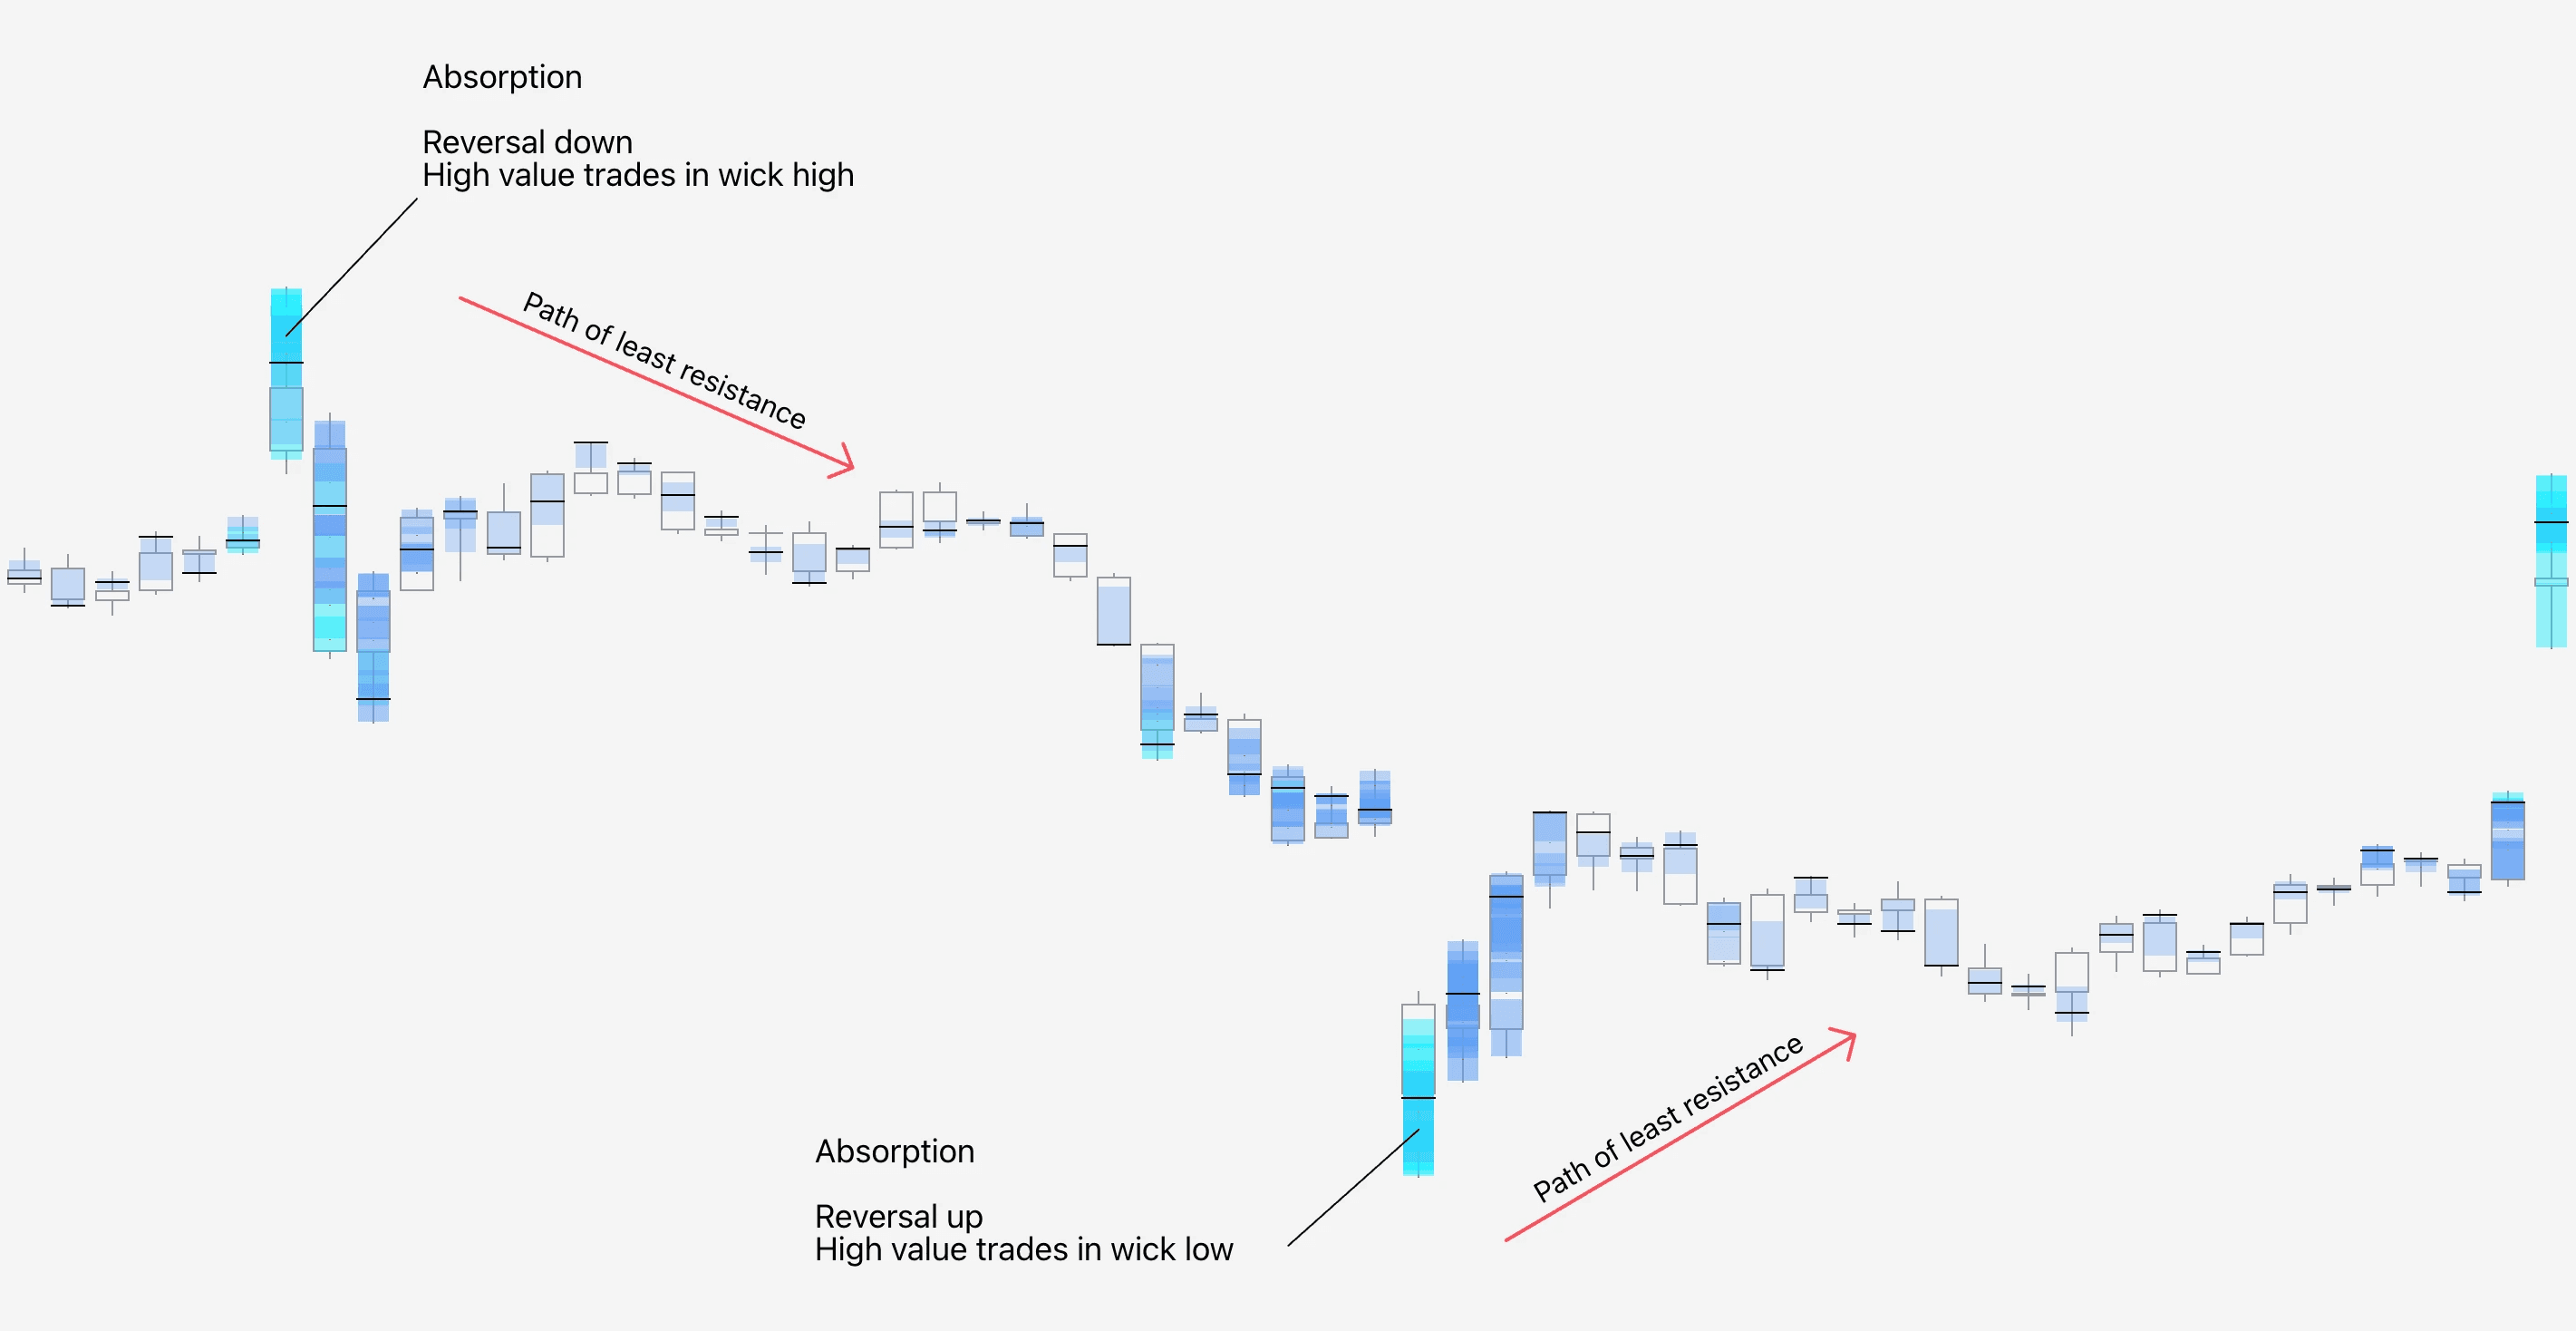
Identify absorption/trapped traders
Absorption refers to an event where price forms a reversal shaped candle pattern, while high amount of volume is traded at the wick.
The idea behind absorption is that price found liquidity to which traders bought/sold into with high effort, but reaped little reward. Absorption can be interpreted as a sign of deep and impactful liquidity, potentially causing a halt/reversal in price.
Absorption can be seen using Internal Flow by looking for high value trades in wicks. Ideal point of confluence for absorption is a preceding parabola-type trend, increasing likelihood of exhaustion.
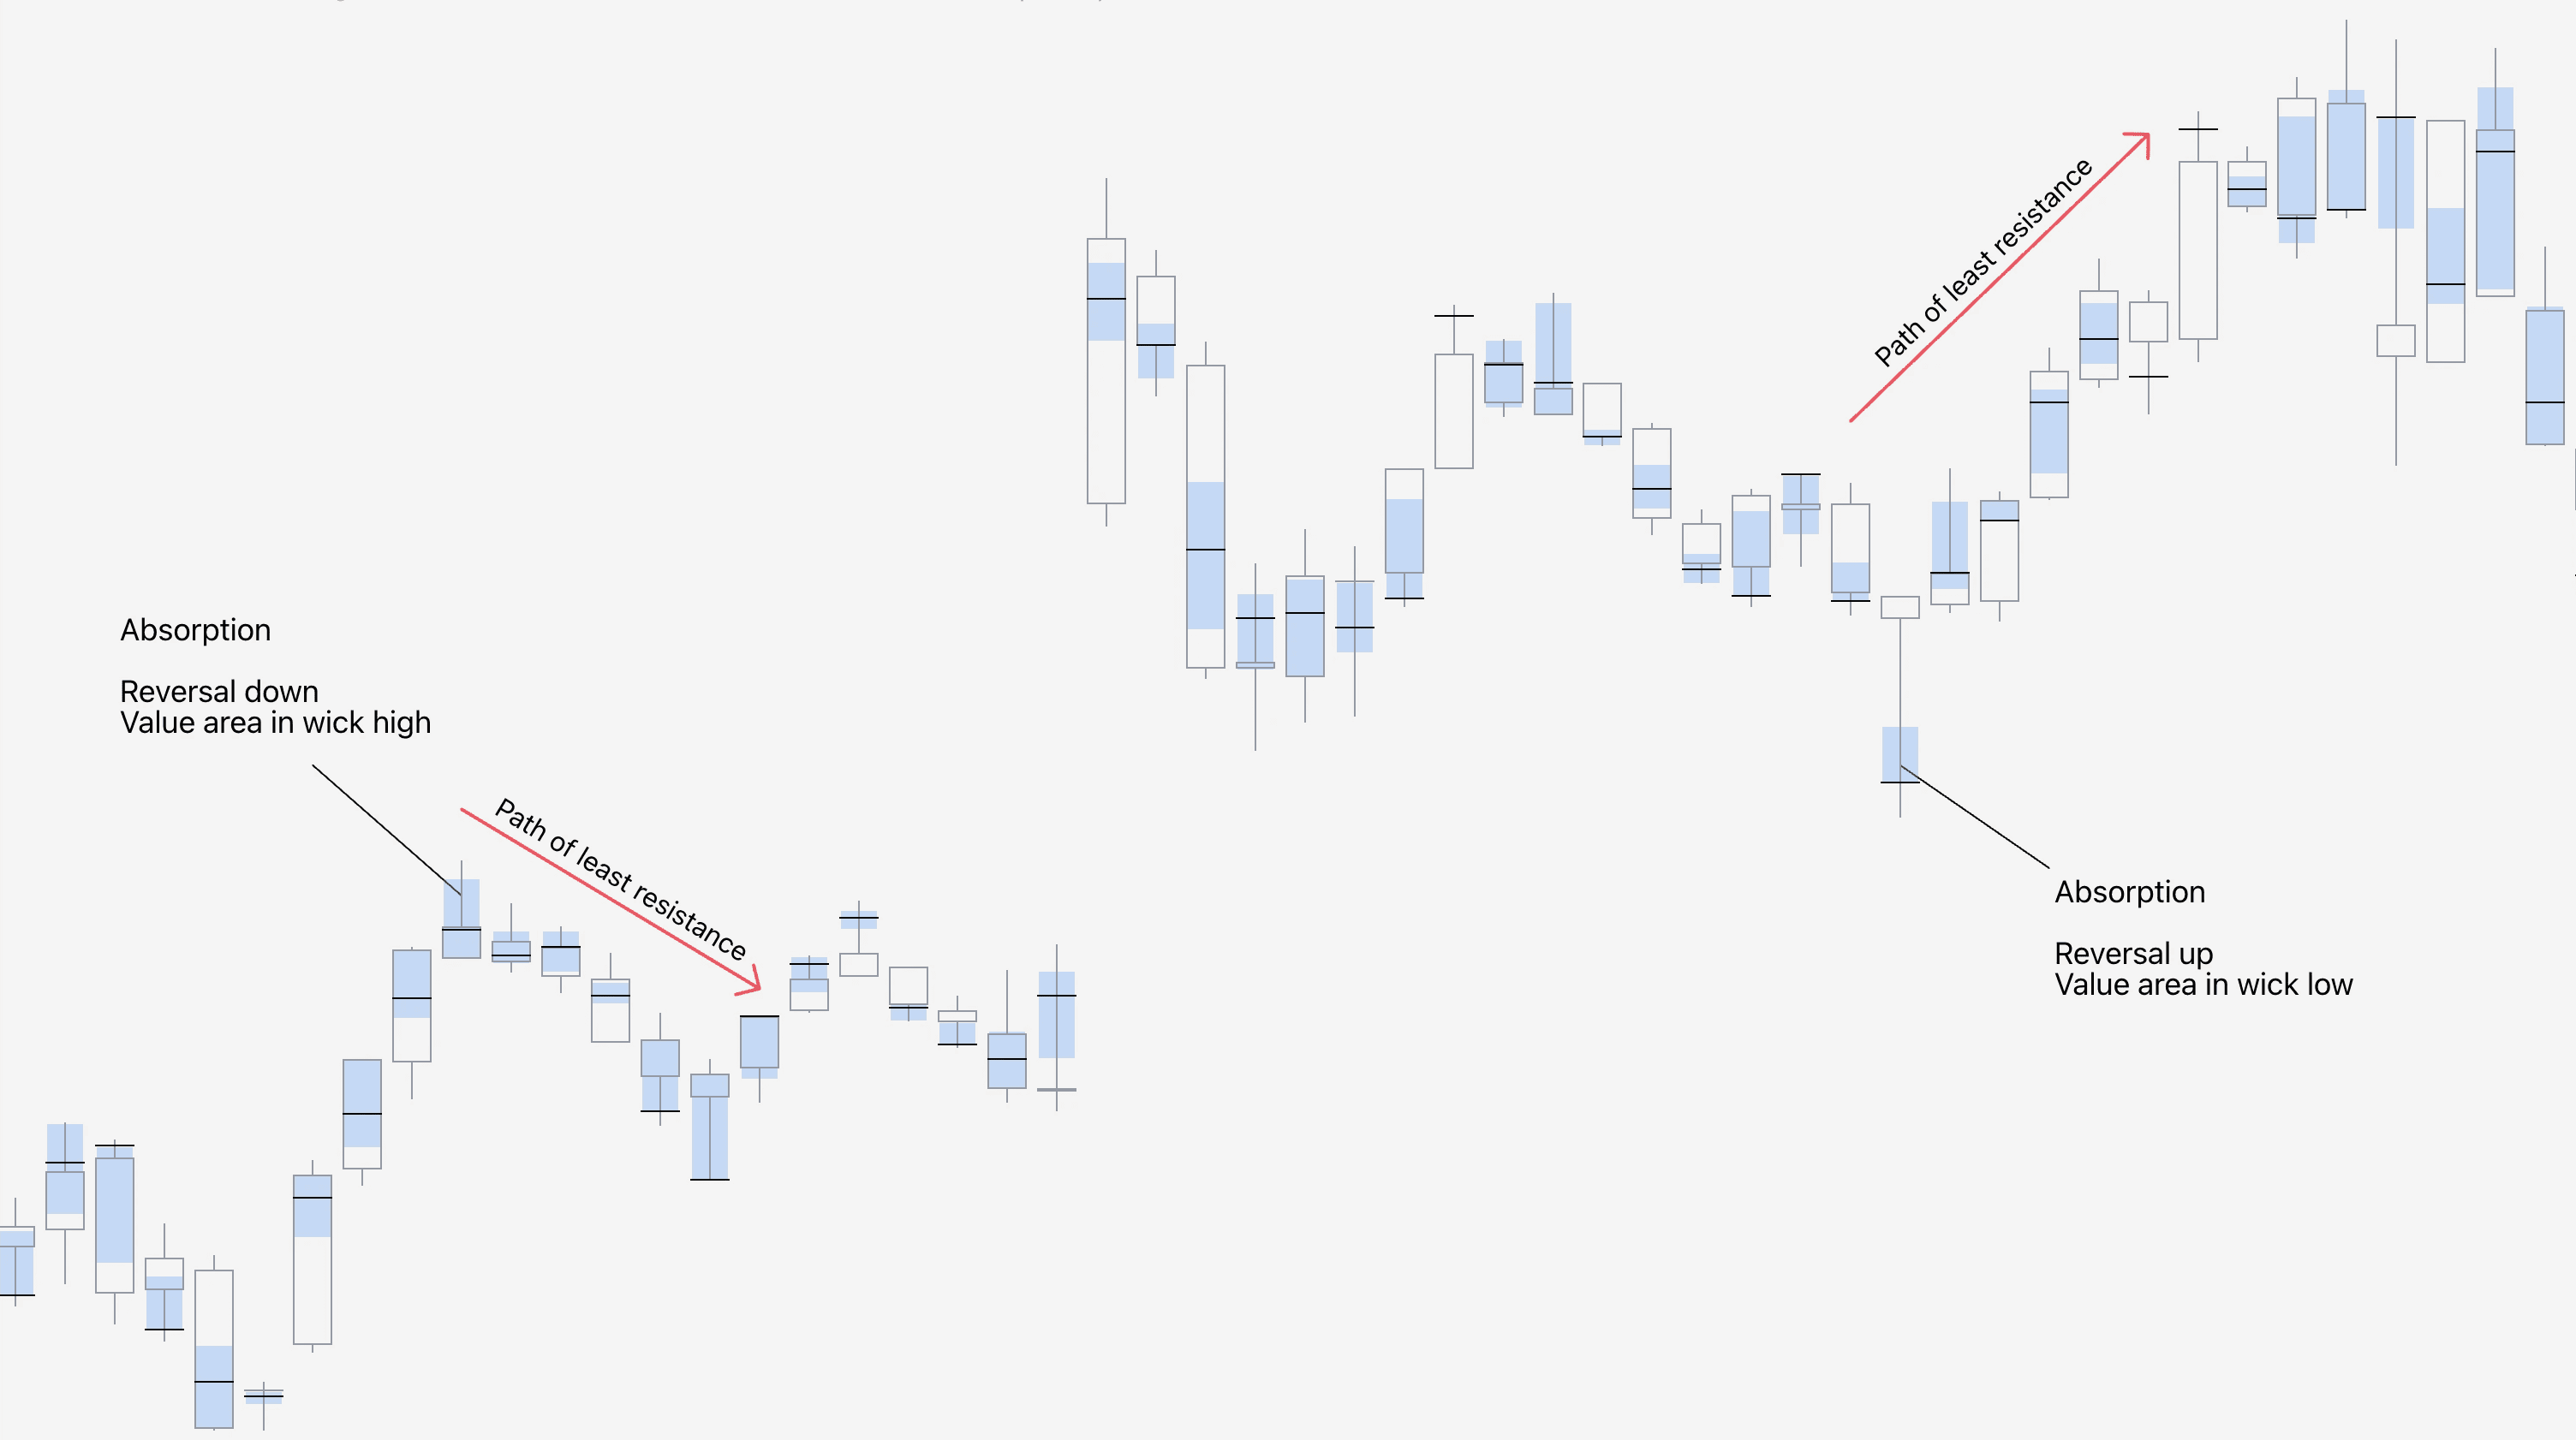
Although the high value trades at wick imply greater absorption (therefore more likely exhaustion/price impact), absorption can also be spotted using just Value Area and POC at wick as well.
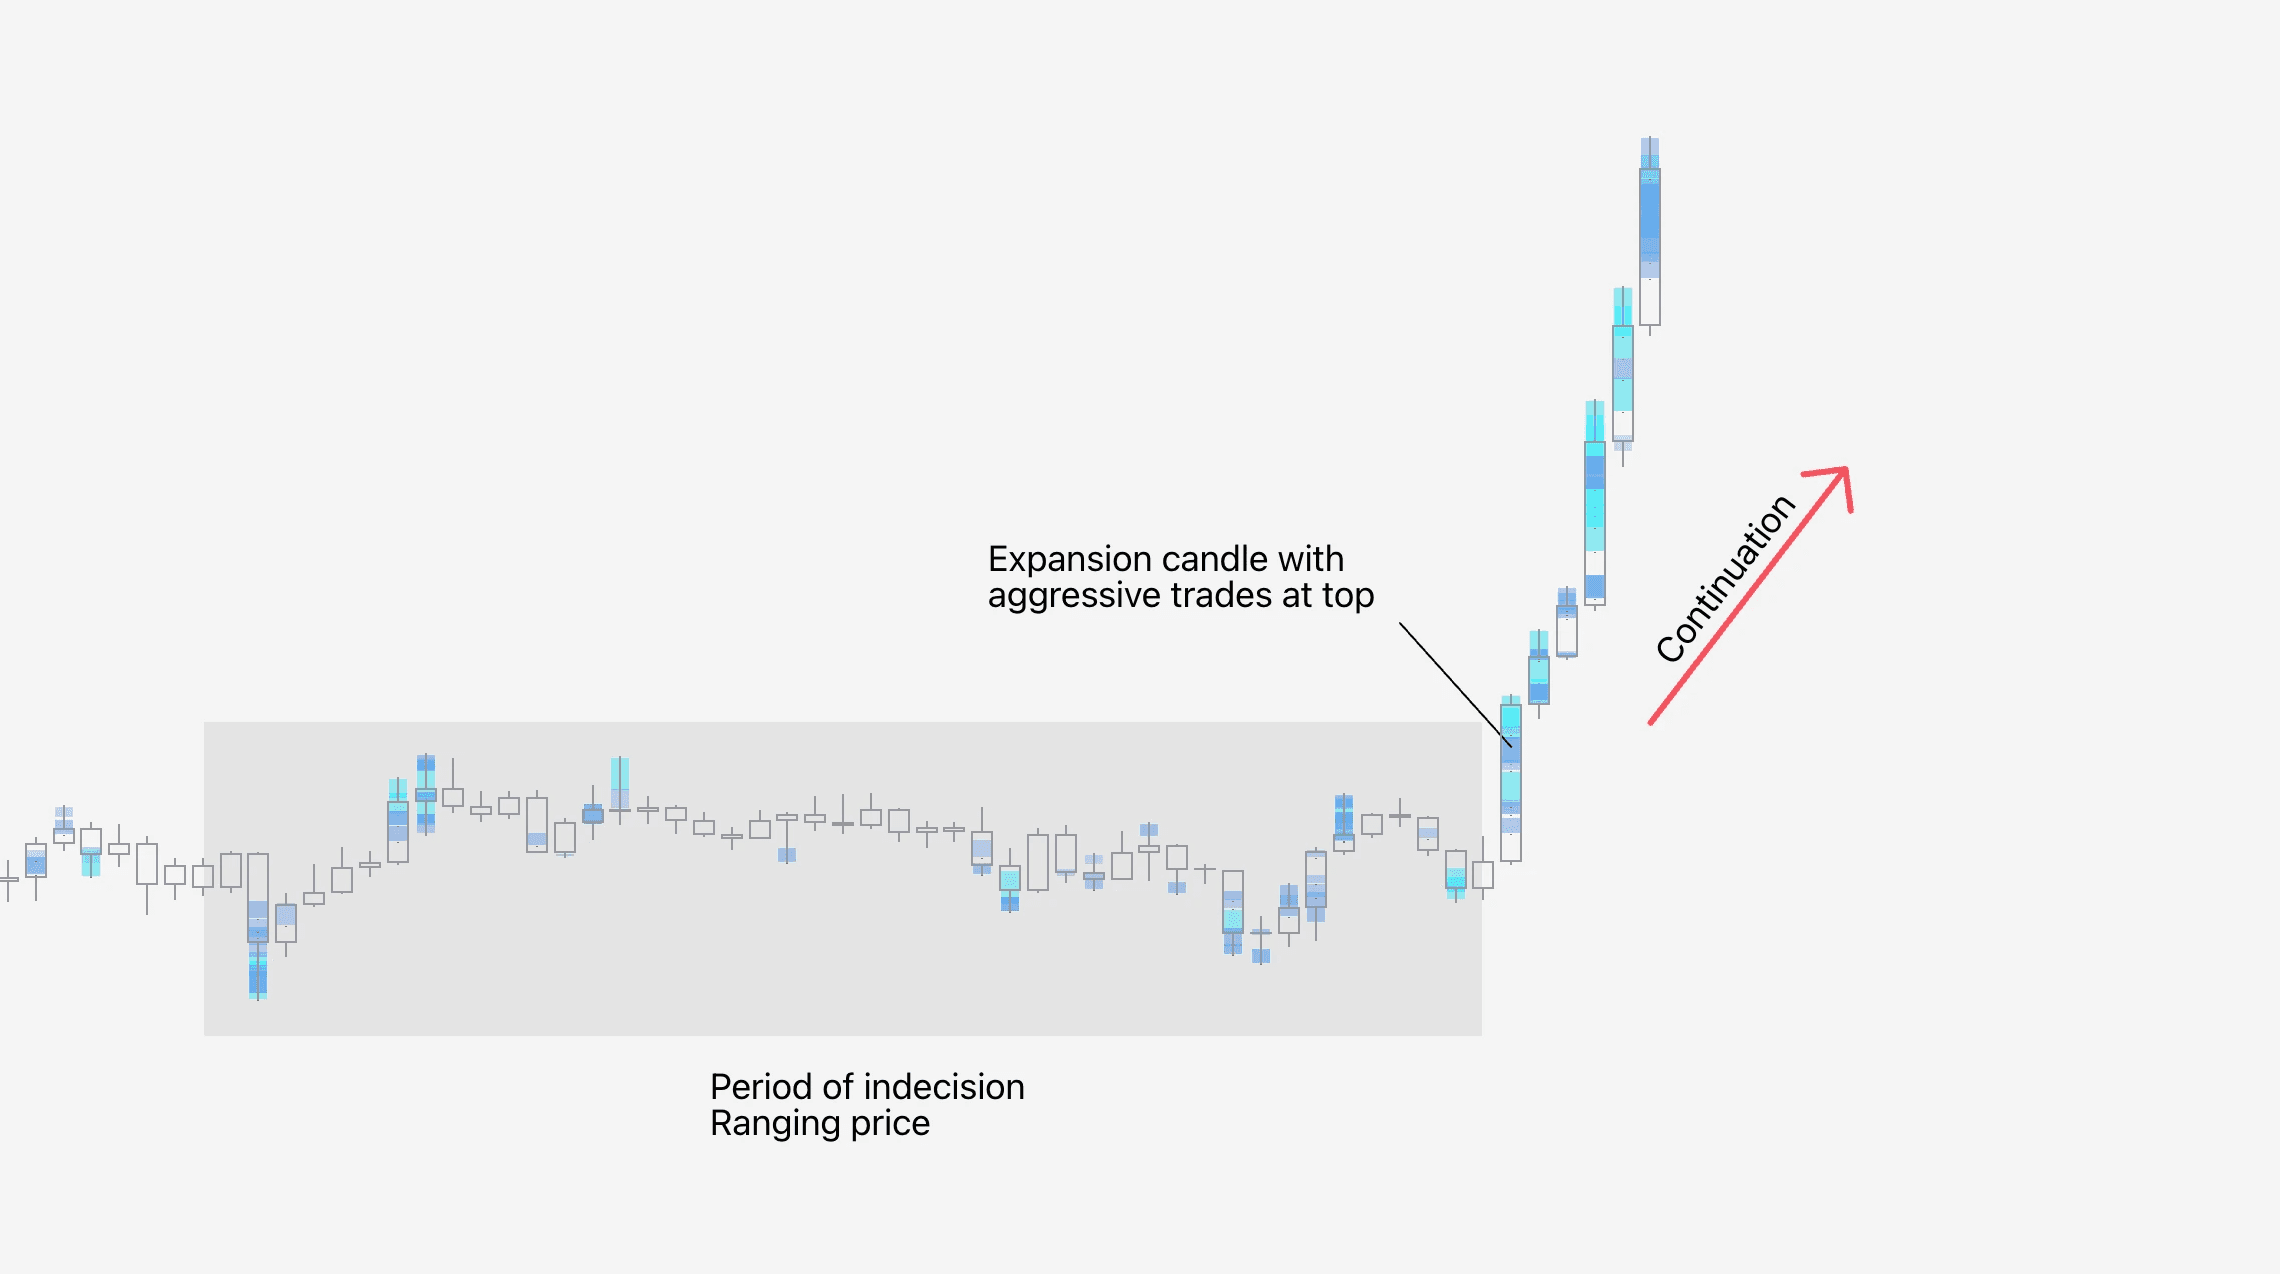
Identify trend initiation
Internal Flow, Value Area and POC are also useful for gauging when large players are initiating new moves. Uptrend initiations can be seen from large amount of flows at candle high, downtrend initiations at candle low.
Unlike with absorption, ideal point of confluence for trend initiations is a preceding low volatility/stable period of price action.
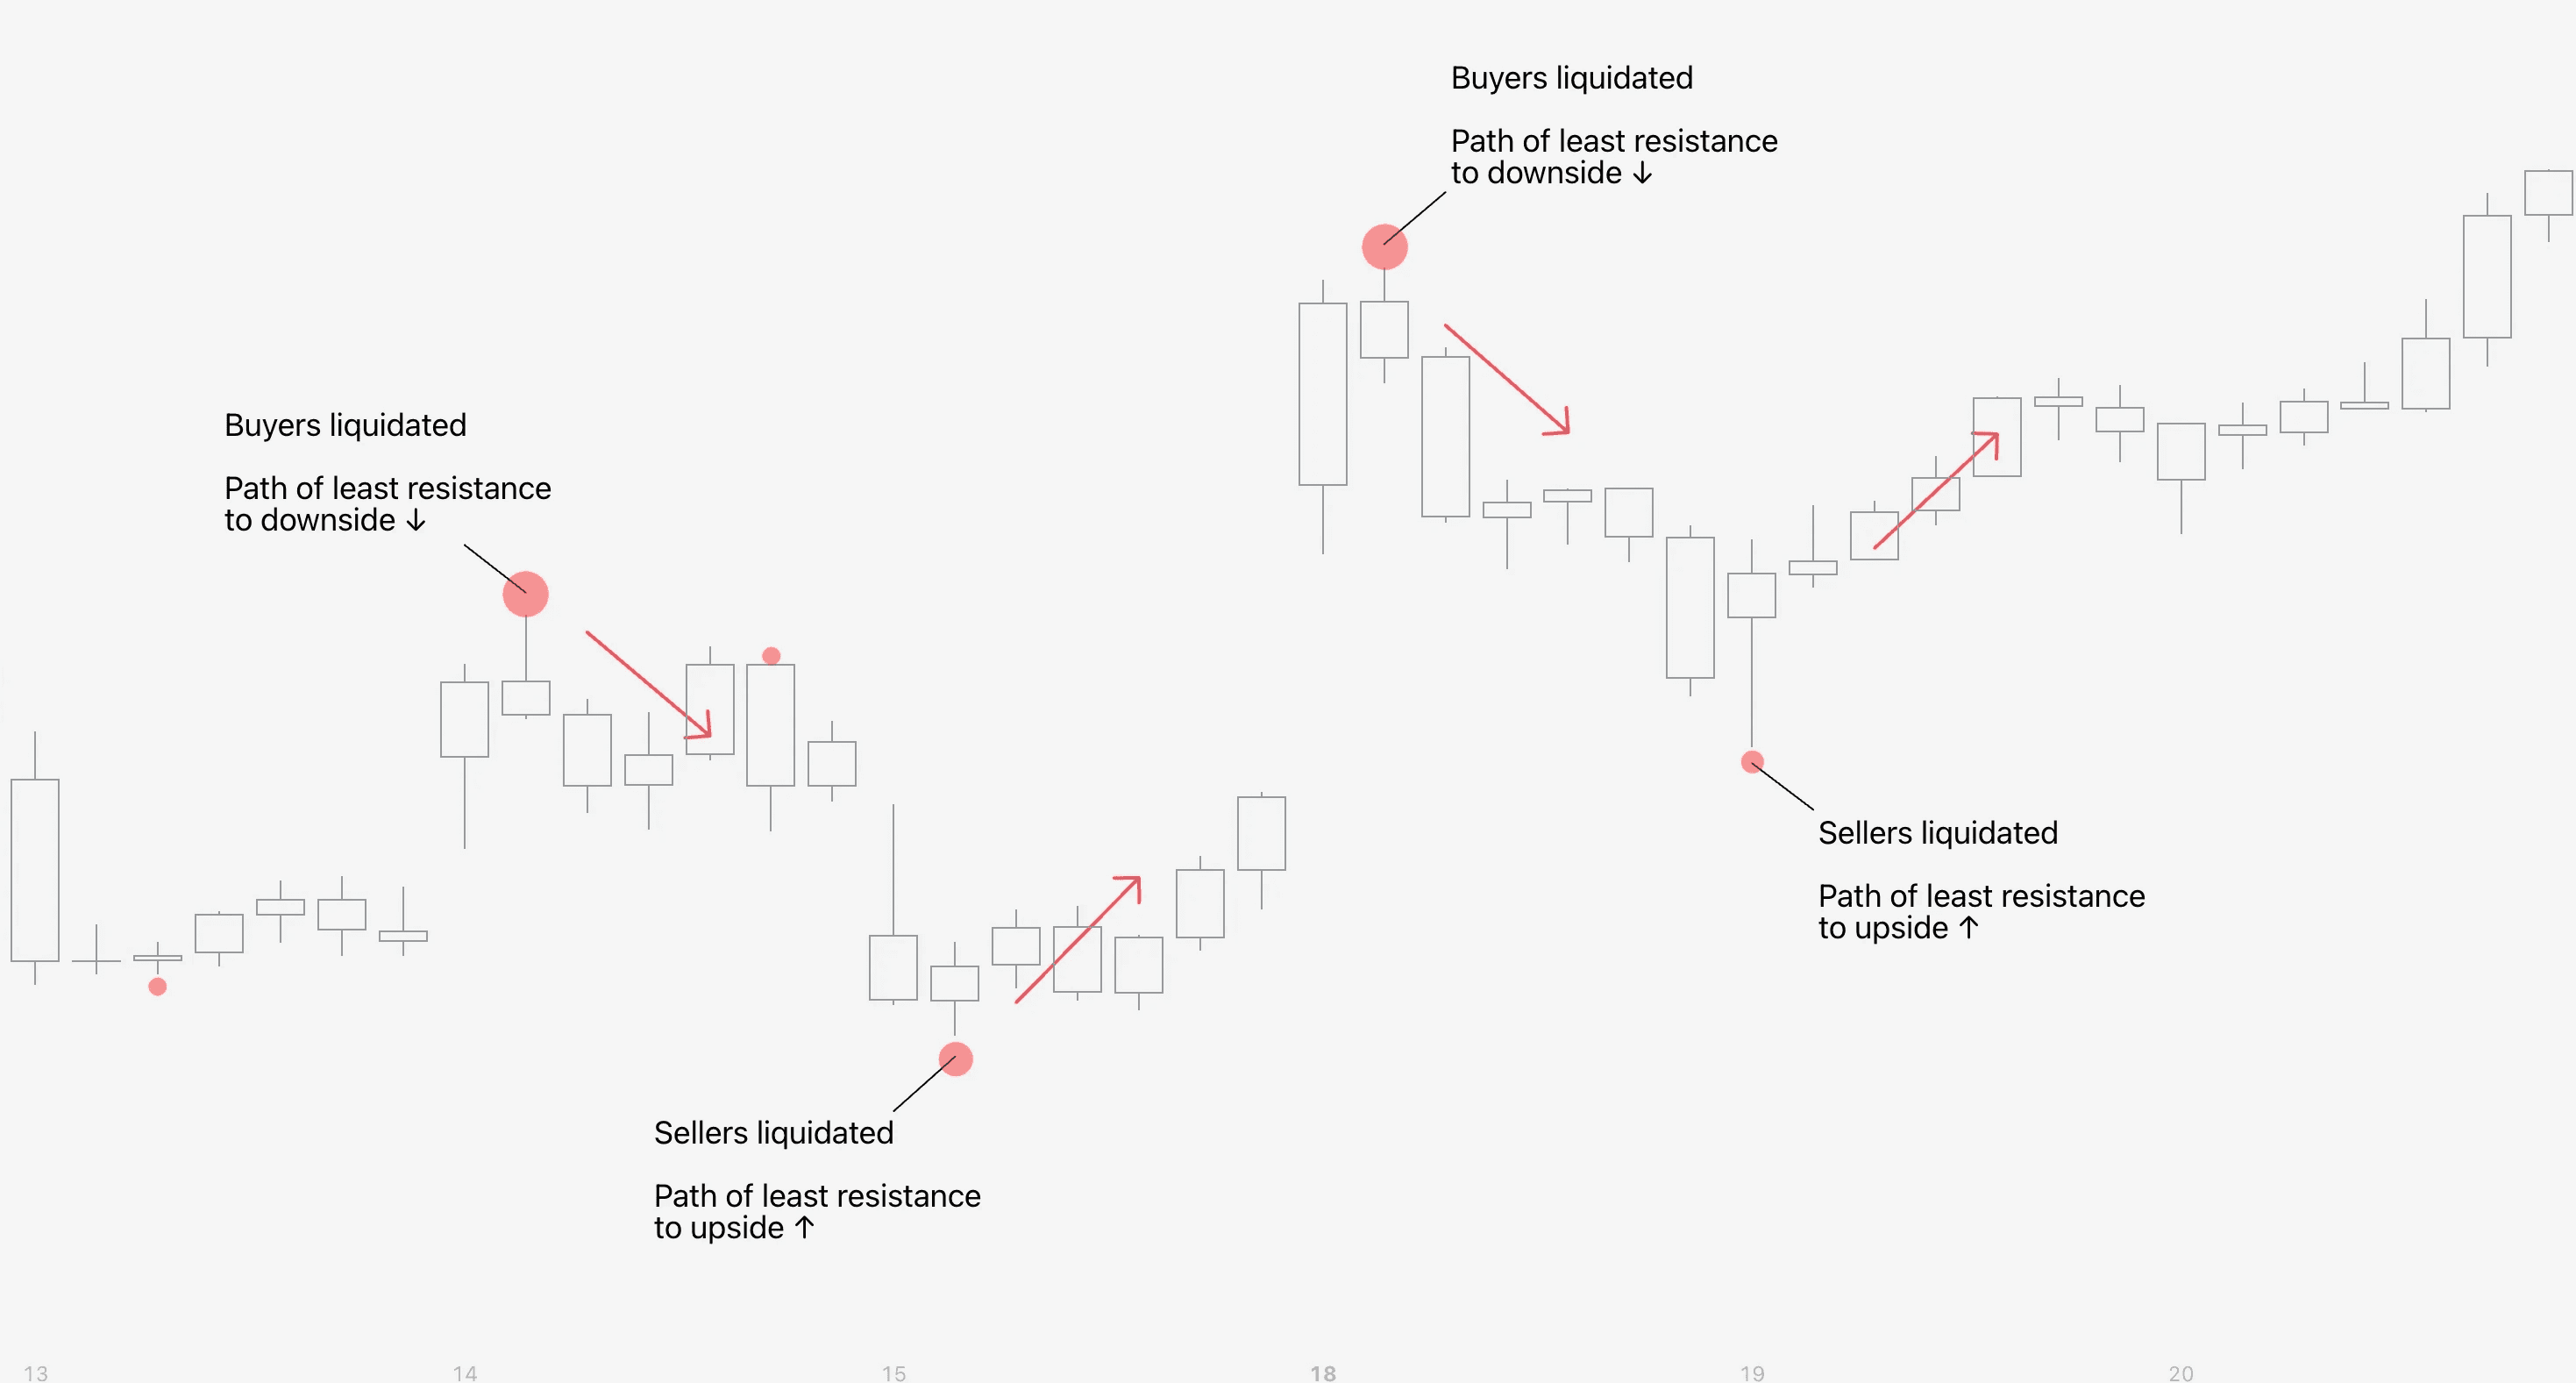
Identify rekt traders
While absorption often coincides with forced liquidations, another simple and straightforward way to detect such instances on SubFlow Terminal is liquidation bubbles and manipulation patterns.
Liquidations indicate when traders are forcefully liquidated and price moves away from them, creating ideal conditions for a halt/turn in price:
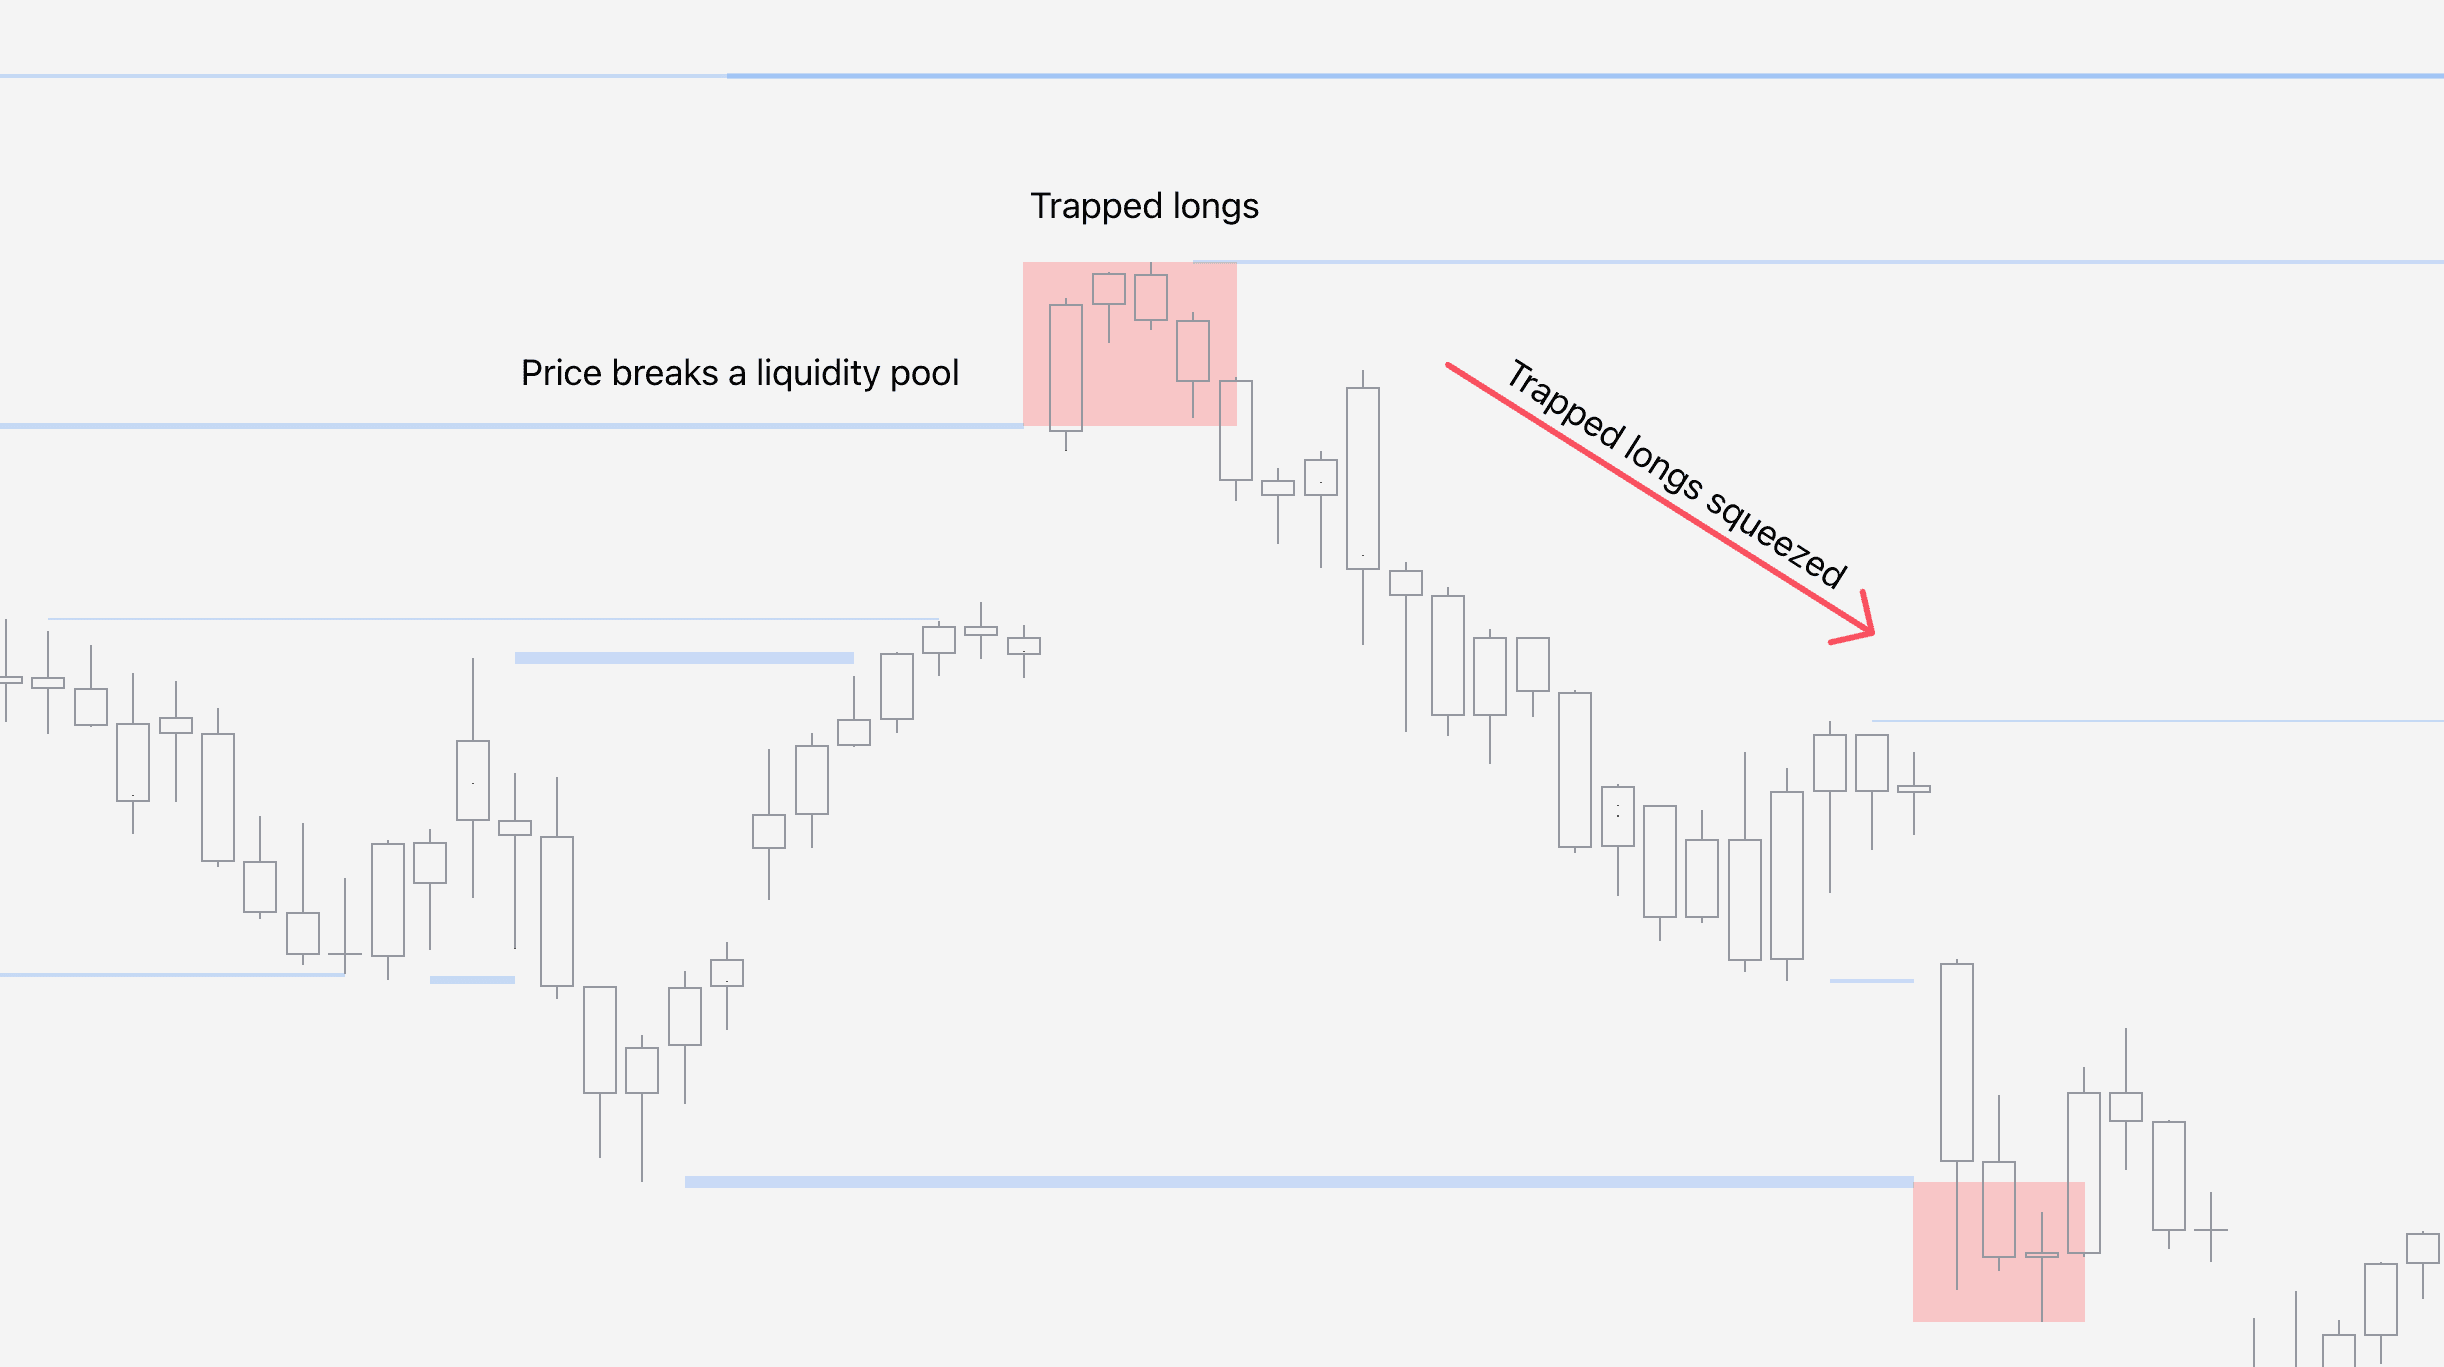
Although less frequent, manipulations are also apt indications for detecting pain. Buyers and sellers that are trapped into liquidity pool sweep create ideal conditions for long and short squeezes.
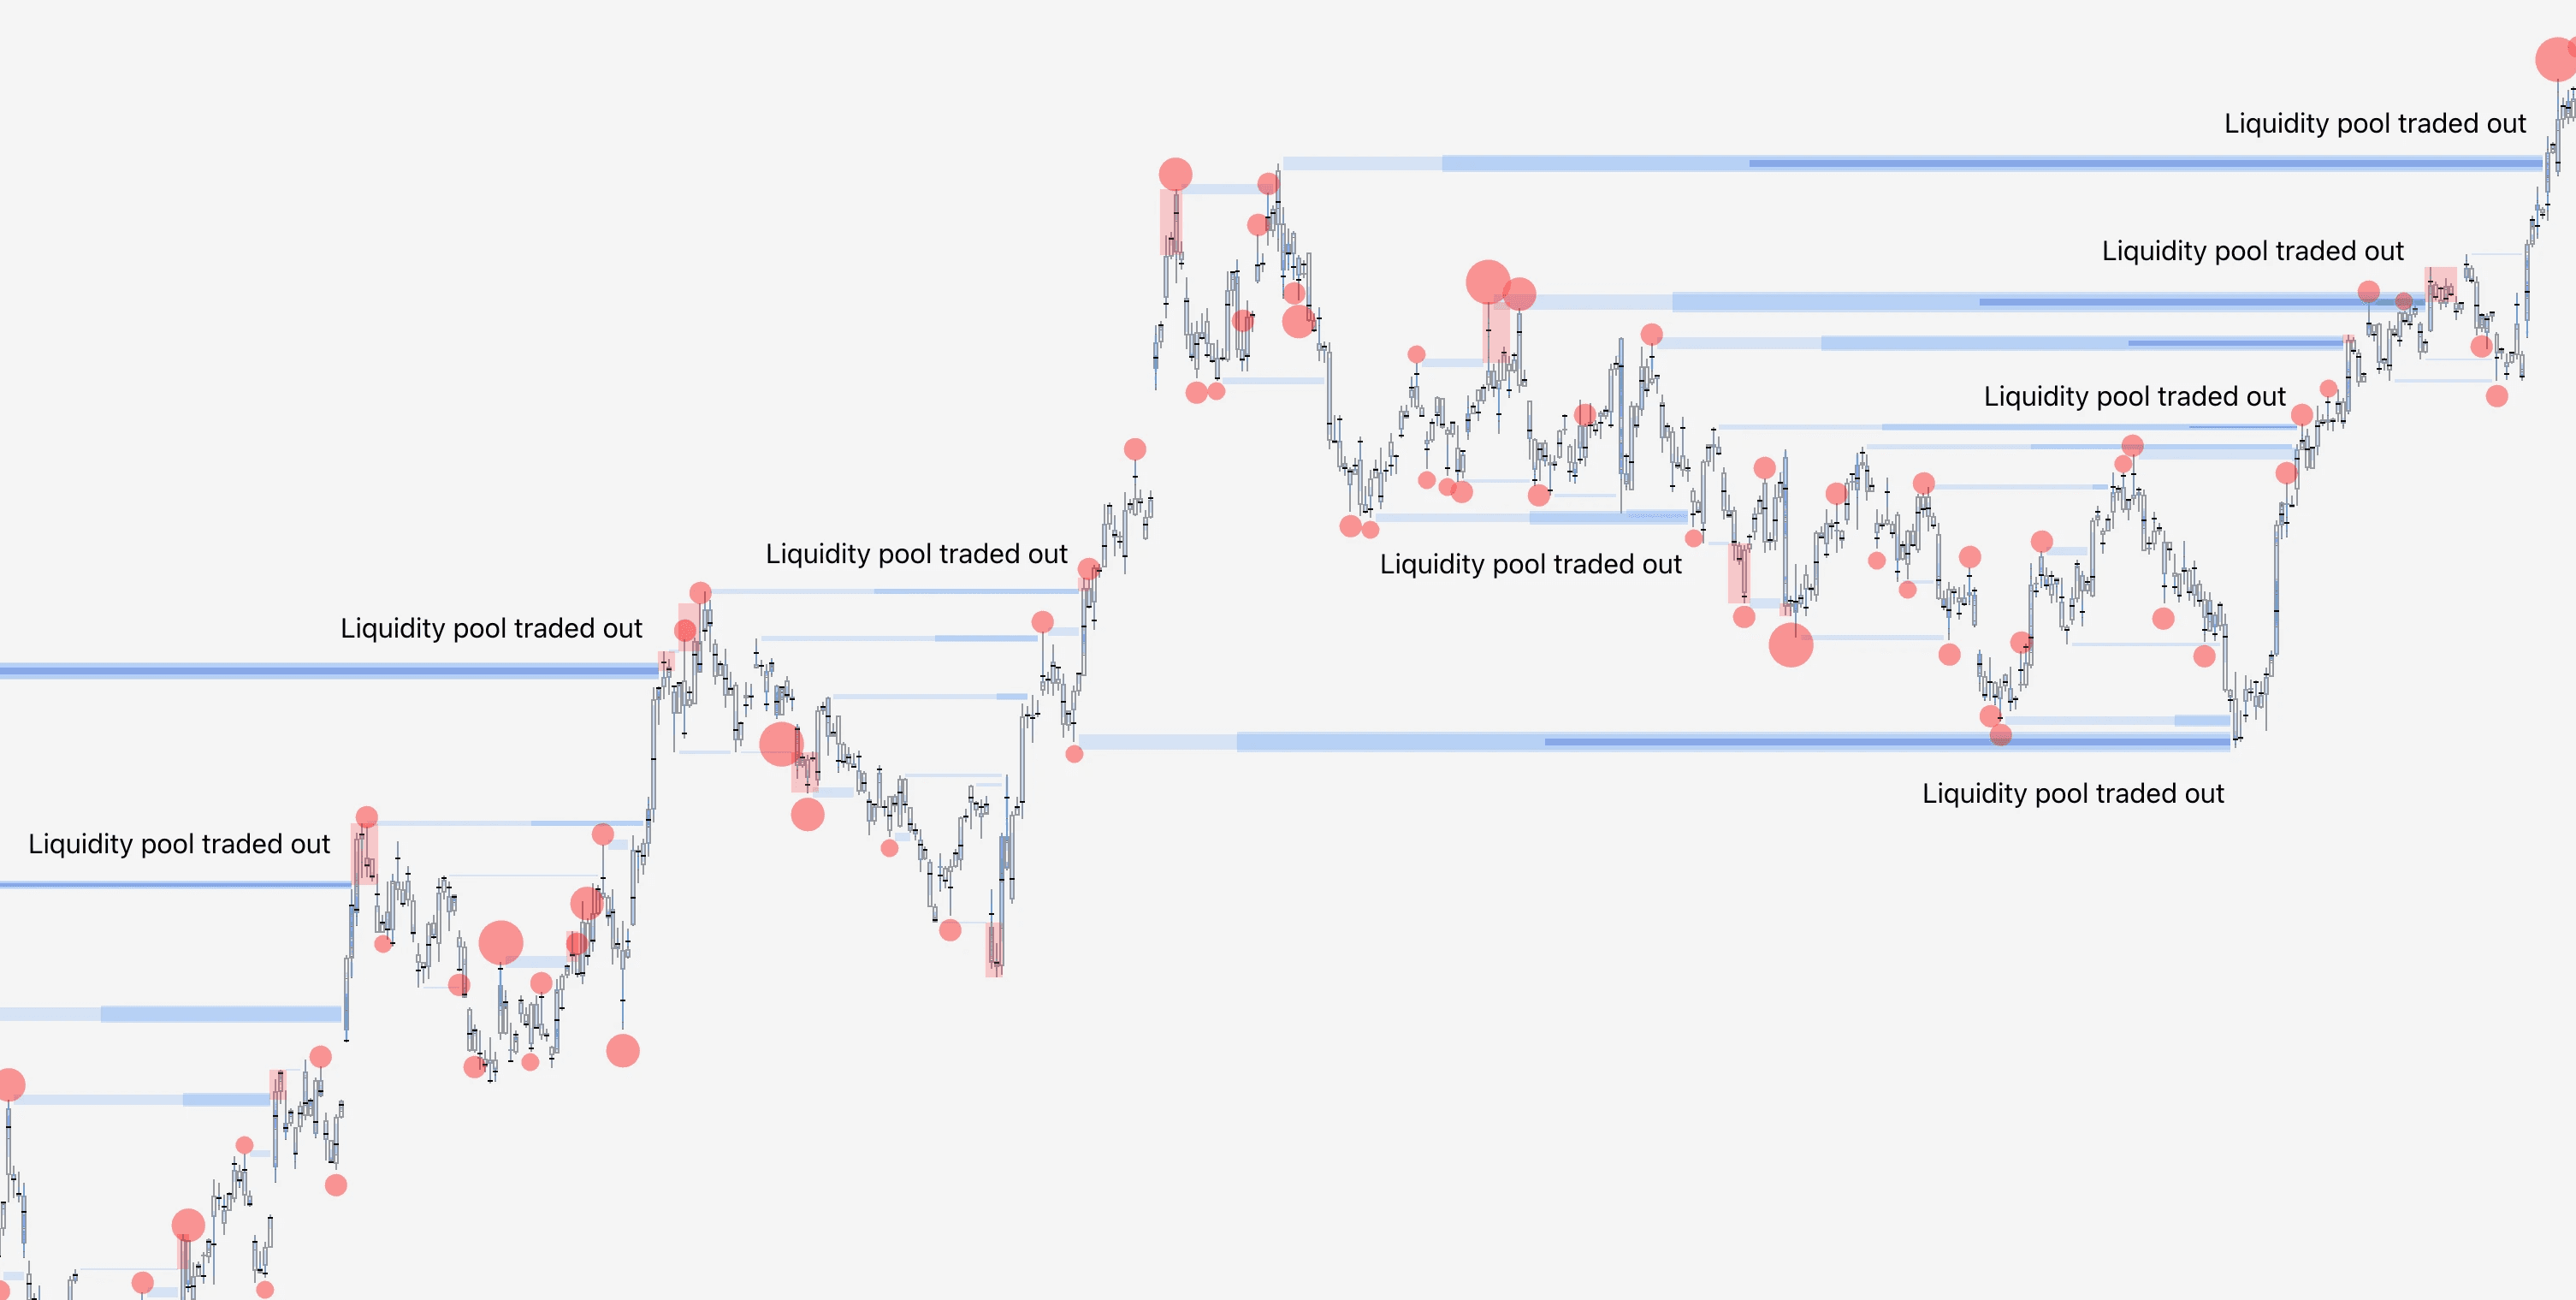
Detecting key levels
Liquidity pools on SubFlow Terminal can be used to anticipate key levels where price is likely to find liquidity, resulting in resistance.
How to use SubFlow Terminal
SubFlow Terminal is a simple, yet a powerful tool allowing one to see inside charts and identify when the flows are favorable.
Let's cover a few practical ways on how to take advantage of SubFlow Terminal.
Identify absorption/trapped traders
Absorption refers to an event where price forms a reversal shaped candle pattern, while high amount of volume is traded at the wick.
The idea behind absorption is that price found liquidity to which traders bought/sold into with high effort, but reaped little reward. Absorption can be interpreted as a sign of deep and impactful liquidity, potentially causing a halt/reversal in price.
Absorption can be seen using Internal Flow by looking for high value trades in wicks. Ideal point of confluence for absorption is a preceding parabola-type trend, increasing likelihood of exhaustion.
Although the high value trades at wick imply greater absorption (therefore more likely exhaustion/price impact), absorption can also be spotted using just Value Area and POC at wick as well.
Identify trend initiation
Internal Flow, Value Area and POC are also useful for gauging when large players are initiating new moves. Uptrend initiations can be seen from large amount of flows at candle high, downtrend initiations at candle low.
Unlike with absorption, ideal point of confluence for trend initiations is a preceding low volatility/stable period of price action.
Identify rekt traders
While absorption often coincides with forced liquidations, another simple and straightforward way to detect such instances on SubFlow Terminal is liquidation bubbles and manipulation patterns.
Liquidations indicate when traders are forcefully liquidated and price moves away from them, creating ideal conditions for a halt/turn in price:
Although less frequent, manipulations are also apt indications for detecting pain. Buyers and sellers that are trapped into liquidity pool sweep create ideal conditions for long and short squeezes.
Detecting key levels
Liquidity pools on SubFlow Terminal can be used to anticipate key levels where price is likely to find liquidity, resulting in resistance.
Mentioned in this section
Dive deeper into topics mentioned
Mentioned in this section
Dive deeper into topics mentioned


