

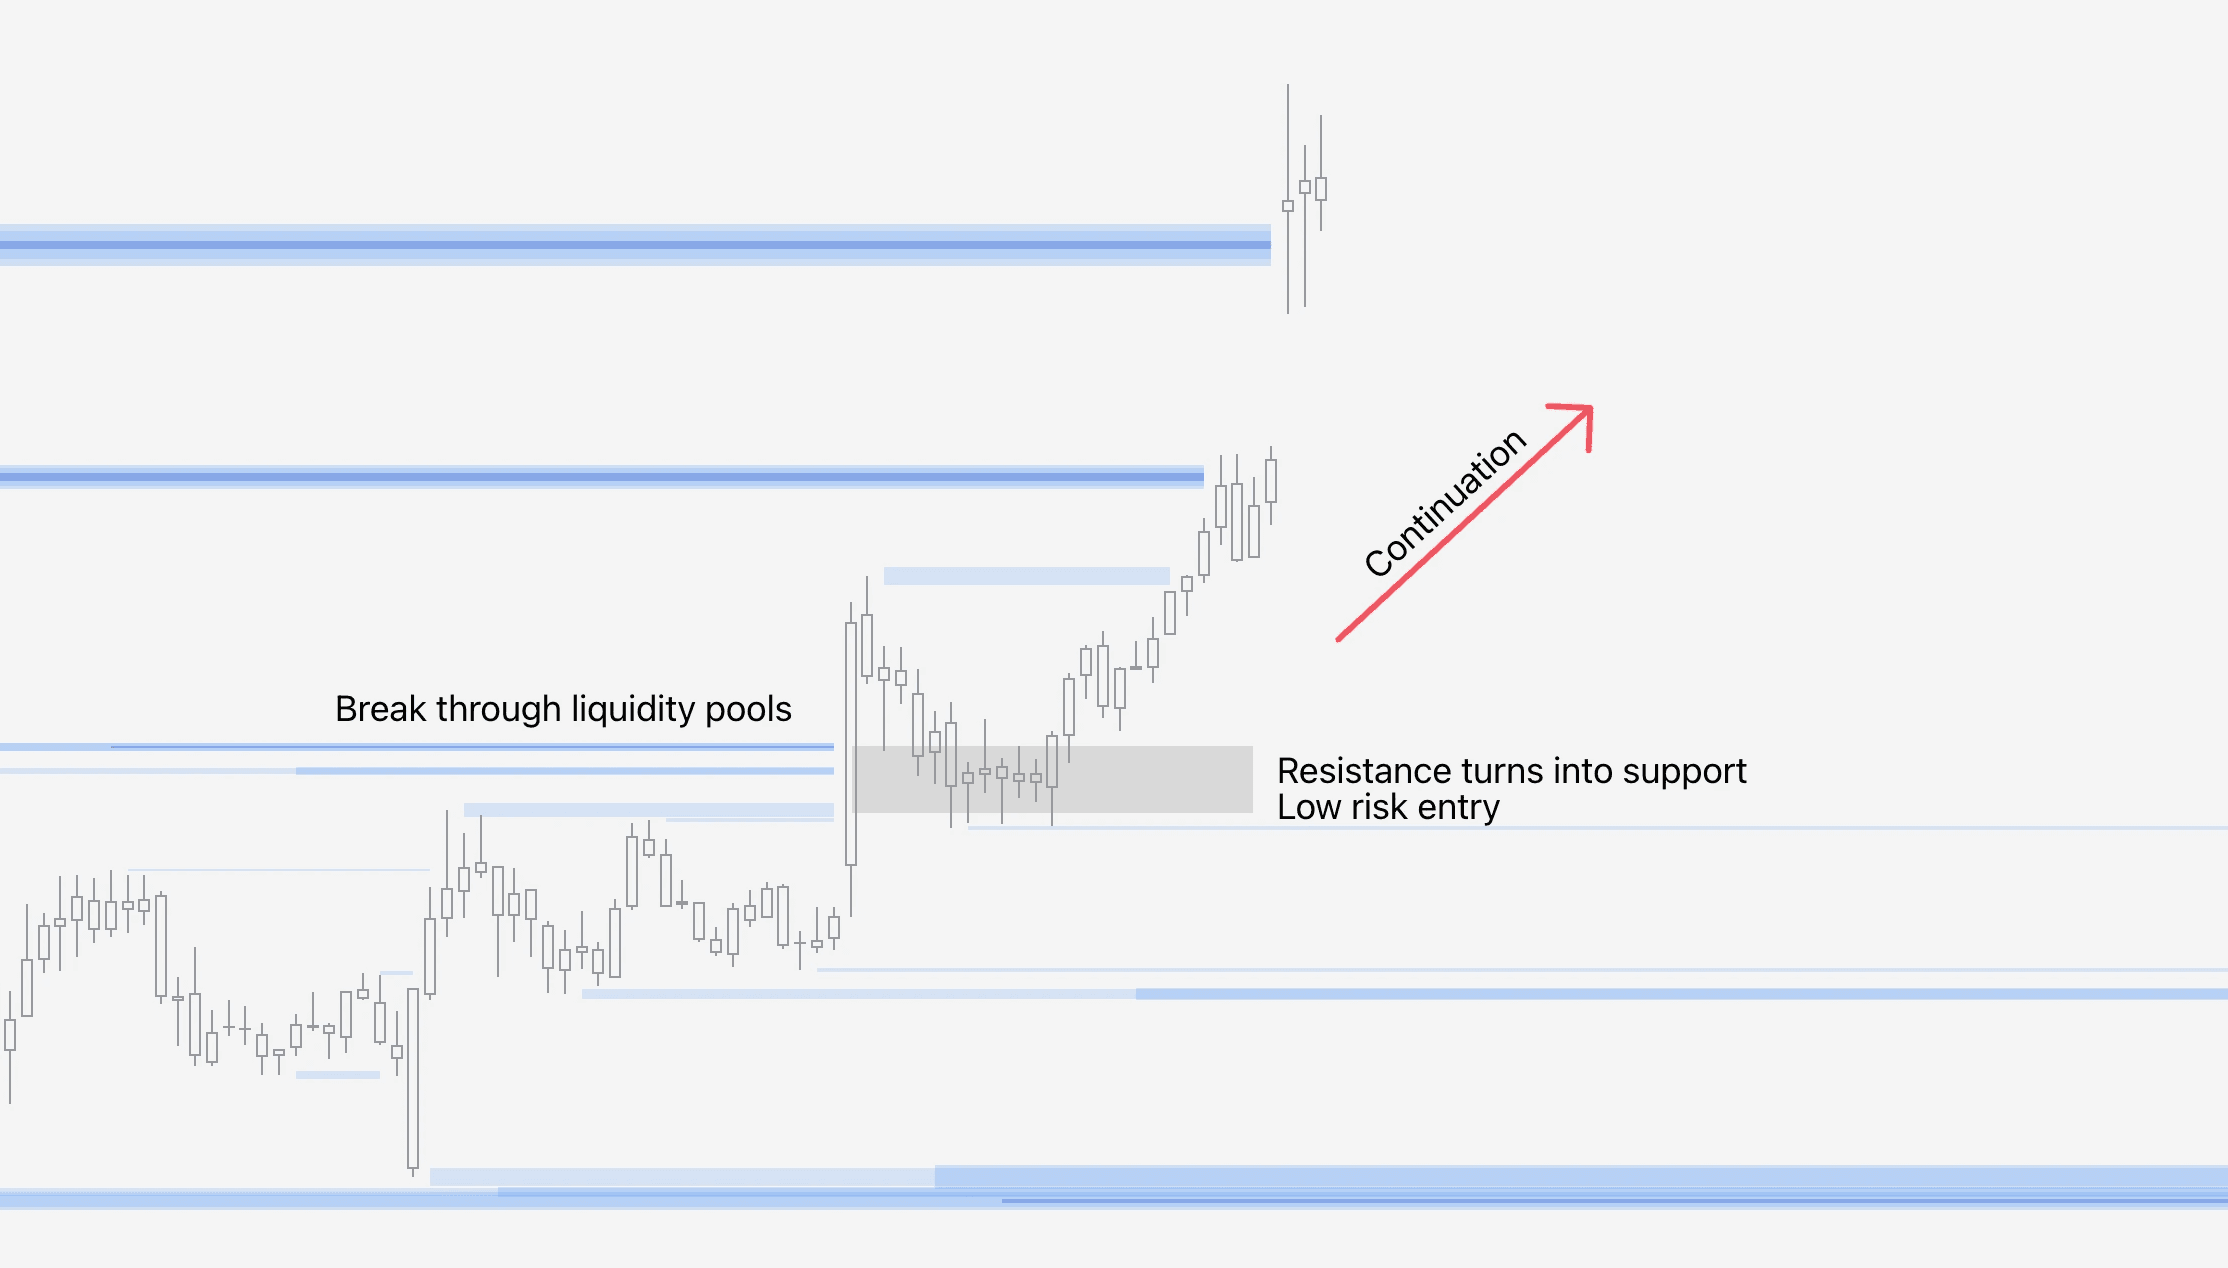
📕 Liquidity breakout
Liquidity Heatmap in FlowMap displays areas where traders have likely set large buy and sell orders, also known as resting liquidity.
These areas in price are inherently paths of resistance, where price struggles to move through due to supply/demand imbalance. But what if the path of resistance is cut through like butter?
That’s when the supply/demand imbalance resolved in favor of demand, which is evidence of strength.
Liquidity breakout |
|---|
🧰 Liquidity Heatmap |
↩️ Continuation setup |
📊 Easy difficulty |
How to identify a liquidity breakout
Liquidity breakthroughs are very obvious and easy to spot. Look for a large price move that pierces a liquidity pool.
In FlowMap liquidity pools are visualized using blue lines - the bigger the line, the larger the liquidity pool.
Bullish breakthrough | Bearish breakthrough |
|---|---|
📉 Price trending up | 📈 Price trending down |
🐮 Expansion candle up | 🐻 Expansion candle down |
⬆️ Through upside liquidity | ⬇️ Through downside liquidity |
Trading breakouts with Liquidity Heatmap
As a rule of thumb, to boost odds of a successful breakout, more than half of price move should be through the liquidity pool. Price should also not demonstrate rejection in the candle, such as wicks.
Ideally the move should also be just starting, rather than already having expanded for a while. The more “surprising” the move seems, the better.
Another beneficial factor is having price pierce through large liquidity pool(s), as this implies large demand getting upper hand over large resistance.
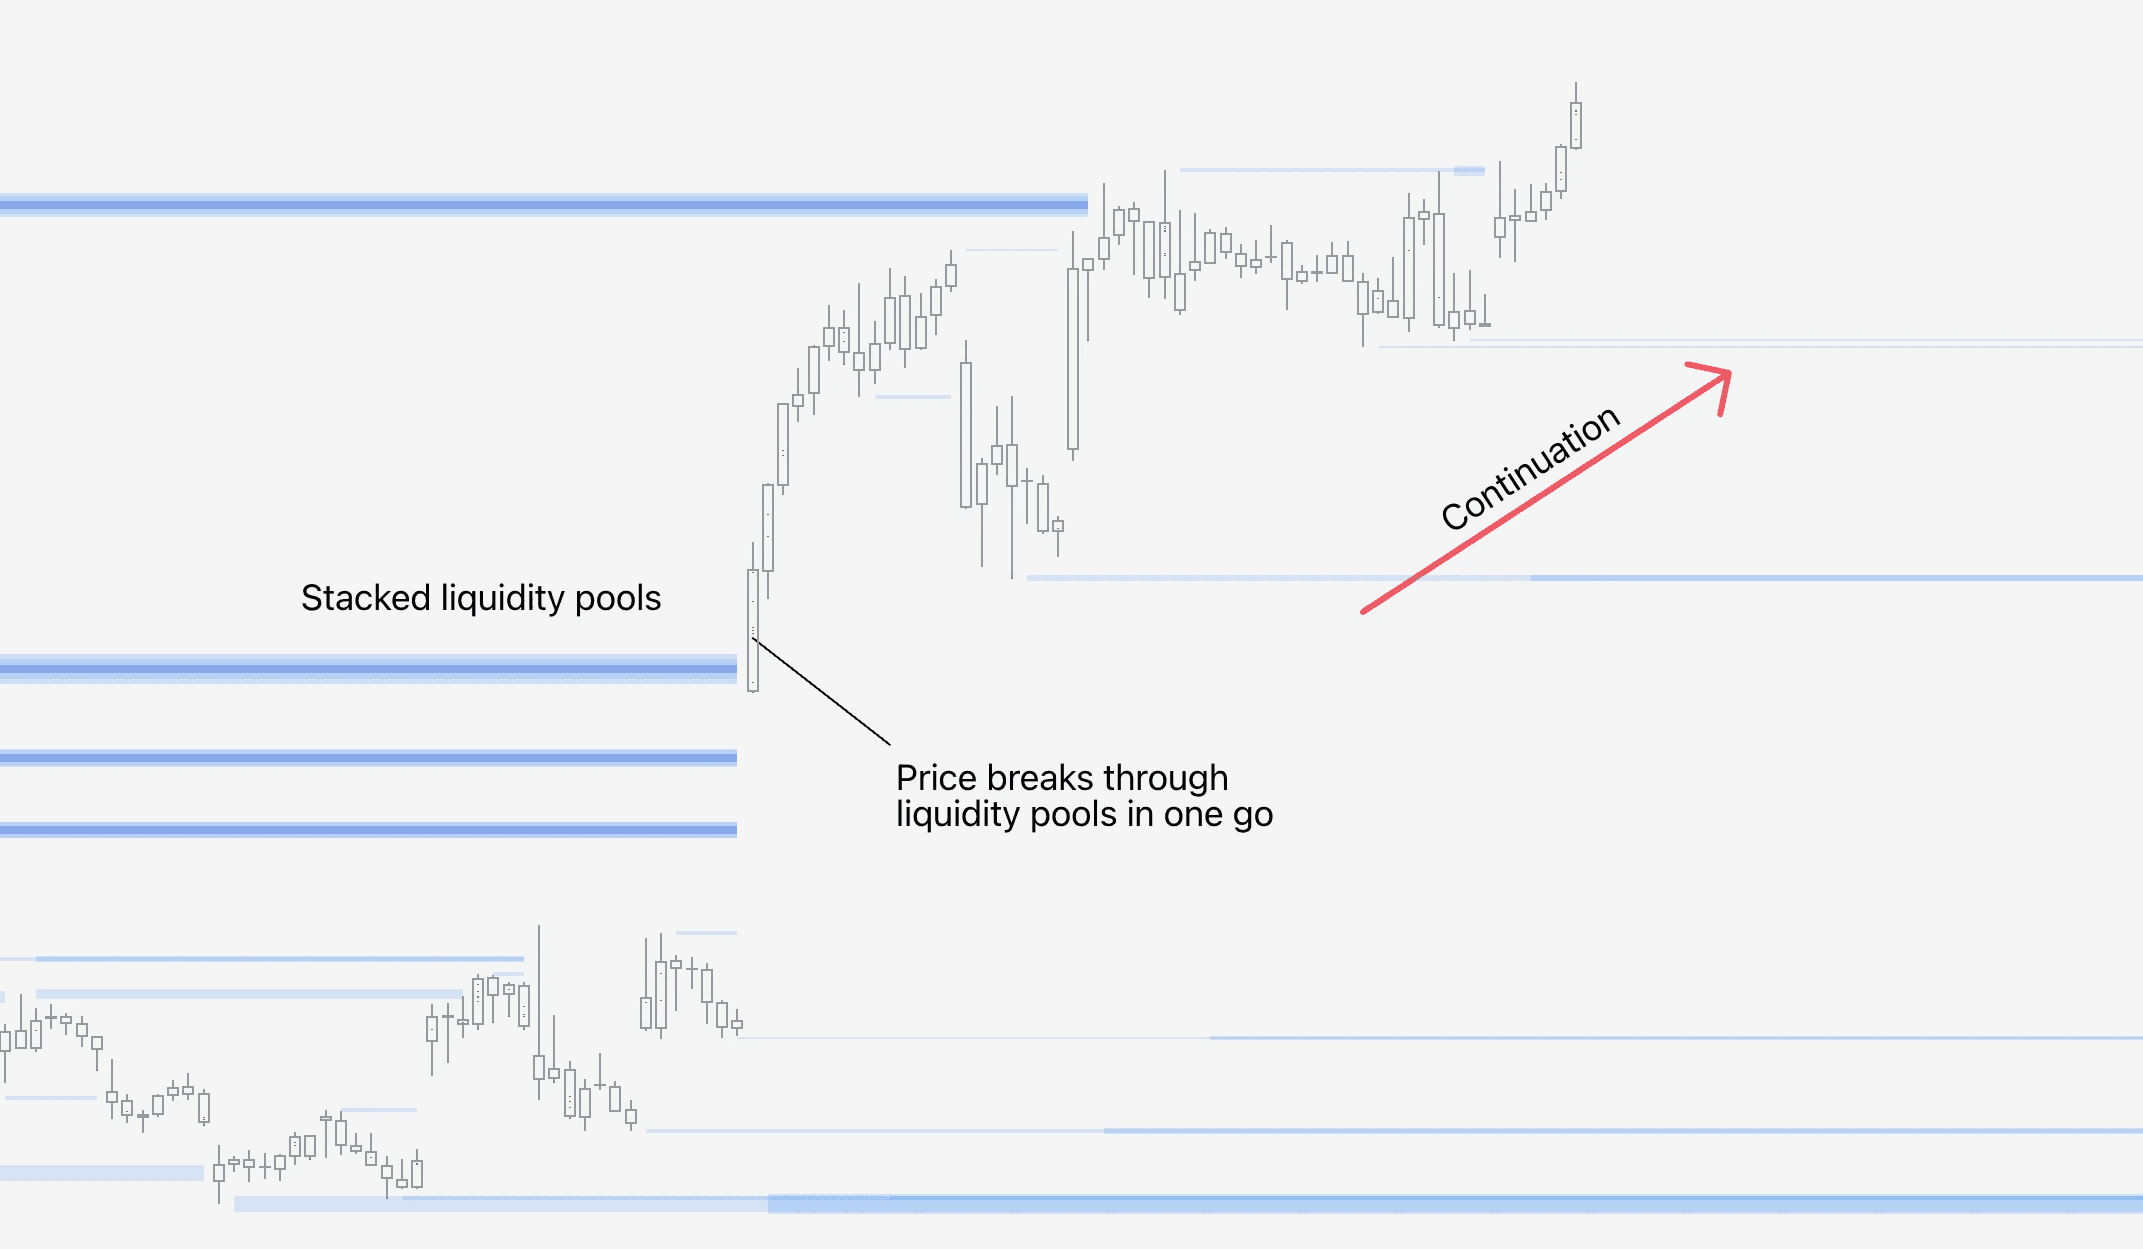
Liquidity breakthroughs should be navigated with patience, as large price moves are also exhaustive.
More often than, we can expect price to reverse towards the broken liquidity pool before continuation.
What was once resistance, turns into support and an optimal entry.
📕 Liquidity breakout
Liquidity Heatmap in FlowMap displays areas where traders have likely set large buy and sell orders, also known as resting liquidity.
These areas in price are inherently paths of resistance, where price struggles to move through due to supply/demand imbalance. But what if the path of resistance is cut through like butter?
That’s when the supply/demand imbalance resolved in favor of demand, which is evidence of strength.
Liquidity breakout |
|---|
🧰 Liquidity Heatmap |
↩️ Continuation setup |
📊 Easy difficulty |
How to identify a liquidity breakout
Liquidity breakthroughs are very obvious and easy to spot. Look for a large price move that pierces a liquidity pool.
In FlowMap liquidity pools are visualized using blue lines - the bigger the line, the larger the liquidity pool.
Bullish breakthrough | Bearish breakthrough |
|---|---|
📉 Price trending up | 📈 Price trending down |
🐮 Expansion candle up | 🐻 Expansion candle down |
⬆️ Through upside liquidity | ⬇️ Through downside liquidity |
Trading breakouts with Liquidity Heatmap
As a rule of thumb, to boost odds of a successful breakout, more than half of price move should be through the liquidity pool. Price should also not demonstrate rejection in the candle, such as wicks.
Ideally the move should also be just starting, rather than already having expanded for a while. The more “surprising” the move seems, the better.
Another beneficial factor is having price pierce through large liquidity pool(s), as this implies large demand getting upper hand over large resistance.
Liquidity breakthroughs should be navigated with patience, as large price moves are also exhaustive.
More often than, we can expect price to reverse towards the broken liquidity pool before continuation.
What was once resistance, turns into support and an optimal entry.
Mentioned in this section
Dive deeper into topics mentioned
Mentioned in this section
Dive deeper into topics mentioned
Mentioned in this section
Dive deeper into topics mentioned

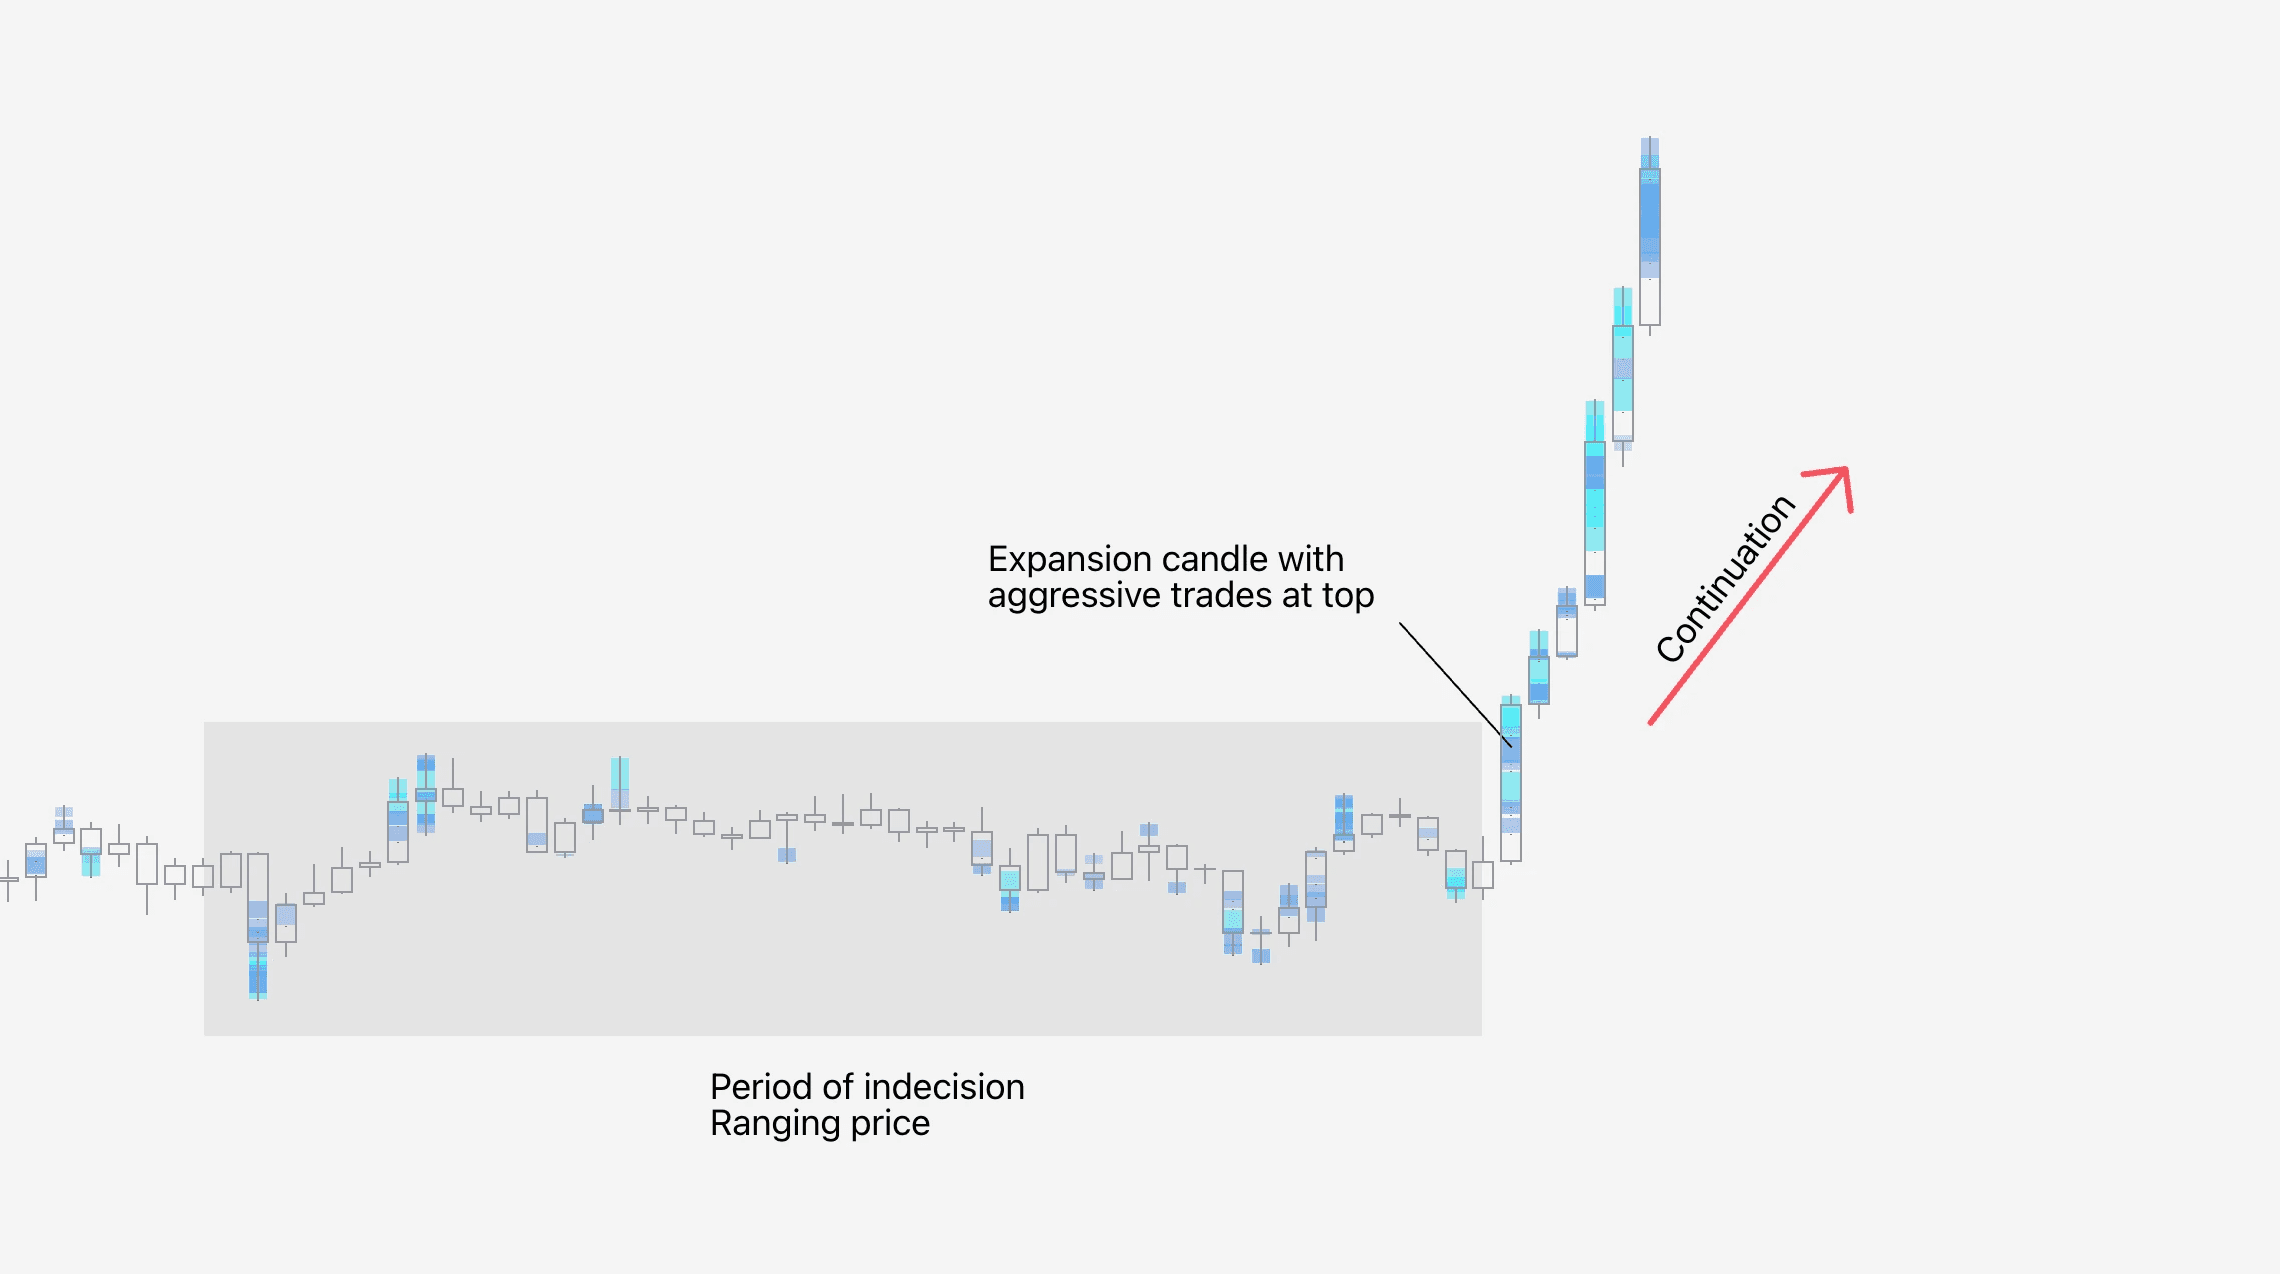
📗 Follow key flows
FlowMap can be used to identify when traders are positioning for a pending price moves, seen from key flows developing in Value Area & POC and Internal Flow.
Forced liquidations |
|---|
🧰 Value Area & POC, Internal Flow |
↩️ Continuation setup |
📊 Moderate difficulty |
What's following key flows?
Following flows simply means paying attention to where most volume is trading at and figuring out what the intention might be.
For example, if most volume is consistently trading at a higher price than on previous candle, we can tell traders are interested in seeking new fair value at higher prices.
How to identify what the flows are intending?
Sometimes the flows are contradictory. This can be mitigated greatly by taking into account price action when reading the flows.
Generally speaking, expanding candles are associated with price seeking higher/lower prices. Reversal shaped candles on the other hand are associated with rejecting higher/lower prices.
Then we look at the flows. If the flows are taking place at high of an expansive upside candle, the flows intend to seek new fair value at higher prices.
Opposite is true for lower prices, for that we’d look for key flows taking place at low of an expansive downside candle.
Bullish flows | Bearish flows |
|---|---|
📉 Price bottomed or stable | 📈 Price topped or stable |
🐮 Expansion candle up | 🐻 Expansion candle down |
⬆️ Value Area/Internal Flow at highs | ⬇️ Value Area/Internal Flow at lows |
Trading key flows with Value Area & POC
The best way to look for an element of surprise building a foundation for a surprise led trend, it's ideal to first identify uncertainty.
An effective way to do that is identifying price action that is ranging, boring with low volatility. Not going up, not going down.
When this period of nothing is followed by a sudden expansive move with value area and point of control in the same direction, key flows are seeking new fair value.
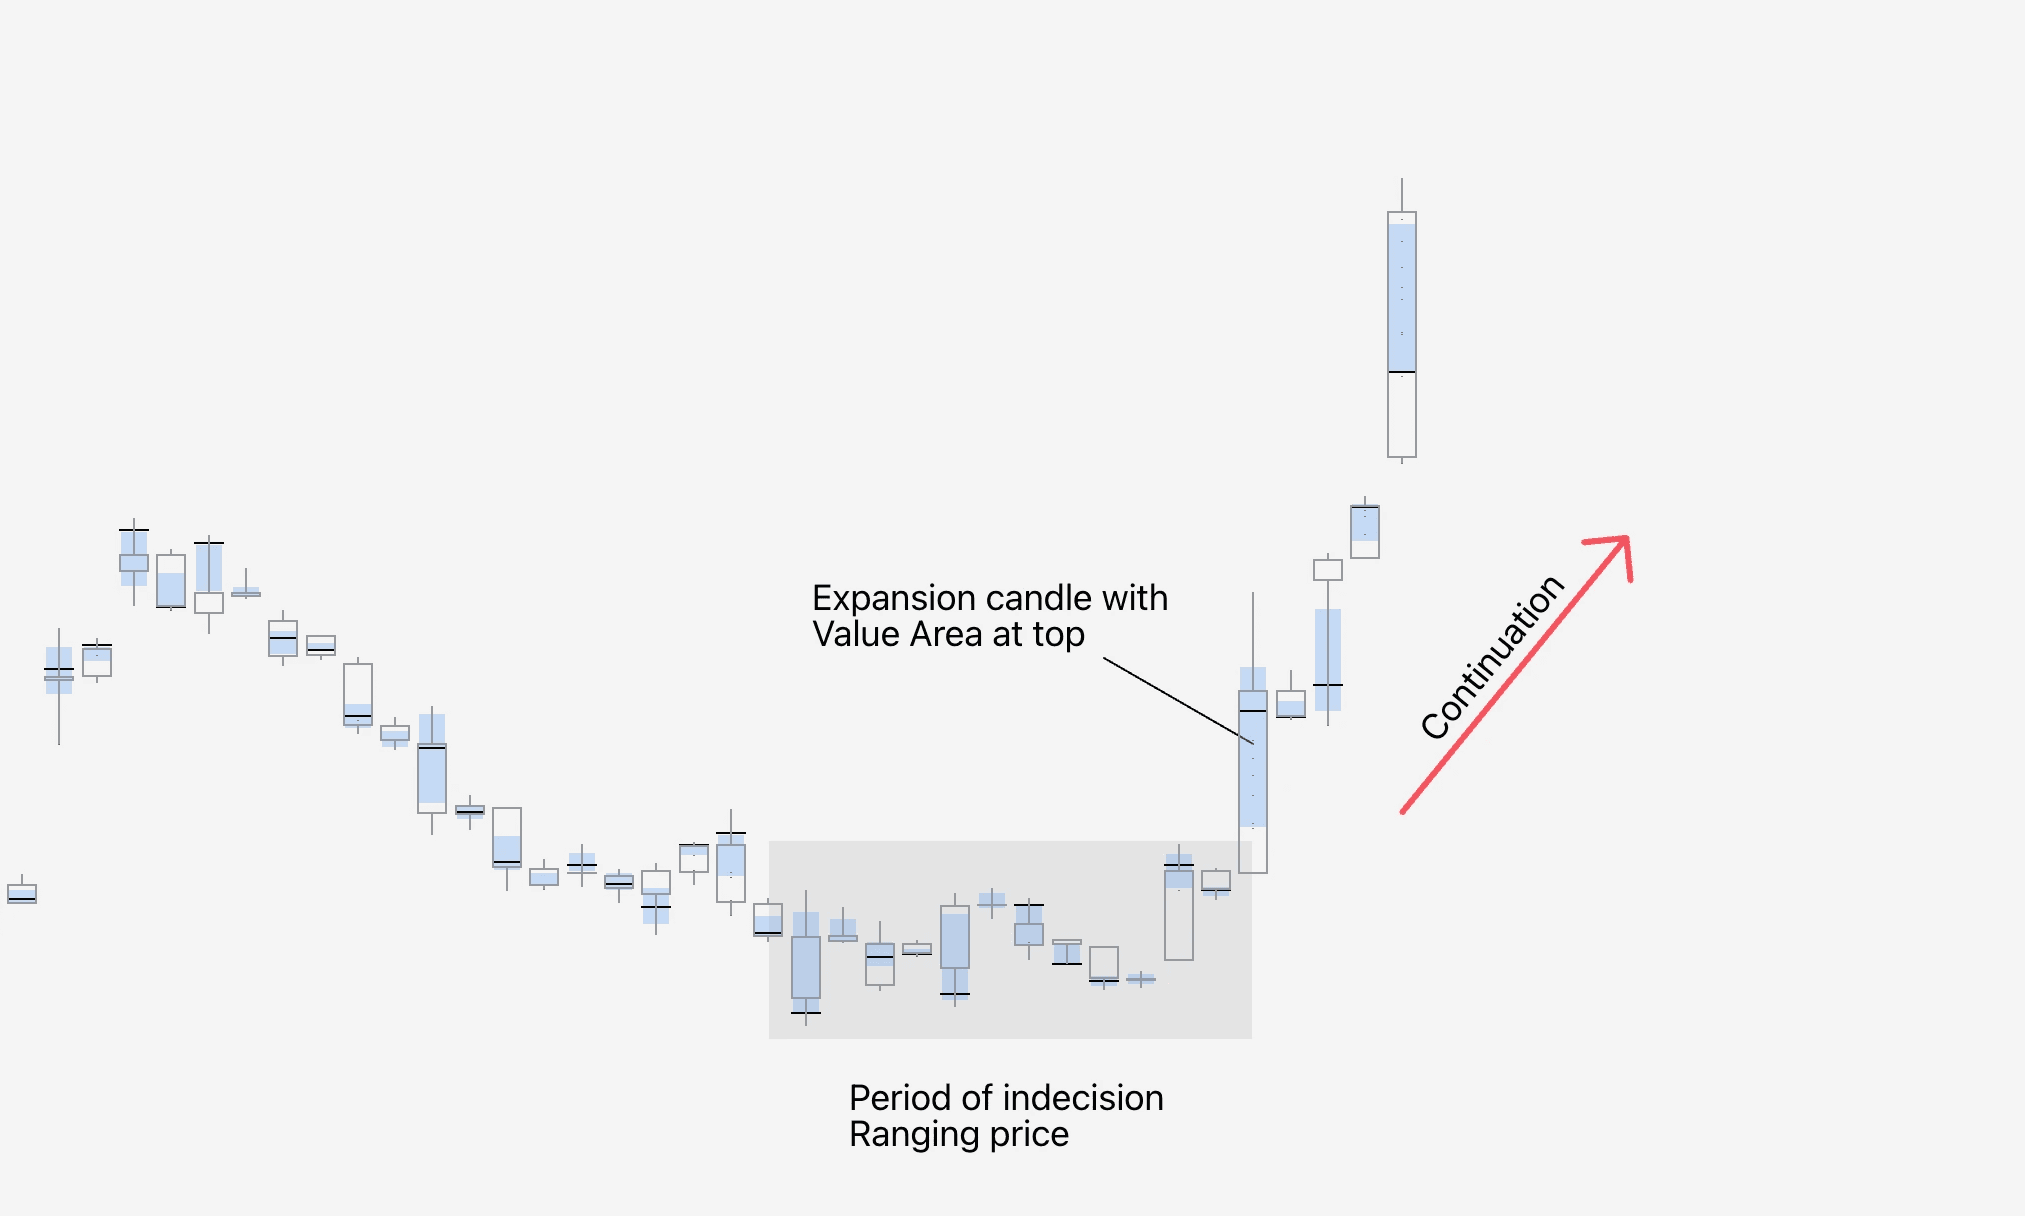
We can also gauge key flows from Internal Flow, showing where fewer but more aggressive and high value trades are occurring.
📗 Follow key flows
FlowMap can be used to identify when traders are positioning for a pending price moves, seen from key flows developing in Value Area & POC and Internal Flow.
Forced liquidations |
|---|
🧰 Value Area & POC, Internal Flow |
↩️ Continuation setup |
📊 Moderate difficulty |
What's following key flows?
Following flows simply means paying attention to where most volume is trading at and figuring out what the intention might be.
For example, if most volume is consistently trading at a higher price than on previous candle, we can tell traders are interested in seeking new fair value at higher prices.
How to identify what the flows are intending?
Sometimes the flows are contradictory. This can be mitigated greatly by taking into account price action when reading the flows.
Generally speaking, expanding candles are associated with price seeking higher/lower prices. Reversal shaped candles on the other hand are associated with rejecting higher/lower prices.
Then we look at the flows. If the flows are taking place at high of an expansive upside candle, the flows intend to seek new fair value at higher prices.
Opposite is true for lower prices, for that we’d look for key flows taking place at low of an expansive downside candle.
Bullish flows | Bearish flows |
|---|---|
📉 Price bottomed or stable | 📈 Price topped or stable |
🐮 Expansion candle up | 🐻 Expansion candle down |
⬆️ Value Area/Internal Flow at highs | ⬇️ Value Area/Internal Flow at lows |
Trading key flows with Value Area & POC
The best way to look for an element of surprise building a foundation for a surprise led trend, it's ideal to first identify uncertainty.
An effective way to do that is identifying price action that is ranging, boring with low volatility. Not going up, not going down.
When this period of nothing is followed by a sudden expansive move with value area and point of control in the same direction, key flows are seeking new fair value.
We can also gauge key flows from Internal Flow, showing where fewer but more aggressive and high value trades are occurring.
Mentioned in this section
Dive deeper into topics mentioned
Mentioned in this section
Dive deeper into topics mentioned
Mentioned in this section
Dive deeper into topics mentioned


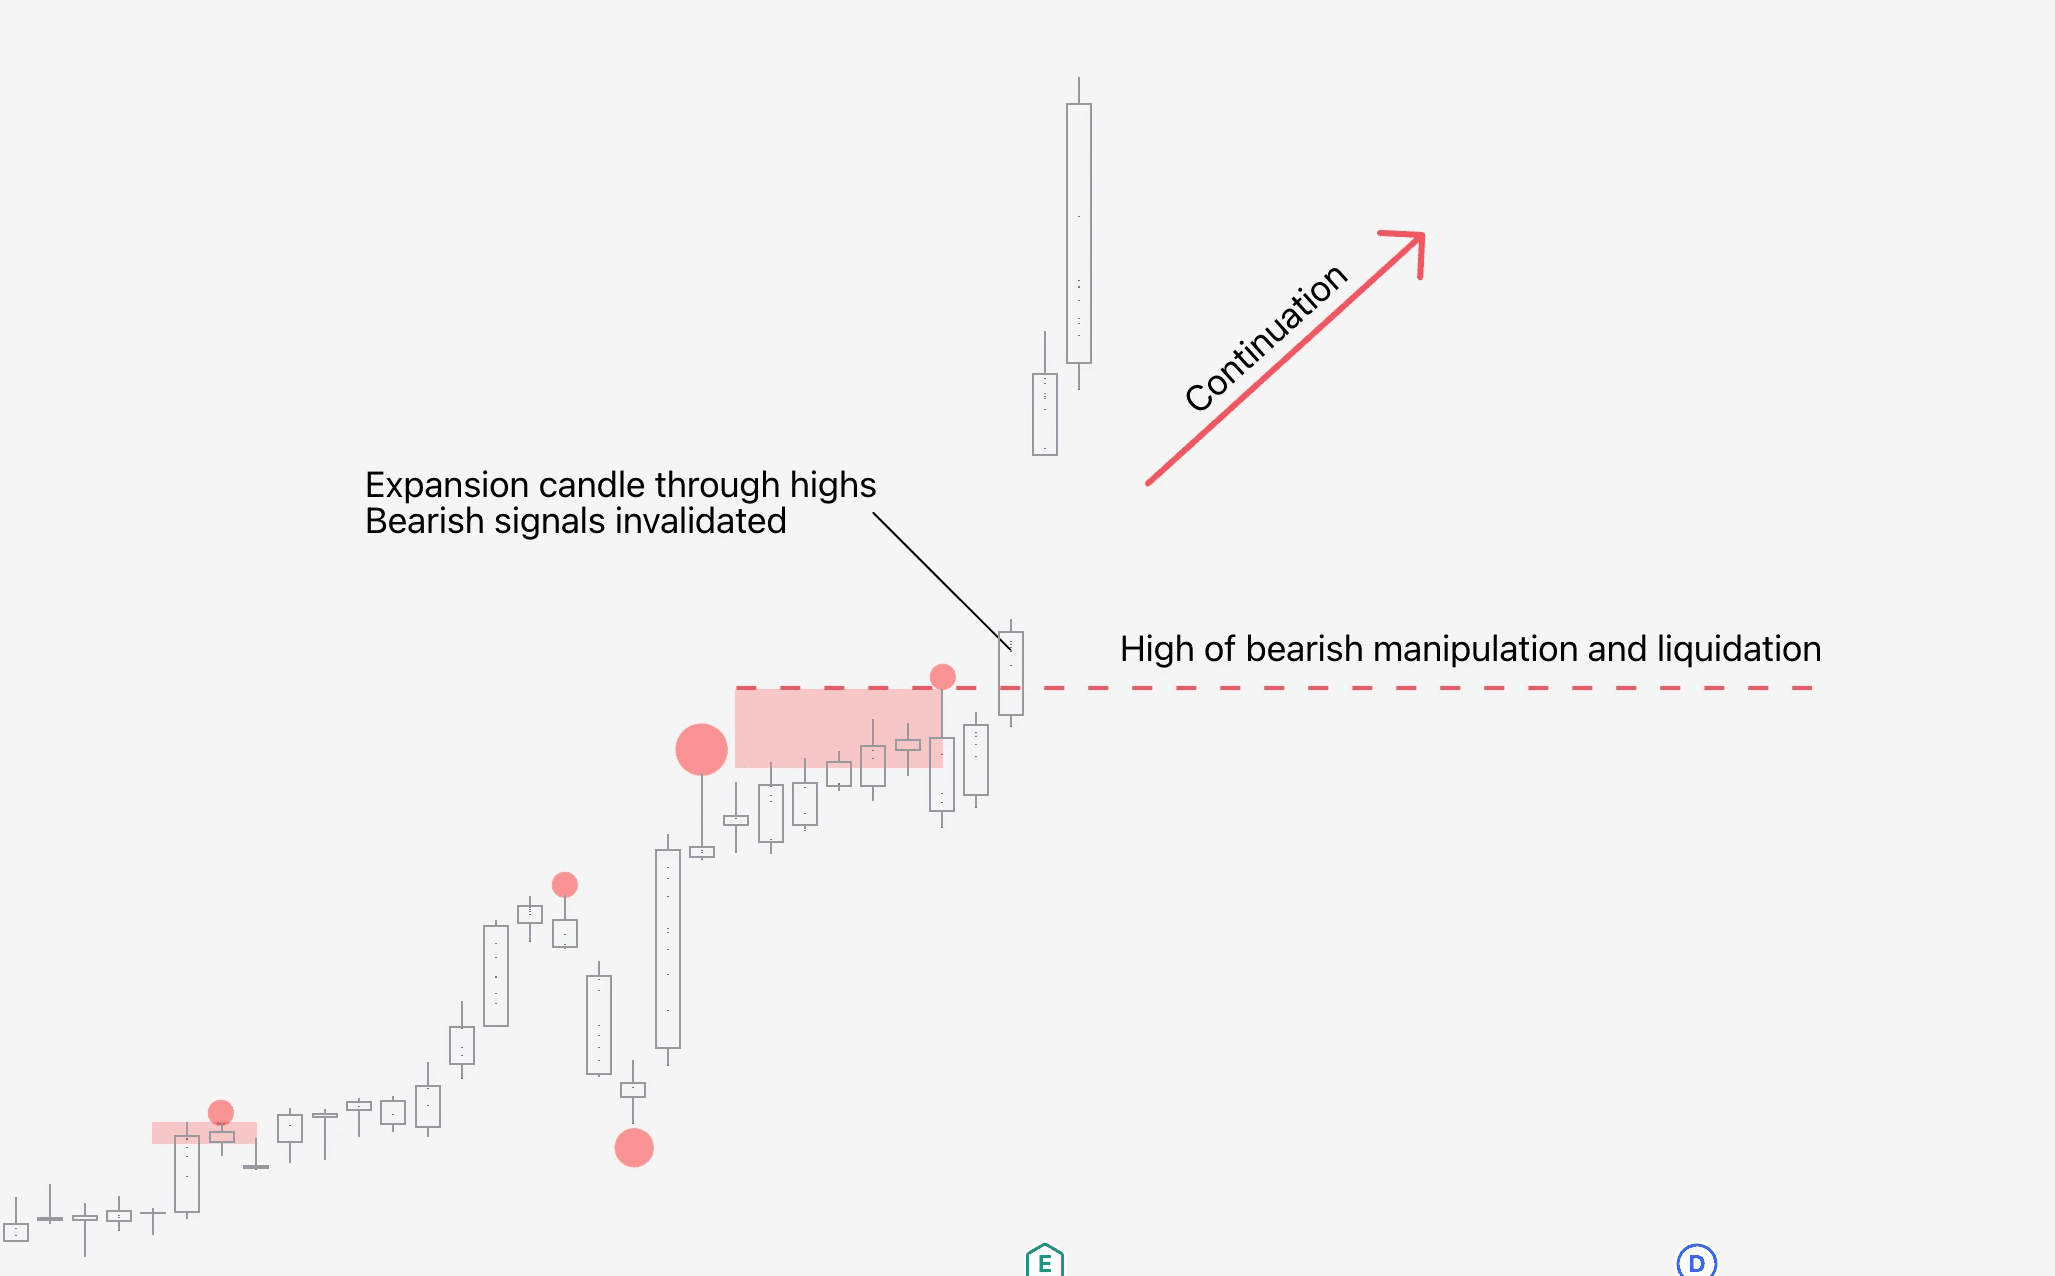
📘 Failed reversal patterns
FlowMap has several orderflow events that are associated with price either halting or reversing.
However, when these patterns fail, their signification reverses, hinting price is more likely to have continuation.
Long/short squeeze |
|---|
🧰 Liquidity Heatmap, Liquidations |
↩️ Continuation setup |
📊 Easy difficulty |
What are failed reversal patterns?
The idea behind failed reversal patterns is that when price should've done one thing (reverse) but did the opposite (continue trending), it is a sign of underlying strength.
Failed reversal patterns also have a psychological impact convincing traders to switch their bias and join the price move as the expected did not occur.
In FlowMap, the main reversal patterns can be identified using Liquidations and Manipulations.
Bullish failed reversal pattern | Bearish failed reversal pattern |
|---|---|
📉 Price trending up | 📈 Price trending down |
🐻 Bearish liquidation/manipulation | 🐮 Bullish liquidation/manipulation |
⬆️ Expansion candle up | ⬇️ Expansion candle down |
Trading failed reversal patterns
In order to qualify for a failed reversal pattern, the highs/lows of the pattern should be exceeded by a strong expansion candle within 1-2 candles after the pattern is detected.
For example, in order for bearish liquidation to qualify as failed, the high of the liquidation candle should be swiftly exceeded by an expansion candle.
Same goes with other reversal patterns such as manipulation - mark the highs and monitor for an imminent break.
Mentioned in this section
Dive deeper into topics mentioned
Mentioned in this section
Dive deeper into topics mentioned
Mentioned in this section
Dive deeper into topics mentioned

Continue gaining knowledge 💪
That's a wrap for continuation trades. Often times continuation trends move for longer, fueled by strength and are there ideal for high risk/reward trades if risk management is done right.
Take a look at all the other lessons and playbooks, covering reversal trades and how each part in FlowMap moves. Or better yet, flows. Find more lessons here 👇


