

Reading Fair Value Bands
Fair Value Bands consist of three bands above and below the middle line. Middle line is what we consider to be fair value, a "normal" and expected location for price to trade at.
The further the bands go above middle line (+1 to +3) or below middle line (-1 to -3), the more unfair and extreme the price level is.
Here's an image breaking down each band and their expected risk level and bias for price action.

Time and volume statistics
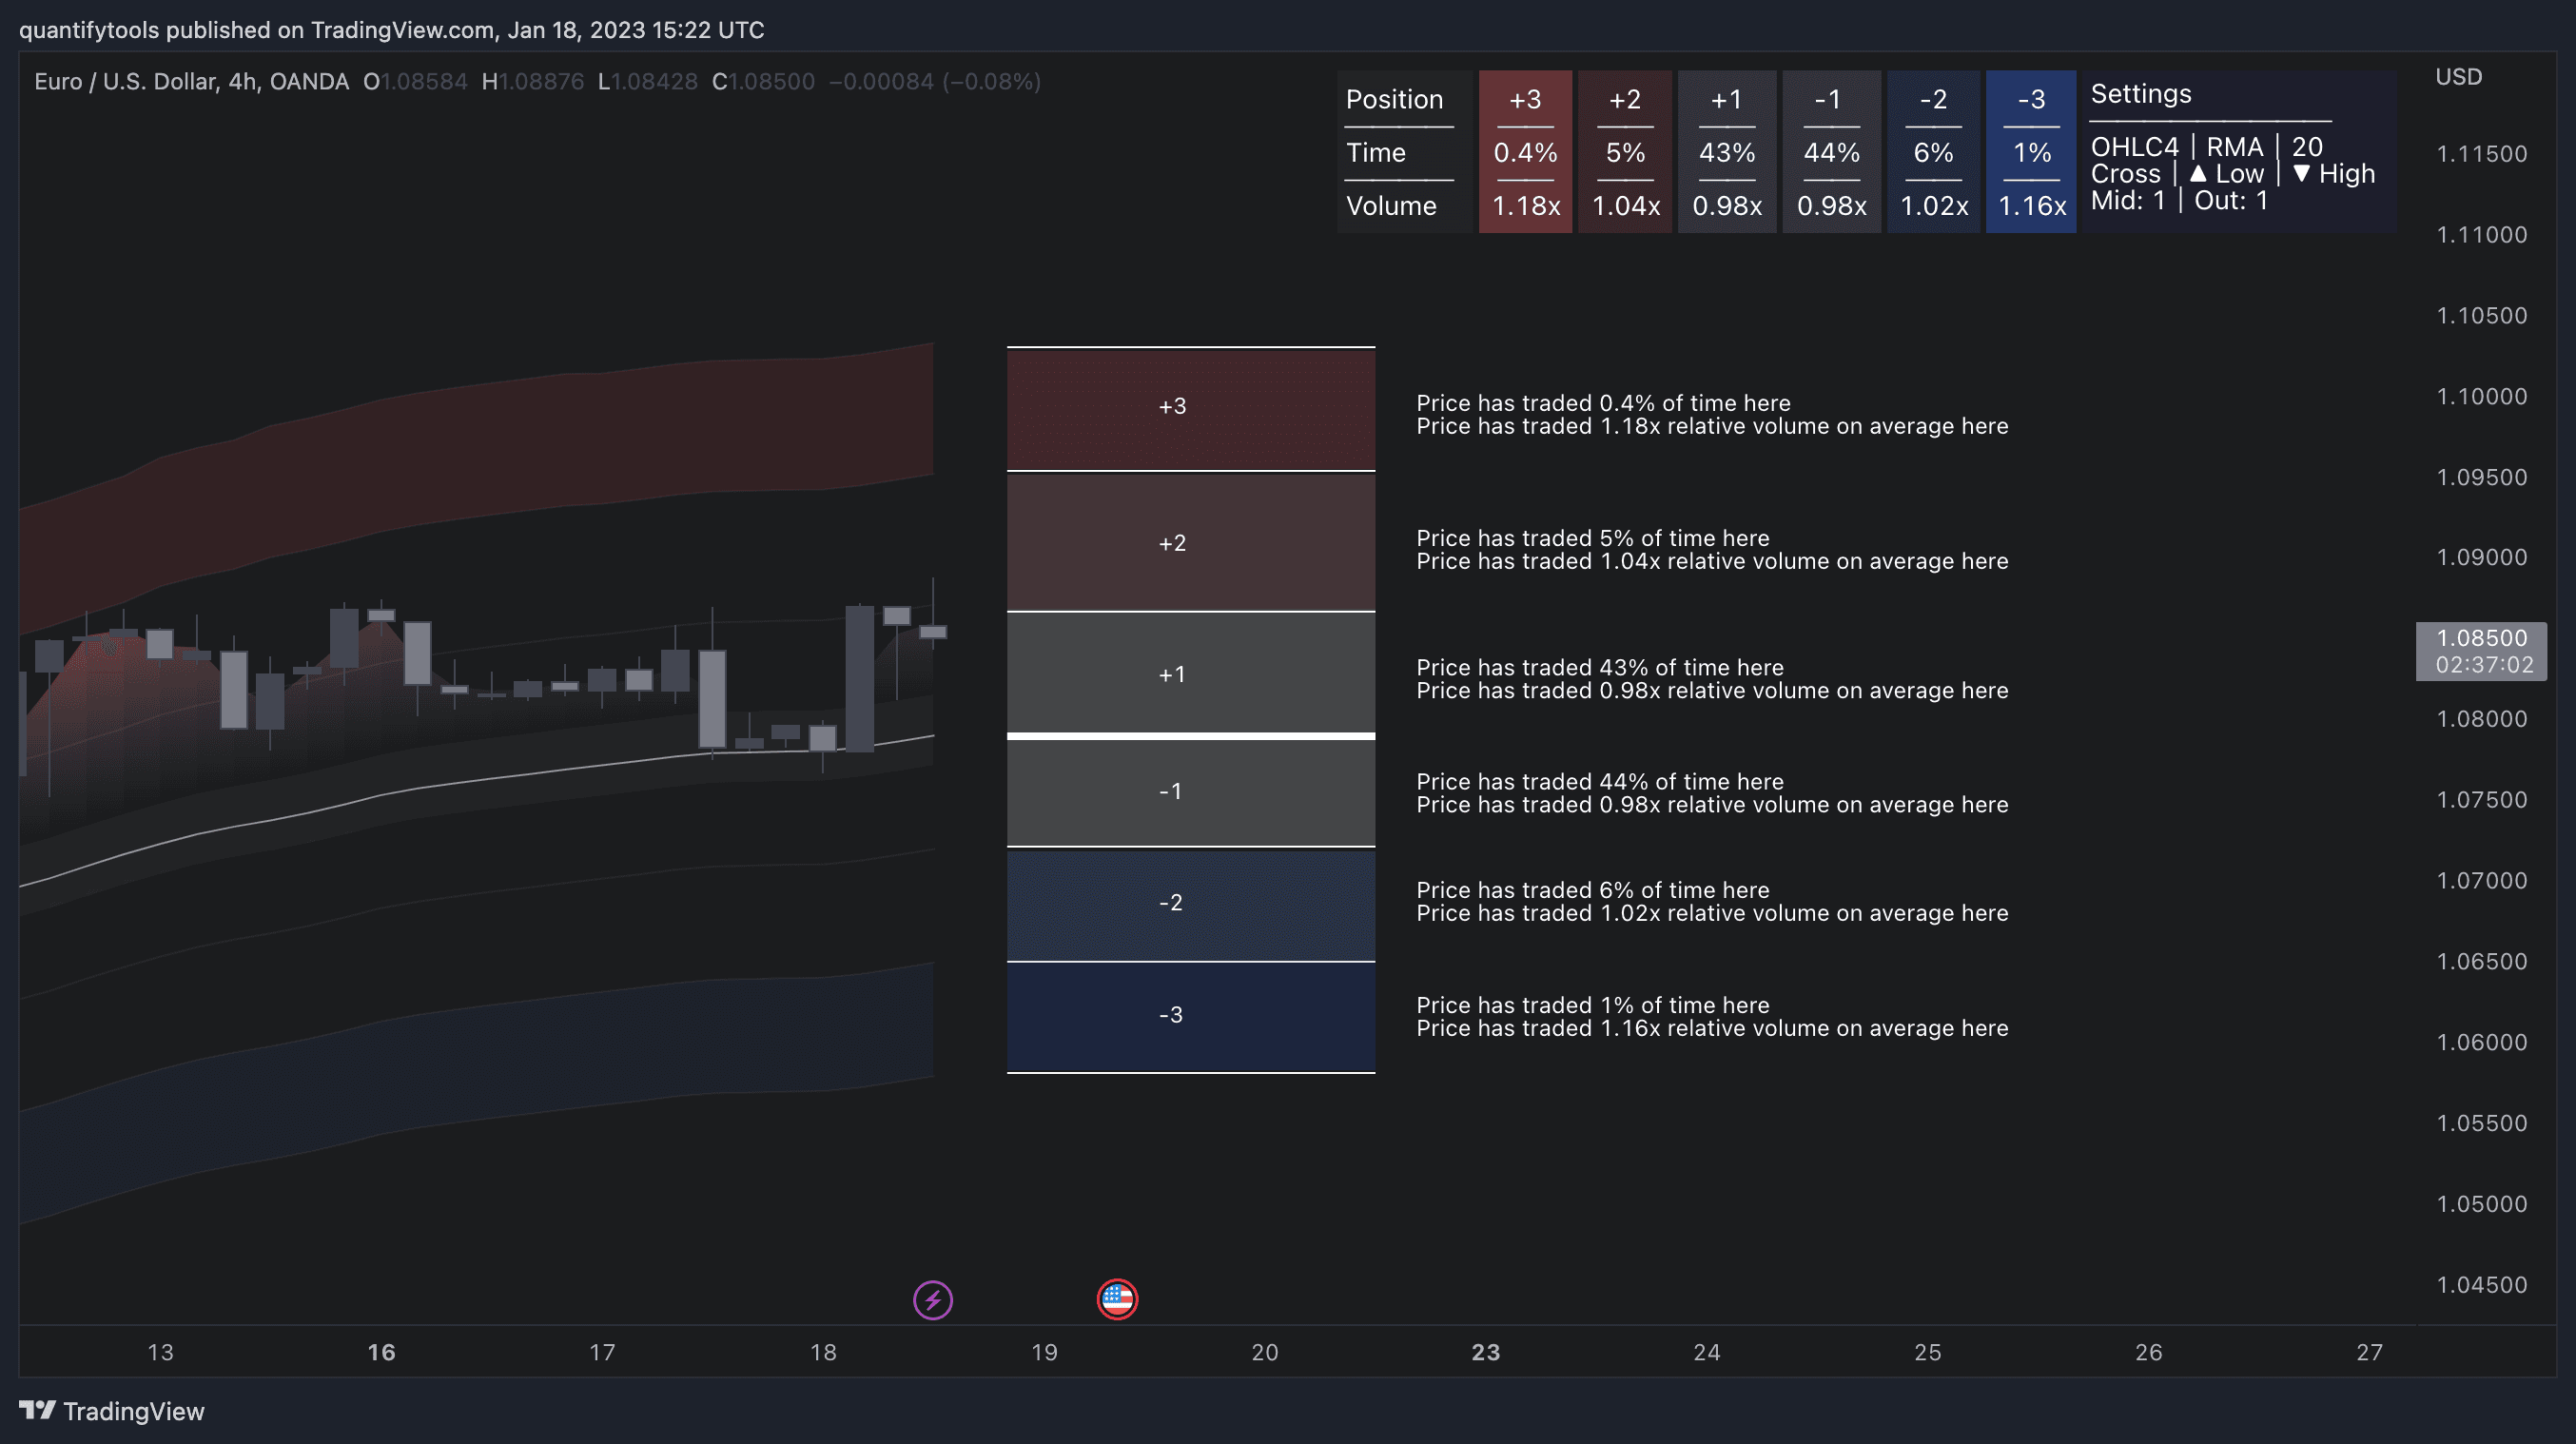
Each band is measured statistically for time and volume traded at them to quantify how normal or abnormal trading at them actually are. Plus values represents risk levels above the middle line and minus the ones below.
Time statistics | Volume statistics |
|---|---|
How often price trades at given band | How much volume is traded at given band |
Expressed as portion of time out of all bands | Expressed as comparison to moving average |
To give an example, a time value of 42% means price spends 42% of the time in that band region. Volume statistic on the other hand is expressed in relative volume terms.
Relative volume tells us how far volume is trading from its moving average. A volume value of 1.2x tells us volume is typically 1.2 times the volume moving average, or simply put 20% higher moving average.
Here's an image example breaking down the statistics for each section of the bands.
Turning data into actionable insights
In practical terms, we can convert this information to expected risk based on evidence.
Fair value, low risk
At -1 and +1 bands, we can assume fair value and low risk. Why? Because price trades there most of the time and volume traded is slightly below average. This is a common occurrence, we can expect price to keep trending steadily higher/lower.
Unfair value, moderate risk
At +2 and -2 time traded is already much more unlikely. We can also tell volume starts being above normal at these levels, indicating deeper liquidity and more resistance. We can expect price to continue trending, but risk of reversal is getting higher.
Extremely unfair value, high risk
At +3 and -3 the odds are extremely unlikely, with price having treaded less than 1% of the time here. Volume is also showing extreme behavior, meaning price is truly grinding against resistance. Here we can expect price to soon reverse.
Reading Fair Value Bands
Fair Value Bands consist of three bands above and below the middle line. Middle line is what we consider to be fair value, a "normal" and expected location for price to trade at.
The further the bands go above middle line (+1 to +3) or below middle line (-1 to -3), the more unfair and extreme the price level is.
Here's an image breaking down each band and their expected risk level and bias for price action.
Time and volume statistics
Each band is measured statistically for time and volume traded at them to quantify how normal or abnormal trading at them actually are. Plus values represents risk levels above the middle line and minus the ones below.
Time statistics | Volume statistics |
|---|---|
How often price trades at given band | How much volume is traded at given band |
Expressed as portion of time out of all bands | Expressed as comparison to moving average |
To give an example, a time value of 42% means price spends 42% of the time in that band region. Volume statistic on the other hand is expressed in relative volume terms.
Relative volume tells us how far volume is trading from its moving average. A volume value of 1.2x tells us volume is typically 1.2 times the volume moving average, or simply put 20% higher moving average.
Here's an image example breaking down the statistics for each section of the bands.
Turning data into actionable insights
In practical terms, we can convert this information to expected risk based on evidence.
Fair value, low risk
At -1 and +1 bands, we can assume fair value and low risk. Why? Because price trades there most of the time and volume traded is slightly below average. This is a common occurrence, we can expect price to keep trending steadily higher/lower.
Unfair value, moderate risk
At +2 and -2 time traded is already much more unlikely. We can also tell volume starts being above normal at these levels, indicating deeper liquidity and more resistance. We can expect price to continue trending, but risk of reversal is getting higher.
Extremely unfair value, high risk
At +3 and -3 the odds are extremely unlikely, with price having treaded less than 1% of the time here. Volume is also showing extreme behavior, meaning price is truly grinding against resistance. Here we can expect price to soon reverse.
Key features of Fair Value Bands
For those seeking more advanced use of the indicator, there are plenty of customization options for tweaking the bands for different use cases and automating finding opportunities. Let's uncover the major ones.
Reversal signals
Users can define price crosses at desired band locations to create visual reversal signals for studying historical price action coinciding with the events.
Fair value calculation
By default, fair value bands uses a simple moving average calculated from past 20 days (or any other chosen timeframe) to form the middle line. Outer bands are then built on top of this calculation, moving at the same pace and sensitivity.
Users can use any calculation length with the indicator with the following smoothing options.
Smoothing options |
|---|
Simple moving average (SMA) |
Exponential moving average (EMA) |
Hull moving average (HMA) |
Relative moving average (RMA) |
Weighted moving average (WMA) |
Volume weighted moving average (VWMA) |
Rolling volume weighted average price (VWAP) |
Median |
Changing the smoothing calculation and calculation length will result in different behavior in the bands, some adjusting slower and some faster depending on the chosen setting.
We will explore how to take advantage of this later on in the article.
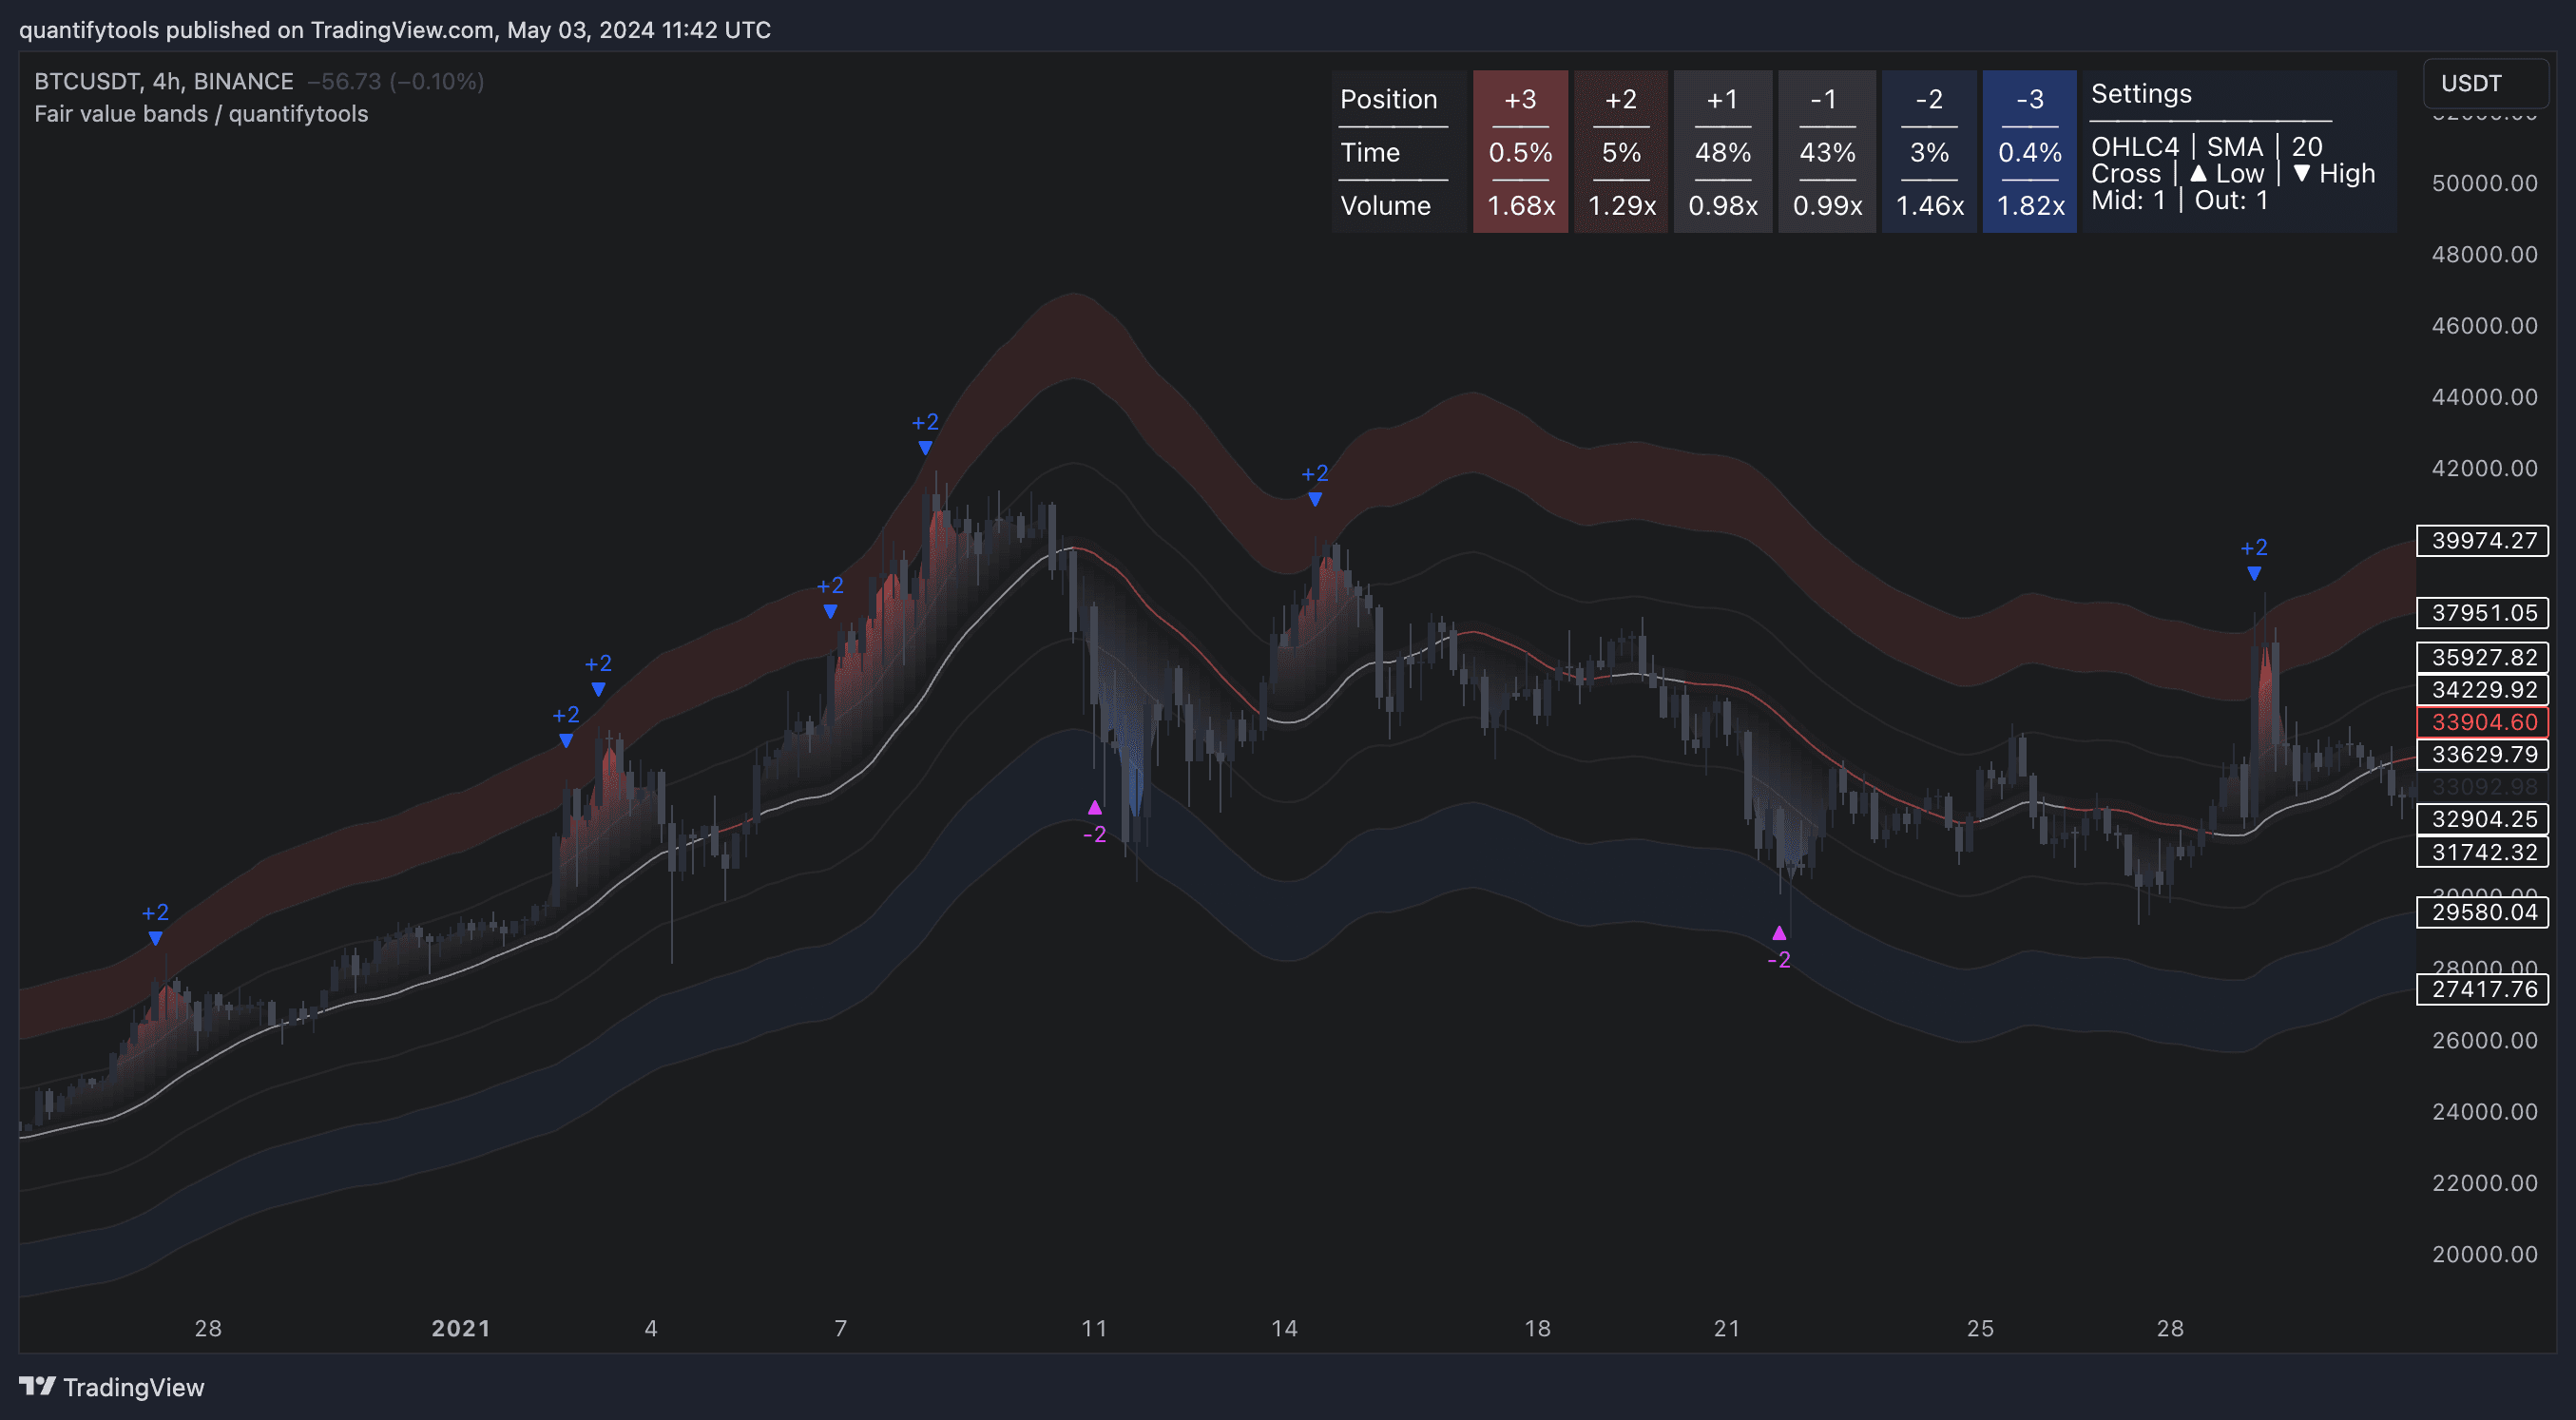
Band calculation
By default, the outer bands are calculated based on typical price deviation from fair value. Users can optionally increase or decrease the width of the bands.
Here's what a standard Fair Value Bands look like, calculated based on 1x typical price deviation.

We can change the typical price deviation from 1x typical to 2x typical, making the bands 2x more wider for gauging more extreme price moves.

Trend mode
Trend mode is purely a visual setting, changing the color of the middle line based on whether price is trading above or below it.
We can switch between two modes: price crossing above/below middle line and direction of middle line moving up/down.
In this example, we can see how on direction based trend mode downtrend is never triggered, but on cross based it is. This can be used for more optimal tracking of trend states with less noise.

Alerts
Users can set alerts for any event on Fair Value Bands, either using a single condition (e.g. price crossing up +2 band) or using a grouped condition such as price crossing either -1 or +1 band.
Key features of Fair Value Bands
For those seeking more advanced use of the indicator, there are plenty of customization options for tweaking the bands for different use cases and automating finding opportunities. Let's uncover the major ones.
Reversal signals
Users can define price crosses at desired band locations to create visual reversal signals for studying historical price action coinciding with the events.
Fair value calculation
By default, fair value bands uses a simple moving average calculated from past 20 days (or any other chosen timeframe) to form the middle line. Outer bands are then built on top of this calculation, moving at the same pace and sensitivity.
Users can use any calculation length with the indicator with the following smoothing options.
Smoothing options |
|---|
Simple moving average (SMA) |
Exponential moving average (EMA) |
Hull moving average (HMA) |
Relative moving average (RMA) |
Weighted moving average (WMA) |
Volume weighted moving average (VWMA) |
Rolling volume weighted average price (VWAP) |
Median |
Changing the smoothing calculation and calculation length will result in different behavior in the bands, some adjusting slower and some faster depending on the chosen setting.
We will explore how to take advantage of this later on in the article.
Band calculation
By default, the outer bands are calculated based on typical price deviation from fair value. Users can optionally increase or decrease the width of the bands.
Here's what a standard Fair Value Bands look like, calculated based on 1x typical price deviation.
We can change the typical price deviation from 1x typical to 2x typical, making the bands 2x more wider for gauging more extreme price moves.
Trend mode
Trend mode is purely a visual setting, changing the color of the middle line based on whether price is trading above or below it.
We can switch between two modes: price crossing above/below middle line and direction of middle line moving up/down.
In this example, we can see how on direction based trend mode downtrend is never triggered, but on cross based it is. This can be used for more optimal tracking of trend states with less noise.
Alerts
Users can set alerts for any event on Fair Value Bands, either using a single condition (e.g. price crossing up +2 band) or using a grouped condition such as price crossing either -1 or +1 band.
How to trade with Fair Value Bands
Fair value bands give dynamic points in price that depict how fair or unfair current price is with risk implications, quantified by the statistics.
This information is useful for predicting in advance what to expect and where. Let's take a look at few practical ways to take advantage of this information.
Risk on/risk off trend following
Ideal trend stays inside fair value and provides sufficient cool offs between the moves. When this is the case, fair value bands can be used for sensible entry/exit levels within the trend.

Detecting reversals using band extremes
When price shows exuberance into an extreme deviation, followed by a stall and signs of exhaustion (wicks), an opportunity for mean reversion emerges. The higher the deviation and volatility, the stronger the potential for exhaustion and reversal.

Tweaking bands for desired behavior
The faster the length of fair value basis, the more momentum price needs to hit extreme deviation levels, as bands too are moving faster alongside price.
Decreasing fair value basis length typically leads to more quick and aggressive deviations and less steady trends outside fair value.
Using slow moving bands
When using slow moving bands, price action near extremes doesn't always lead to reversals.

Using fast moving bands
When using fast moving bands, price action near extremes lead into reversals more often, allowing an easier read. We can see the impact on fair value metrics too.

How to trade with Fair Value Bands
Fair value bands give dynamic points in price that depict how fair or unfair current price is with risk implications, quantified by the statistics.
This information is useful for predicting in advance what to expect and where. Let's take a look at few practical ways to take advantage of this information.
Risk on/risk off trend following
Ideal trend stays inside fair value and provides sufficient cool offs between the moves. When this is the case, fair value bands can be used for sensible entry/exit levels within the trend.
Detecting reversals using band extremes
When price shows exuberance into an extreme deviation, followed by a stall and signs of exhaustion (wicks), an opportunity for mean reversion emerges. The higher the deviation and volatility, the stronger the potential for exhaustion and reversal.
Tweaking bands for desired behavior
The faster the length of fair value basis, the more momentum price needs to hit extreme deviation levels, as bands too are moving faster alongside price.
Decreasing fair value basis length typically leads to more quick and aggressive deviations and less steady trends outside fair value.
Using slow moving bands
When using slow moving bands, price action near extremes doesn't always lead to reversals.
Using fast moving bands
When using fast moving bands, price action near extremes lead into reversals more often, allowing an easier read. We can see the impact on fair value metrics too.
Get Fair Value Bands on TradingView
Fair Value Bands works by simply adding it to your chart on TradingView, no installations or configurations needed.
Open any chart on TradingView and click Indicators tab on top menu.
Search "Flowly" and click an indicator to add to your chart.
Can't find the indicator? Find full guide:
How to add indicators ↗
You can navigate straight to the indicator page here:
Fair value bands on TradingView ↗
But wait… there's more
We have more volume and orderflow indicators for free to use on TradingView.
If you enjoyed this one, you'll enjoy these too (we promise). Find them here 👇


