

Reading Volume Composition
Volume Composition breaks down the volume information by categorizing it into two core types: volume delta (buy/sell volume) and active/passive (rising/falling) volume.
What is volume delta?
Whereas total volume shows net total of buy and sell volume, volume delta shows the difference between the two. Calculating volume delta is simple:
📈 Buy volume - 📉 Sell volume = ⚖️ Volume delta
What’s left is either positive volume delta, indicating buy volume was greater than sell volume or negative volume delta, indicating sell volume was greater than buy volume.
Let's review an example of positive volume delta, where buyers dominate.
Buy volume | Sell volume | Volume delta |
|---|---|---|
5000 stocks | 2000 stocks | +3000 stocks |
In this example, volume delta is negative, indicating the majority of volume comes from sellers. Simple right?
Buy volume | Sell volume | Volume delta |
|---|---|---|
2000 stocks | 5000 stocks | -3000 stocks |
What is active and passive volume?
Active volume simply refers to volume that is increasing and passive volume to one that is decreasing.
This is what active volume looks like, growing, chasing, increasing. The idea behind this volume classification is catch most market order driven volume.
Third volume | Second volume | First volume |
|---|---|---|
1500 stocks (+0%) | 3000 stocks (+100%) | 7000 stocks (+133%) |
And this is what passive volume looks like, stagnating, consolidating, decreasing. The idea behind this volume classification is catch most limit order driven volume.
Third volume | Second volume | First volume |
|---|---|---|
7000 stocks (-0%) | 3000 stocks (-57%) | 1500 stocks (-50%) |
Active and passive volume compliments volume delta by showing which side was trading more aggressively, buyers or sellers.
Reading the volume bars
Volume delta and active/passive volume are displayed for the dominating side that traded more volume - buyers or sellers.
If buy volume was higher than sell volume, that is displayed. If active sell volume was higher than active buy volume, that is displayed.
Let’s look at an image example showing each volume category for the most recent volume bar.

Volume delta is visualized using dark green (buy volume) and dark red (sell volume) bars. Active volume delta can be distinguished by looking for the same colors, but brighter.
The gray bar visualizes total volume, the same way default volume bars do. When volume delta and active/passive volume are laid on top of the gray total bar, we can easily look at the portion of each volume type.
For this volume bar, we can quickly tell buy volume was a bit over half of total volume. Active buy volume on the other hand is a little over half of all buy volume.
We're not handcuffed to just the bars though, we can read the exact proportions from values.
Reading volume values
Below the volume bars we can find the proportion of the volume types expressed in percentage values, color coded the same way volume bars are.
The value above refers to percentage of volume delta. The value below refers to percentage of active volume delta.
Volume delta values | Active volume delta values |
|---|---|
Dark green = buy volume | Bright green = active buy volume |
Dark red = sell volume | Bright red = active sell volume |
Located on above row | Located on below row |
Here's an image breakdown of each value, indication and their signification in Volume Composition.

On top, there's a few extra indications - plus/minus, brackets, arrow symbols and diamond symbols. Here's how to read them.
Plus/minus | Located between volume values. Indicates direction of active volume delta. |
|---|---|
Brackets | Located at plus/minus symbol. Indicates divergence in dominating volume delta and dominating active volume delta. |
Arrows | Located right at bottom of volume values. Indicates when active volume delta threshold has been exceeded. |
Diamond | Located right at top of volume bars. Indicates when volume delta threshold has been exceeded. |
Reading Volume Composition
Volume Composition breaks down the volume information by categorizing it into two core types: volume delta (buy/sell volume) and active/passive (rising/falling) volume.
What is volume delta?
Whereas total volume shows net total of buy and sell volume, volume delta shows the difference between the two. Calculating volume delta is simple:
📈 Buy volume - 📉 Sell volume = ⚖️ Volume delta
What’s left is either positive volume delta, indicating buy volume was greater than sell volume or negative volume delta, indicating sell volume was greater than buy volume.
Let's review an example of positive volume delta, where buyers dominate.
Buy volume | Sell volume | Volume delta |
|---|---|---|
5000 stocks | 2000 stocks | +3000 stocks |
In this example, volume delta is negative, indicating the majority of volume comes from sellers. Simple right?
Buy volume | Sell volume | Volume delta |
|---|---|---|
2000 stocks | 5000 stocks | -3000 stocks |
What is active and passive volume?
Active volume simply refers to volume that is increasing and passive volume to one that is decreasing.
This is what active volume looks like, growing, chasing, increasing. The idea behind this volume classification is catch most market order driven volume.
Third volume | Second volume | First volume |
|---|---|---|
1500 stocks (+0%) | 3000 stocks (+100%) | 7000 stocks (+133%) |
And this is what passive volume looks like, stagnating, consolidating, decreasing. The idea behind this volume classification is catch most limit order driven volume.
Third volume | Second volume | First volume |
|---|---|---|
7000 stocks (-0%) | 3000 stocks (-57%) | 1500 stocks (-50%) |
Active and passive volume compliments volume delta by showing which side was trading more aggressively, buyers or sellers.
Reading the volume bars
Volume delta and active/passive volume are displayed for the dominating side that traded more volume - buyers or sellers.
If buy volume was higher than sell volume, that is displayed. If active sell volume was higher than active buy volume, that is displayed.
Let’s look at an image example showing each volume category for the most recent volume bar.
Volume delta is visualized using dark green (buy volume) and dark red (sell volume) bars. Active volume delta can be distinguished by looking for the same colors, but brighter.
The gray bar visualizes total volume, the same way default volume bars do. When volume delta and active/passive volume are laid on top of the gray total bar, we can easily look at the portion of each volume type.
For this volume bar, we can quickly tell buy volume was a bit over half of total volume. Active buy volume on the other hand is a little over half of all buy volume.
We're not handcuffed to just the bars though, we can read the exact proportions from values.
Reading volume values
Below the volume bars we can find the proportion of the volume types expressed in percentage values, color coded the same way volume bars are.
The value above refers to percentage of volume delta. The value below refers to percentage of active volume delta.
Volume delta values | Active volume delta values |
|---|---|
Dark green = buy volume | Bright green = active buy volume |
Dark red = sell volume | Bright red = active sell volume |
Located on above row | Located on below row |
Here's an image breakdown of each value, indication and their signification in Volume Composition.
On top, there's a few extra indications - plus/minus, brackets, arrow symbols and diamond symbols. Here's how to read them.
Plus/minus | Located between volume values. Indicates direction of active volume delta. |
|---|---|
Brackets | Located at plus/minus symbol. Indicates divergence in dominating volume delta and dominating active volume delta. |
Arrows | Located right at bottom of volume values. Indicates when active volume delta threshold has been exceeded. |
Diamond | Located right at top of volume bars. Indicates when volume delta threshold has been exceeded. |
Key features of Volume Composition
Volume Composition is packed with bunch of useful features for studying volume more in-depth and automating finding opportunities. Let's cover the major ones.
Relative volume
Volume Composition can be used to display a normalized way to read volume, known as relative volume. Relative volume is a simple way to gauge how extreme volume is by comparing how closely it trades to volume moving average.
Here's how relative volume looks like on Volume Composition.
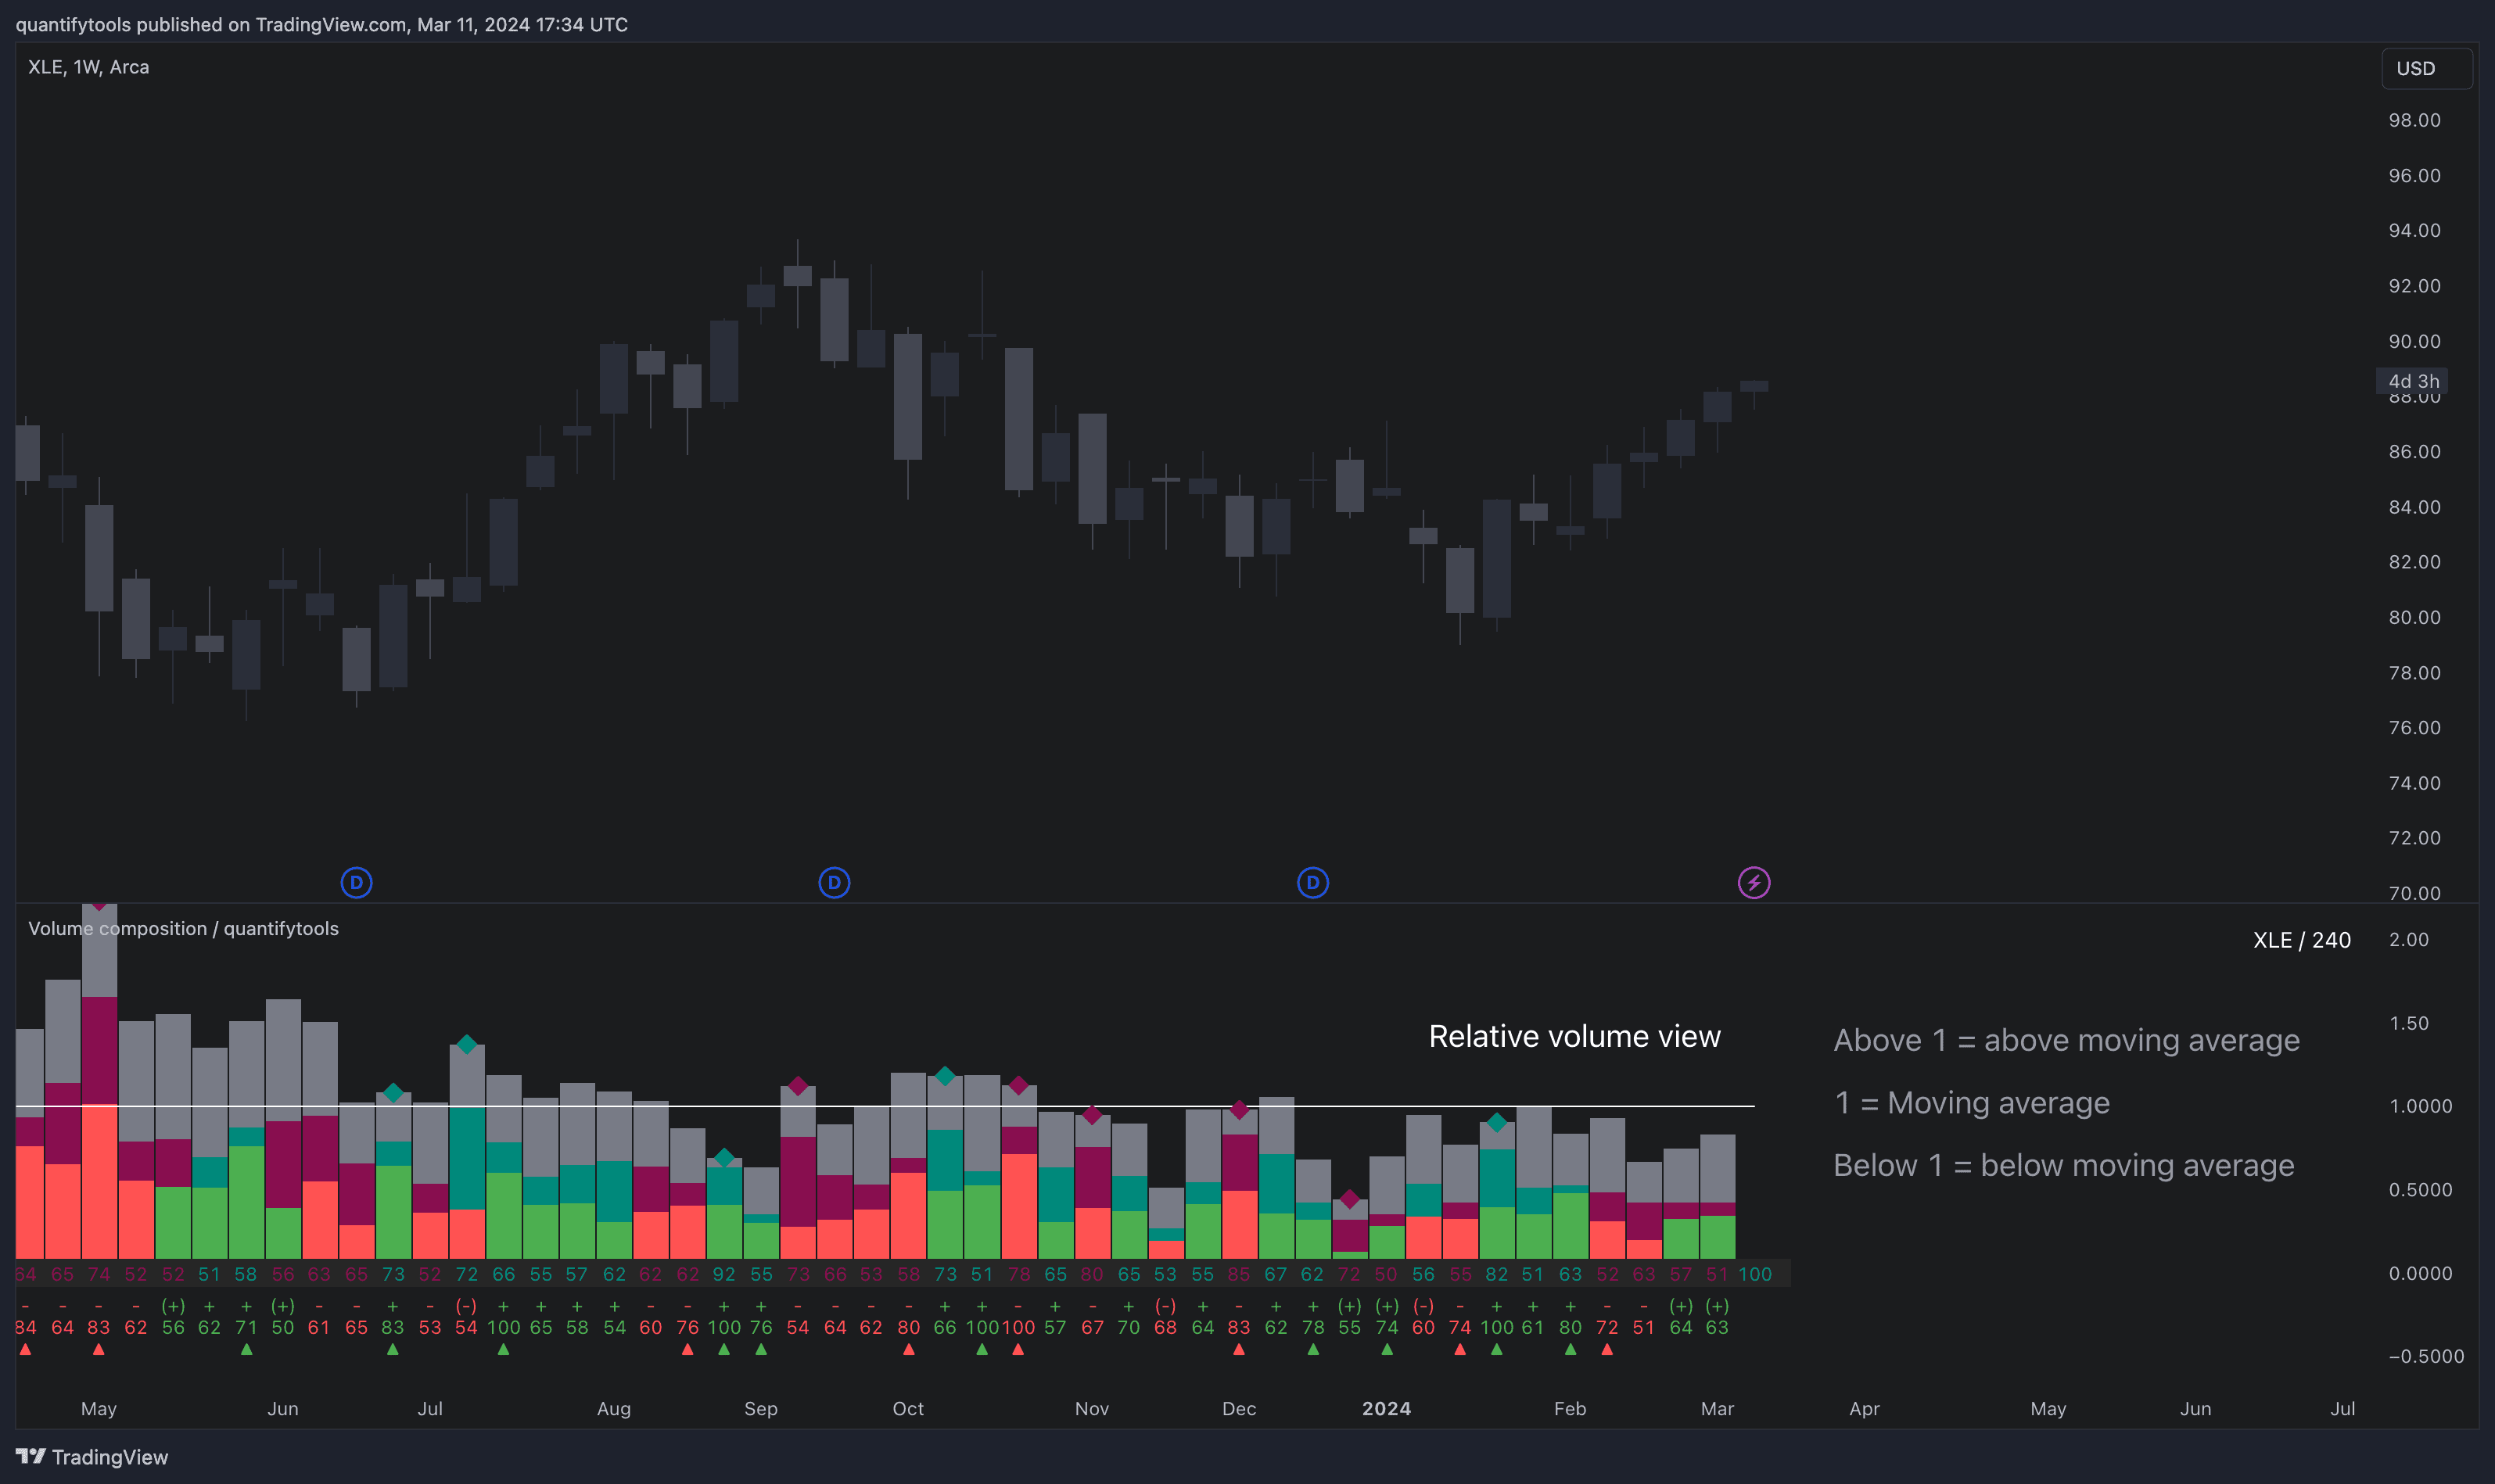
Value of 1 represents volume being equal to volume moving average. Any value below that is means less than average, which can be interpreted as normal/not significant.
The opposite is true for values above 1. For example, a value of 2 represents volume being two times higher than average. This is a significant deviation and can be read as extreme volume.
Volume anomalies
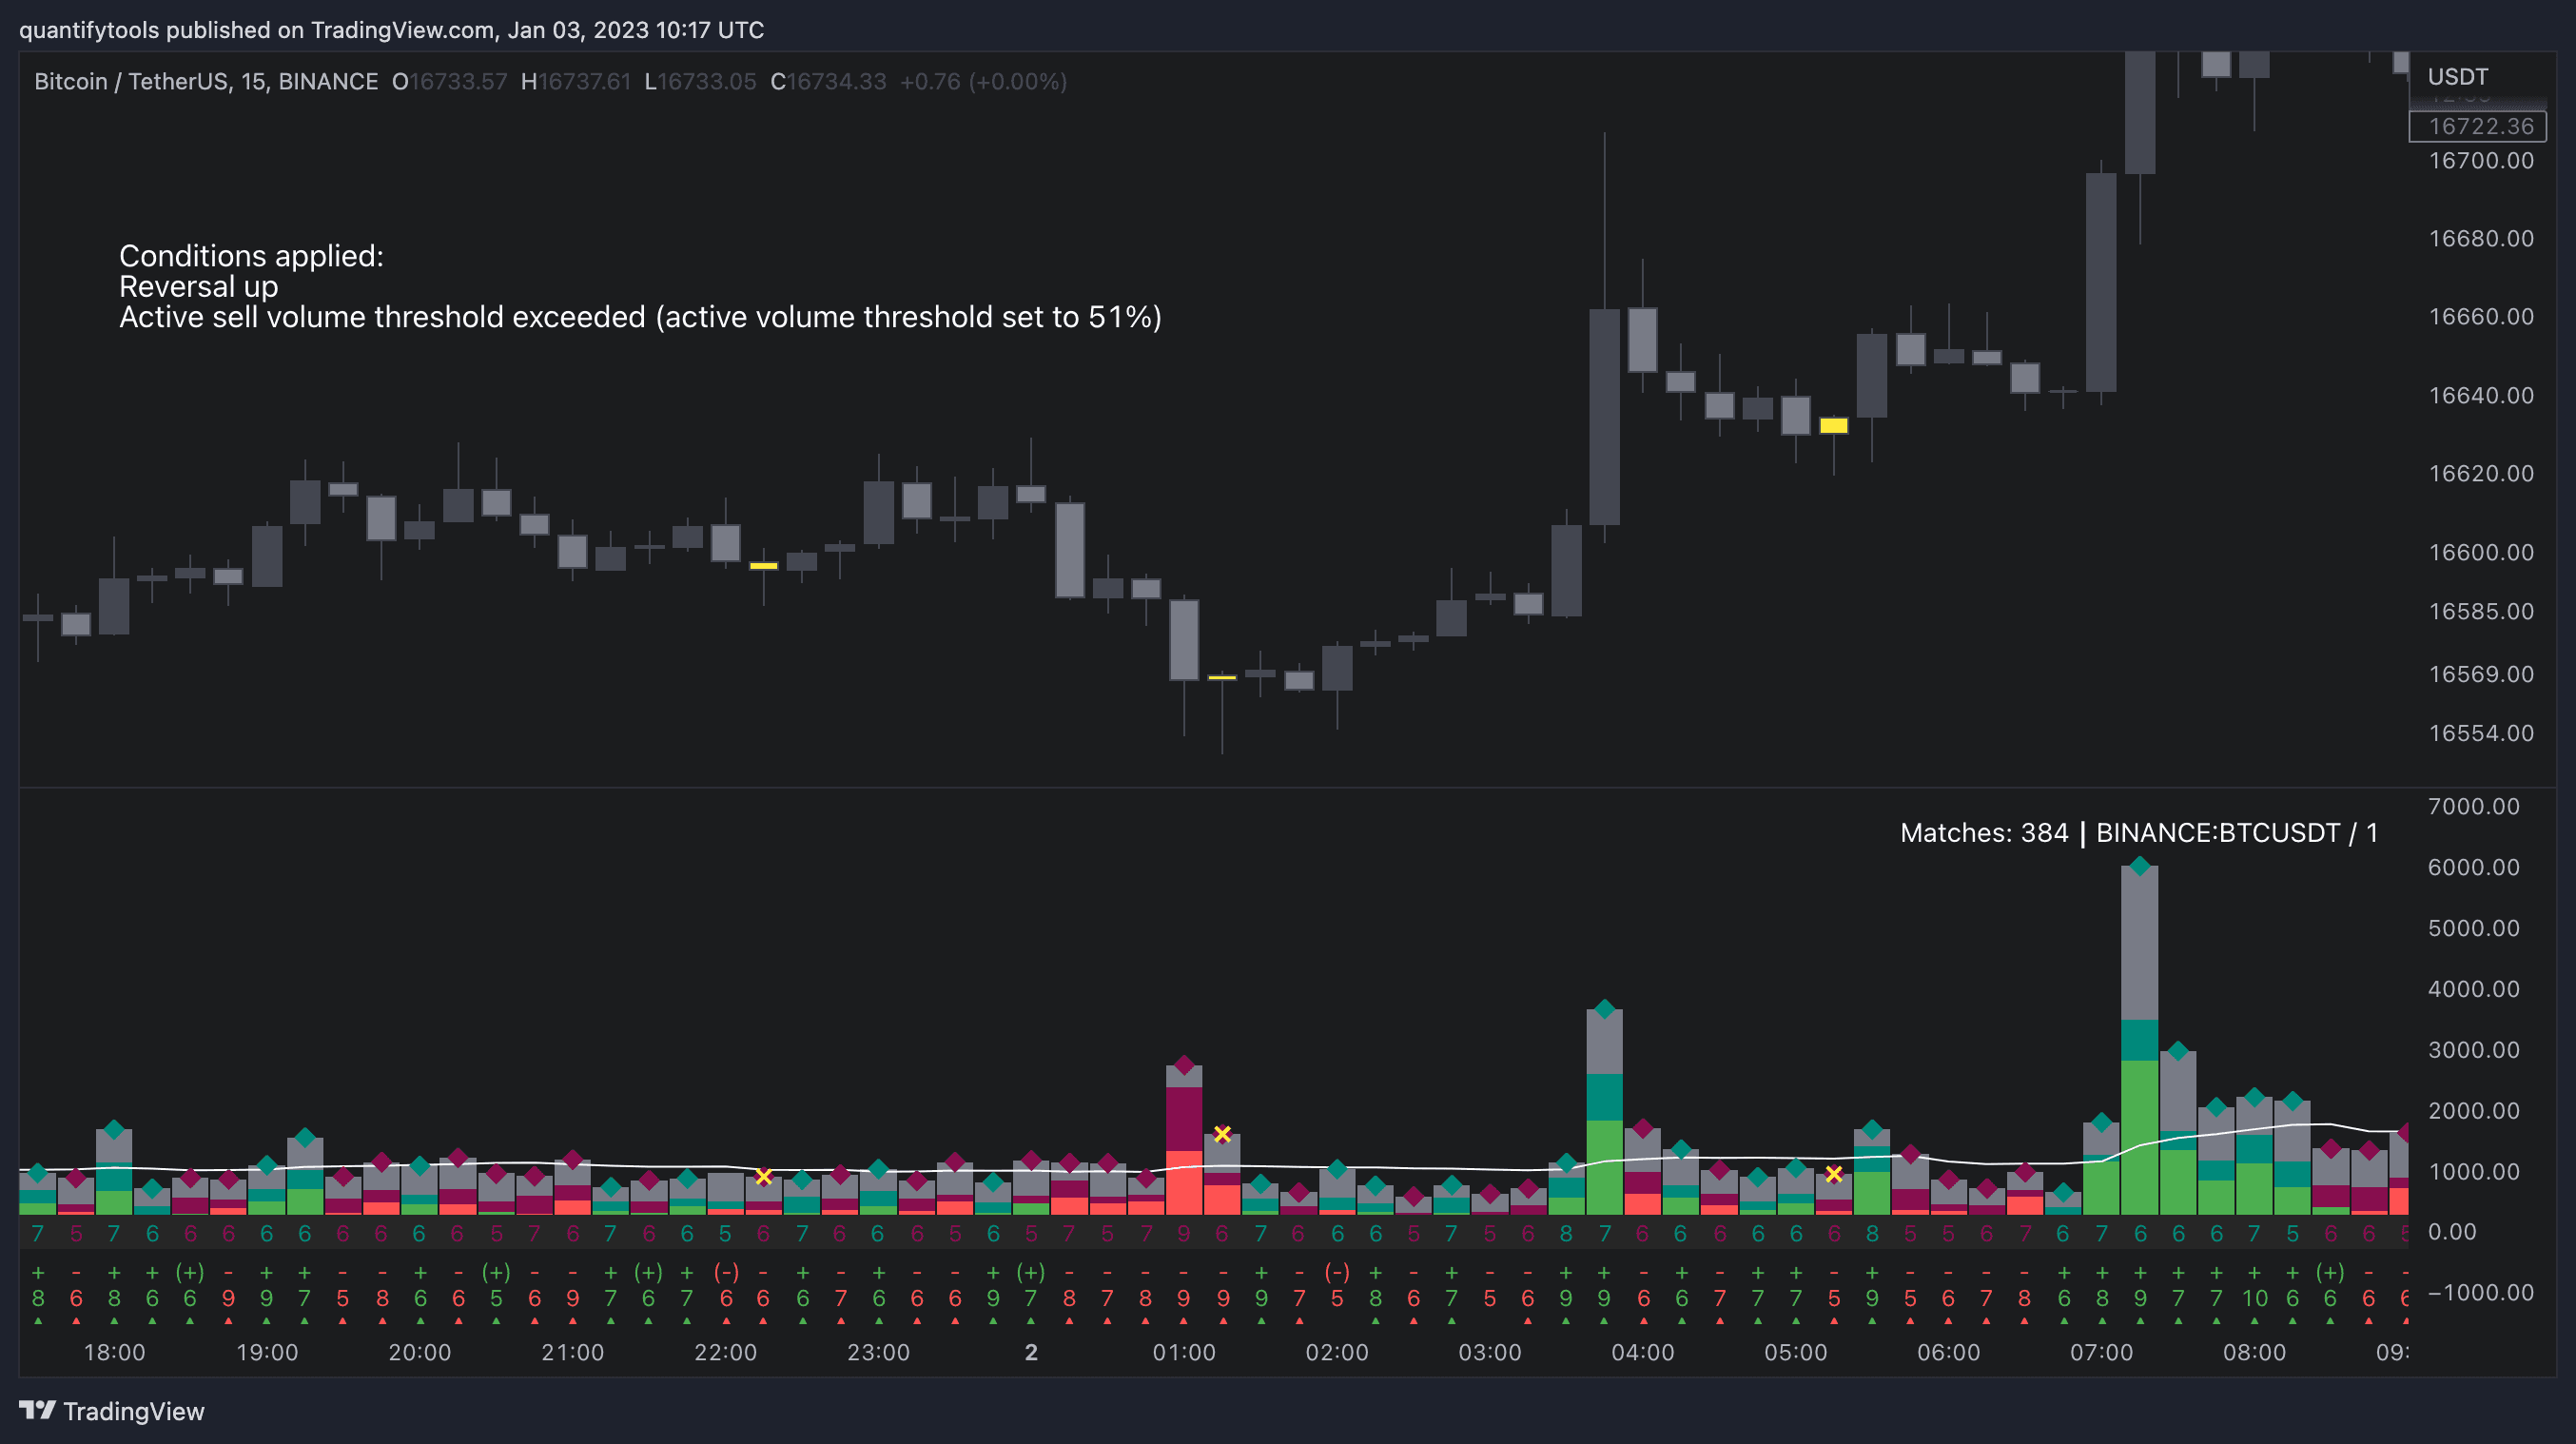
Volume Composition let’s us highlight volume anomalies on the chart with a color for studying the price impact of the events in greater detail.
We can set conditions in the settings menu that will be visually highlighted on the chart, such as buy volume being above 70% or active sell volume being above 60%.
This feature is great for studying historical volume anomalies and how the price behaved when they occurred.

The volume anomaly highlighter can also be combined with price based conditions, such as volume event coinciding with reversal candles, expansion candles and any up/down moves.
Here is a full list of all available conditions for volume anomaly highlights. They can be used on their own and by combining multiple into one.
Volume based | Price based |
|---|---|
Buy volume above user set value | Move up |
Active buy volume above user set value | Move down |
Sell volume above user set value | Reversal up |
Active sell volume above user set value | Reversal down |
Relative volume above user set value | Expansion up |
Volume/active volume divergence | Expansion down |
Alerts
Any event available in volume anomaly highlights can be used for alerts. Users can get alerted for any single event (e.g. buy volume above 70%) or grouping multiple into one (e.g. buy volume above 70% + reversal candle).
Key features of Volume Composition
Volume Composition is packed with bunch of useful features for studying volume more in-depth and automating finding opportunities. Let's cover the major ones.
Relative volume
Volume Composition can be used to display a normalized way to read volume, known as relative volume. Relative volume is a simple way to gauge how extreme volume is by comparing how closely it trades to volume moving average.
Here's how relative volume looks like on Volume Composition.
Value of 1 represents volume being equal to volume moving average. Any value below that is means less than average, which can be interpreted as normal/not significant.
The opposite is true for values above 1. For example, a value of 2 represents volume being two times higher than average. This is a significant deviation and can be read as extreme volume.
Volume anomalies
Volume Composition let’s us highlight volume anomalies on the chart with a color for studying the price impact of the events in greater detail.
We can set conditions in the settings menu that will be visually highlighted on the chart, such as buy volume being above 70% or active sell volume being above 60%.
This feature is great for studying historical volume anomalies and how the price behaved when they occurred.
The volume anomaly highlighter can also be combined with price based conditions, such as volume event coinciding with reversal candles, expansion candles and any up/down moves.
Here is a full list of all available conditions for volume anomaly highlights. They can be used on their own and by combining multiple into one.
Volume based | Price based |
|---|---|
Buy volume above user set value | Move up |
Active buy volume above user set value | Move down |
Sell volume above user set value | Reversal up |
Active sell volume above user set value | Reversal down |
Relative volume above user set value | Expansion up |
Volume/active volume divergence | Expansion down |
Alerts
Any event available in volume anomaly highlights can be used for alerts. Users can get alerted for any single event (e.g. buy volume above 70%) or grouping multiple into one (e.g. buy volume above 70% + reversal candle).
How to trade with Volume Composition
Volume is arguably one of the most important data points as it directly relates to liquidity.
High volume can be an indication of strength (price likely to continue moving) or absorption (price likely to halt/turn).
Same applies to active volume, but with an element of aggression, indicating exuberance or otherwise forceful transacting, like stop losses triggering.
With these principles in mind, the composition of volume allows distinguishing potentially important events.
Let’s go over a few with practical examples.
Detecting trapped traders using volume spikes
Often when volume spikes distinctively, we can make the case that price has found sufficient liquidity to halt/turn.
Since we know which side was absorbed, in what quantity and type (passive/active), we can identify areas of trapped market participants.
The higher the dominant active volume and volume spike itself, the better.

Riding active volume driven trends
A healthy trend is one that has an active and consistent bid driving it. When this is the case, it can be seen in consistently supportive active volume.

Detecting inflection points with contradicting volumes
When dominant side of volume and dominant side of active volume diverge, something is up. A divergence often marks an area of indecision, hinting an imminent move one way or the other.

How to trade with Volume Composition
Volume is arguably one of the most important data points as it directly relates to liquidity.
High volume can be an indication of strength (price likely to continue moving) or absorption (price likely to halt/turn).
Same applies to active volume, but with an element of aggression, indicating exuberance or otherwise forceful transacting, like stop losses triggering.
With these principles in mind, the composition of volume allows distinguishing potentially important events.
Let’s go over a few with practical examples.
Detecting trapped traders using volume spikes
Often when volume spikes distinctively, we can make the case that price has found sufficient liquidity to halt/turn.
Since we know which side was absorbed, in what quantity and type (passive/active), we can identify areas of trapped market participants.
The higher the dominant active volume and volume spike itself, the better.
Riding active volume driven trends
A healthy trend is one that has an active and consistent bid driving it. When this is the case, it can be seen in consistently supportive active volume.
Detecting inflection points with contradicting volumes
When dominant side of volume and dominant side of active volume diverge, something is up. A divergence often marks an area of indecision, hinting an imminent move one way or the other.
Get Volume Composition on TradingView
Volume Composition works by simply adding it to your chart on TradingView, no installations or configurations needed.
Open any chart on TradingView and click Indicators tab on top menu.
Search "Flowly" and click an indicator to add to your chart.
Can't find the indicator? Find full guide:
How to add indicators ↗
You can navigate straight to the indicator page here:
Volume composition on TradingView ↗
But wait… there's more
We have more volume and orderflow indicators for free to use on TradingView.
If you enjoyed this one, you'll enjoy these too (we promise). Find them here 👇


