AI summary
AI summary
AI summary
This guide demonstrates how to add indicators on TradingView charts. Open any chart, click the Indicators tab at the top menu and search for "Flowly Indicators" to find all our tools.
This guide demonstrates how to add indicators on TradingView charts. Open any chart, click the Indicators tab at the top menu and search for "Flowly Indicators" to find all our tools.
This guide demonstrates how to add indicators on TradingView charts. Open any chart, click the Indicators tab at the top menu and search for "Flowly Indicators" to find all our tools.
How to add Indicators on TradingView
How to add Indicators on TradingView
How to add Indicators on TradingView
How to navigate with indicators
How to navigate with indicators
How to navigate with indicators
🛠️
🛠️
🛠️

Flowly Team
Flowly Team
0 min read
0 min read
Share
How to find TradingView Indicators
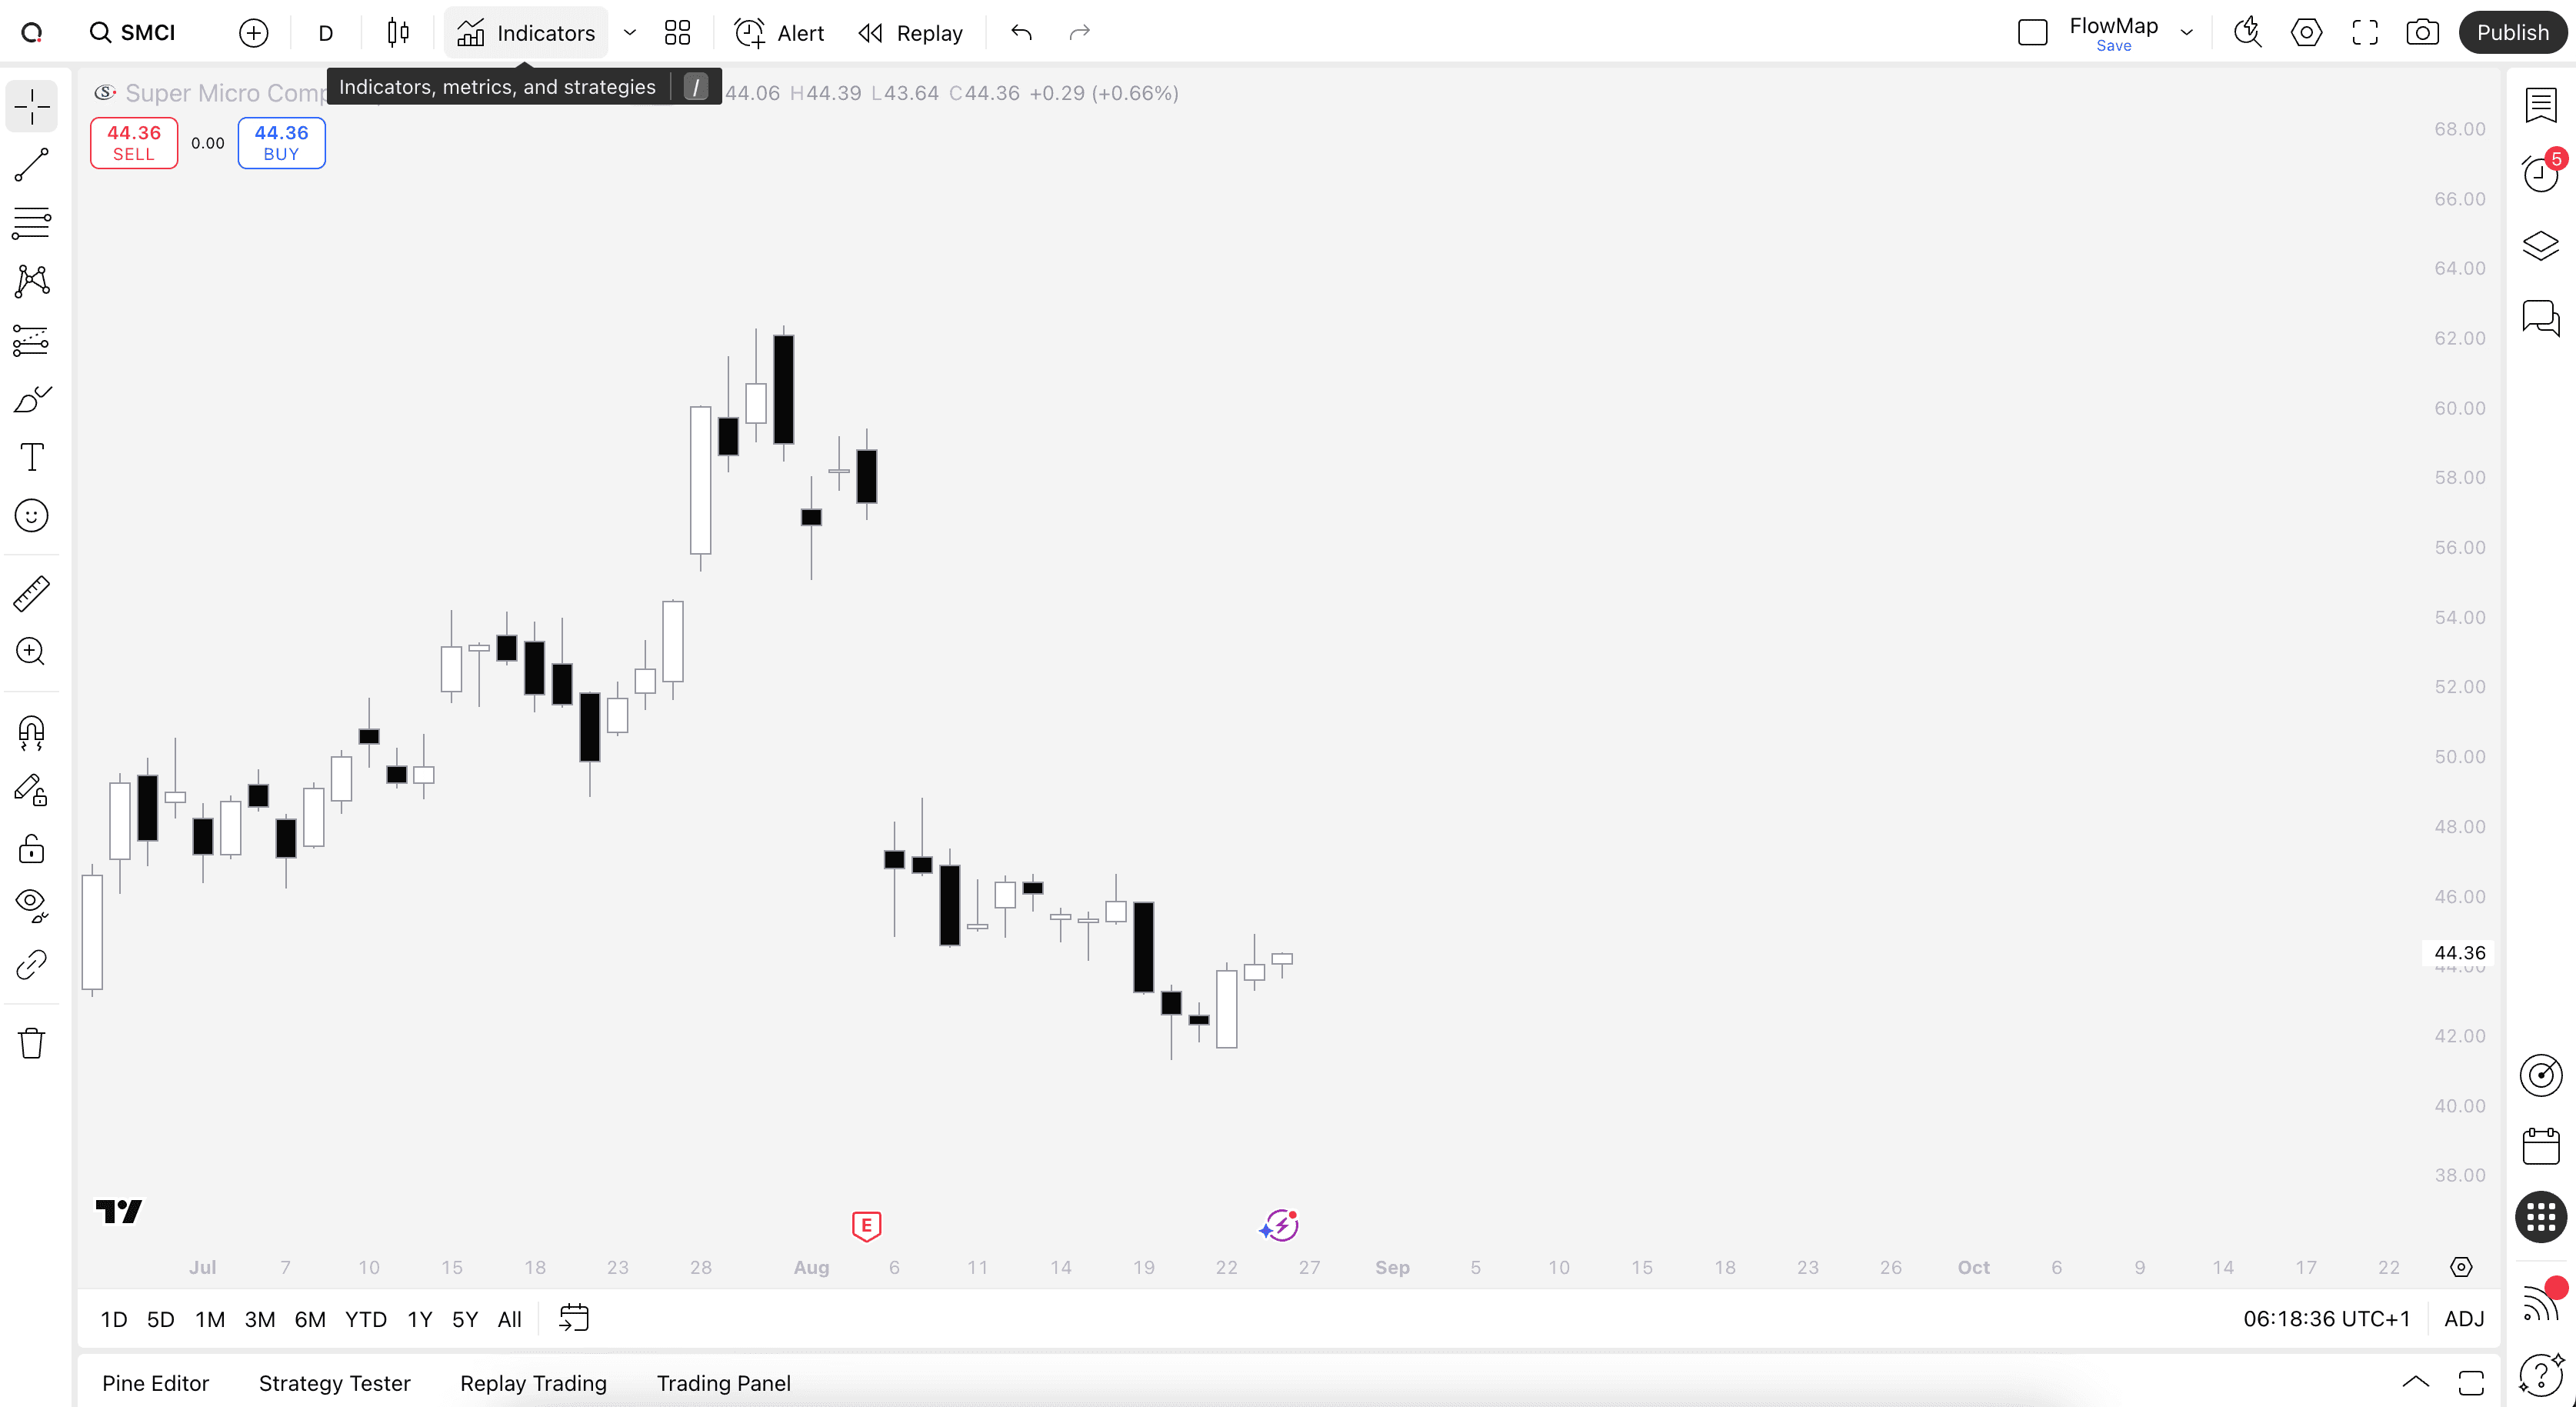
Find TradingView indicators easily by opening up any chart on TradingView (e.g. TSLA) and clicking Indicators tab on top menu.
Here you can search for all available TradingView indicator library and add them directly to your chart. To find our tools, search "Flowly Indicators".
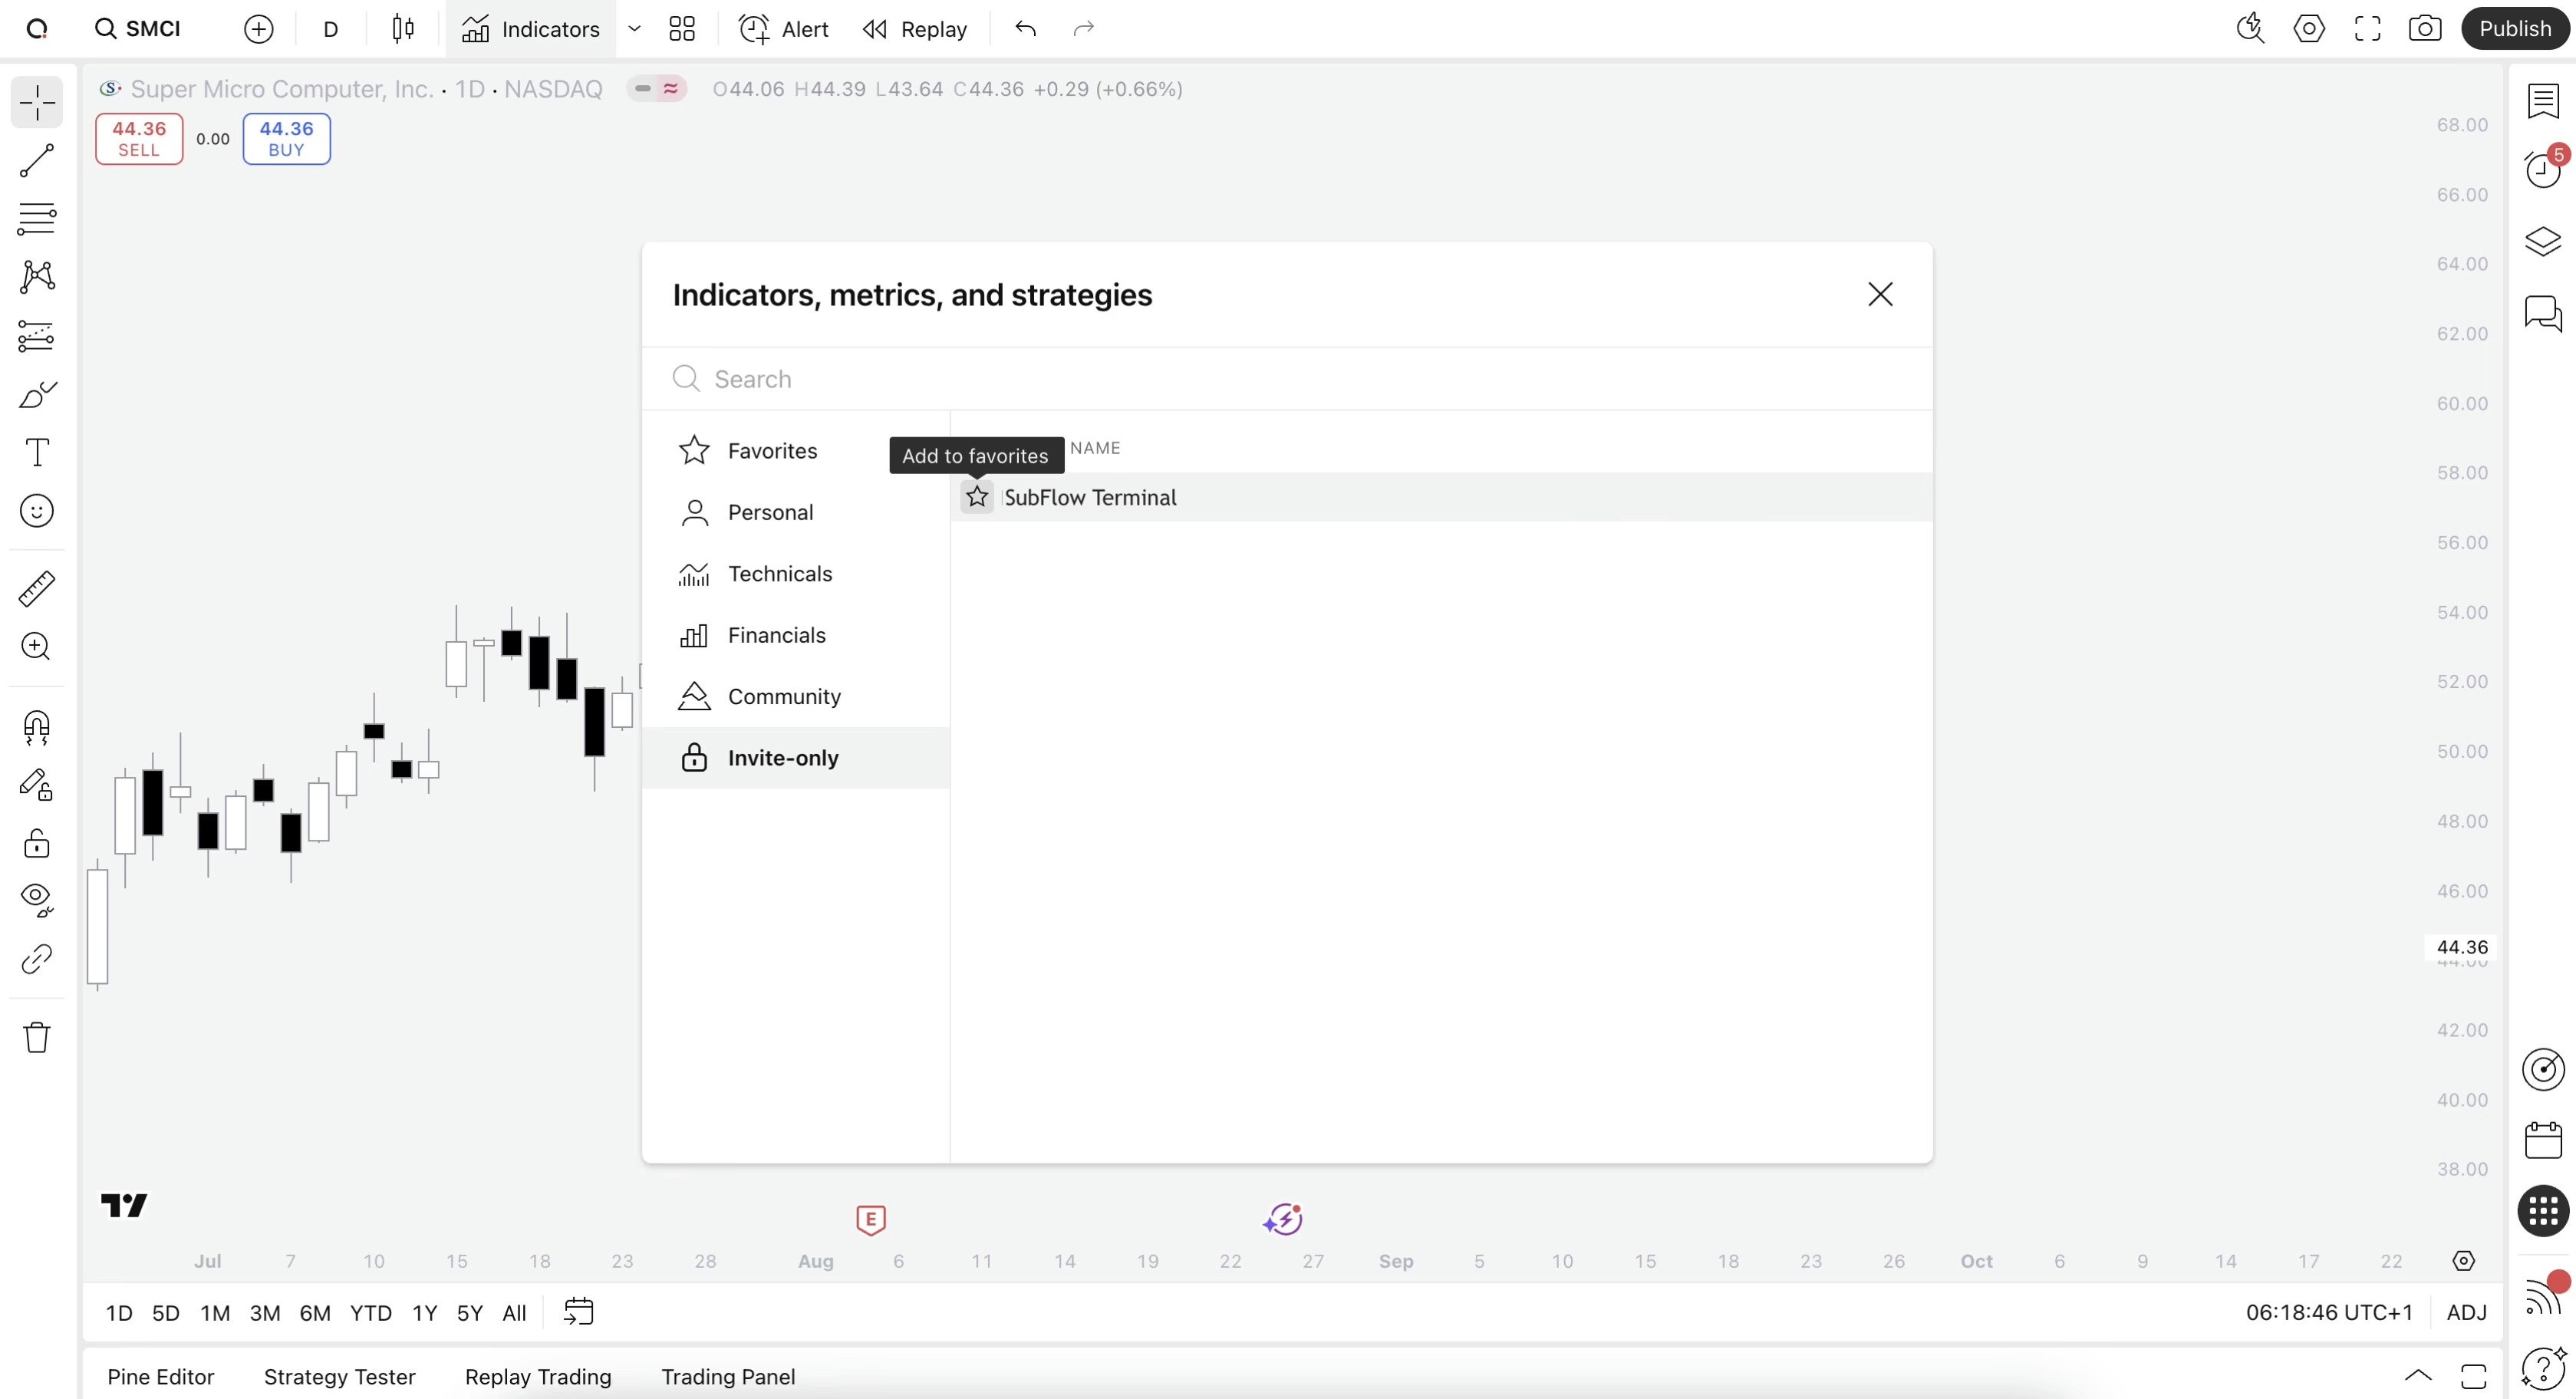
To find SubFlow Terminal, head to Invite-only scripts on the menu and select SubFlow Terminal to add to your chart. Make sure to favorite SubFlow Terminal to get update notifications by starring it.
How to find TradingView Indicators
Find TradingView indicators easily by opening up any chart on TradingView (e.g. TSLA) and clicking Indicators tab on top menu.
Here you can search for all available TradingView indicator library and add them directly to your chart. To find our tools, search "Flowly Indicators".
To find SubFlow Terminal, head to Invite-only scripts on the menu and select SubFlow Terminal to add to your chart. Make sure to favorite SubFlow Terminal to get update notifications by starring it.
🤖
🤖
Indicators
Indicators
TradingView Indicators
TradingView Indicators

TradingView Orderflow Indicator: SubFlow Terminal
Orderflow
Premium
SubFlow Terminal is an orderflow indicator for TradingView featuring liquidity heatmaps, value area, point of control, liquidations, manipulations and backtesting.

TradingView Price Action Indicator: Imbalances
Price Action
Imbalances is a TradingView indicator highlighting areas of inefficient and one sided transacting, prone to filling sooner or later.

TradingView Volume Indicator: Volume Composition
Orderflow
Free
Volume composition is a TradingView volume indicator breaking volume down into volume delta, active/passive volume, relative volume and more.

TradingView Band Indicator: Fair Value Bands
Orderflow
Free
Fair value bands is a TradingView band indicator that displays dynamic risk levels and metrics for assessing liquidity traded at them.

TradingView Orderflow Indicator: Time & Volume POC
Orderflow
Free
Time & volume POC is a TradingView orderflow indicator that displays Time Point of Control (TPOC) and Volume Point of Control (VPOC) for each candle.

TradingView Orderflow Indicator: Open Interest Flow
Orderflow
Free
Open interest flow is a TradingView orderflow indicator displays long/short inflows and outflows using open interest and displays their magnitude in an easy-to-read way.
Load More
TradingView Orderflow Indicator: SubFlow Terminal
Orderflow
Premium
SubFlow Terminal is an orderflow indicator for TradingView featuring liquidity heatmaps, value area, point of control, liquidations, manipulations and backtesting.
TradingView Price Action Indicator: Imbalances
Price Action
Imbalances is a TradingView indicator highlighting areas of inefficient and one sided transacting, prone to filling sooner or later.
TradingView Volume Indicator: Volume Composition
Orderflow
Free
Volume composition is a TradingView volume indicator breaking volume down into volume delta, active/passive volume, relative volume and more.
Load More
🗞️
🗞️
Articles
Articles
Good reads on markets
Good reads on markets

TradingView Volume Footprint: Complete Guide for 2026
Orderflow
⏱️ 9 min
Learn how to use and trade TradingView's Volume Footprint - POC, Value Area, templates, settings and an honest look at whether it's worth TradingView Premium.

Introducing enhanced backtesting for Subflow Terminal
Update
⏱️ 3 min
SubFlow Terminal gets new backtesting features. Create custom backtests on selected time range, test short and long term performance and read results in a human friendly way.

Is TradingView orderflow accurate?
Orderflow
⏱️ 8 min
Is TradingView's orderflow accurate enough to trade with? Breaking down how the data is calculated, what you can trust and where native platforms still win.

quantify.tools is now Flowly Indicators
Announcement
⏱️ 4 min
We are now called Flowly Indicators. A new phase in quantified indicators, firmly rooted in theory of volume and orderflow. Here's our journey.
TradingView Volume Footprint: Complete Guide for 2026
Orderflow
⏱️ 9 min
Learn how to use and trade TradingView's Volume Footprint - POC, Value Area, templates, settings and an honest look at whether it's worth TradingView Premium.
Introducing enhanced backtesting for Subflow Terminal
Update
⏱️ 3 min
SubFlow Terminal gets new backtesting features. Create custom backtests on selected time range, test short and long term performance and read results in a human friendly way.
Is TradingView orderflow accurate?
Orderflow
⏱️ 8 min
Is TradingView's orderflow accurate enough to trade with? Breaking down how the data is calculated, what you can trust and where native platforms still win.
Load More
Flowly Indicators
See through trading charts with orderflow
FlowLetter
Stay in loop
Sign up

Disclaimer
We are an independent script vendor on TradingView and have no affiliation with them. All content provided by us are strictly for educational purposes and should not be construed as financial advice.
Hypothetical or simulated performance shown does not represent actual trading and past results do not guarantee future performance. By using our content for decision making, you do it at your own risk and fully acknowledge that you alone are responsible for your own research and financial decisions.
© 2026 Flowly Indicators. All rights reserved.
Flowly Indicators
See through trading charts with orderflow
FlowLetter
Stay in loop
Sign up
Disclaimer
We are an independent script vendor on TradingView and have no affiliation with them. All content provided by us are strictly for educational purposes and should not be construed as financial advice.
Hypothetical or simulated performance shown does not represent actual trading and past results do not guarantee future performance. By using our content for decision making, you do it at your own risk and fully acknowledge that you alone are responsible for your own research and financial decisions.
© 2026 Flowly Indicators. All rights reserved.
Flowly Indicators
See through trading charts with orderflow
Join FlowLetter
Disclaimer
We are an independent script vendor on TradingView and have no affiliation with them. All content provided by us are strictly for educational purposes and should not be construed as financial advice.
Hypothetical or simulated performance shown does not represent actual trading and past results do not guarantee future performance. By using our content for decision making, you do it at your own risk and fully acknowledge that you alone are responsible for your own research and financial decisions.
© 2026 Flowly Indicators. All rights reserved.