

Backtest custom date ranges
Custom date ranges can be used to isolate SubFlow Terminal's signals to a specific market regime using custom date range.
This feature allows in-depth insights on signal performance under certain market conditions which will have great influence on how the signals behave.
Let's review an example. Here's Oracle's (ORCL) daily chart with downside liquidations running in the backtest.
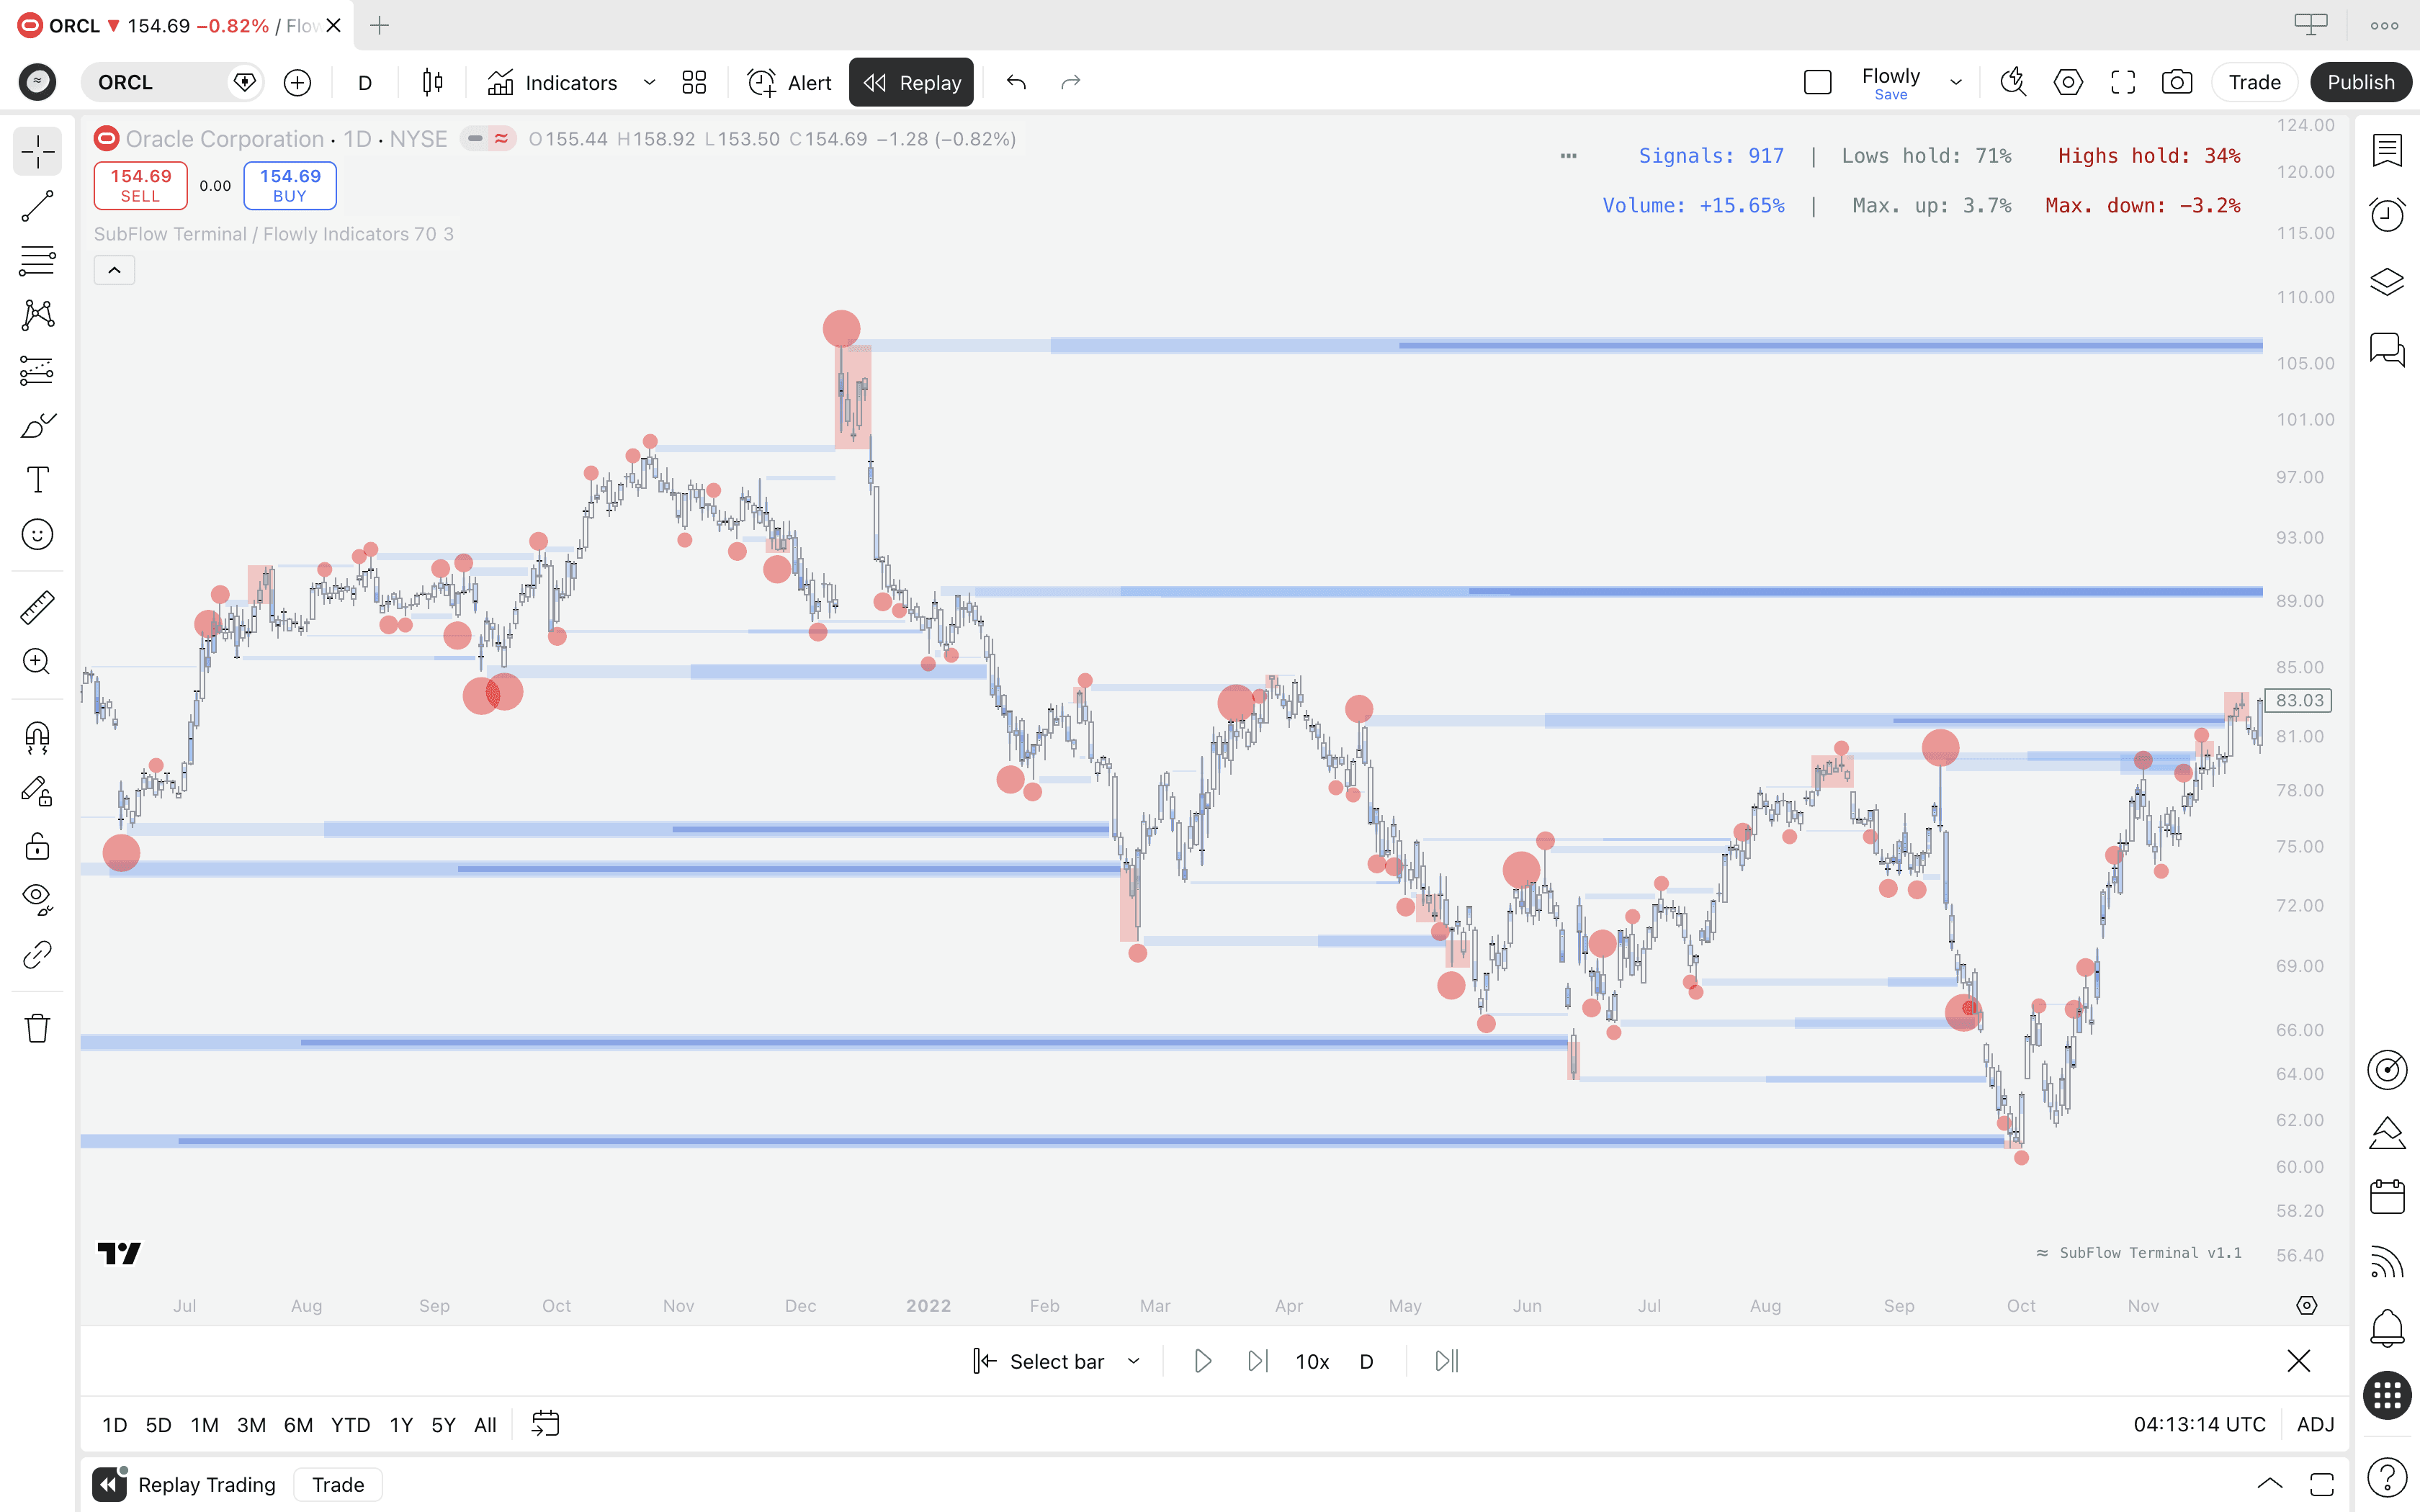
We can tell there's a clear bullish skew. Lows hold 71% of the time (while highs very rarely do so) and maximum upside is greater than maximum downside.
This is throughout the chart's history, but how do the downside liquidations perform in uptrends? Let's take a sample by isolating the backtest to Oracle's uptrend regime that lasted from January 2021 to October 2021.
Let's pop up the settings menu, choose date range under Backtest preferences and toggle on the filter. SubFlow Terminal highlights the isolated region.
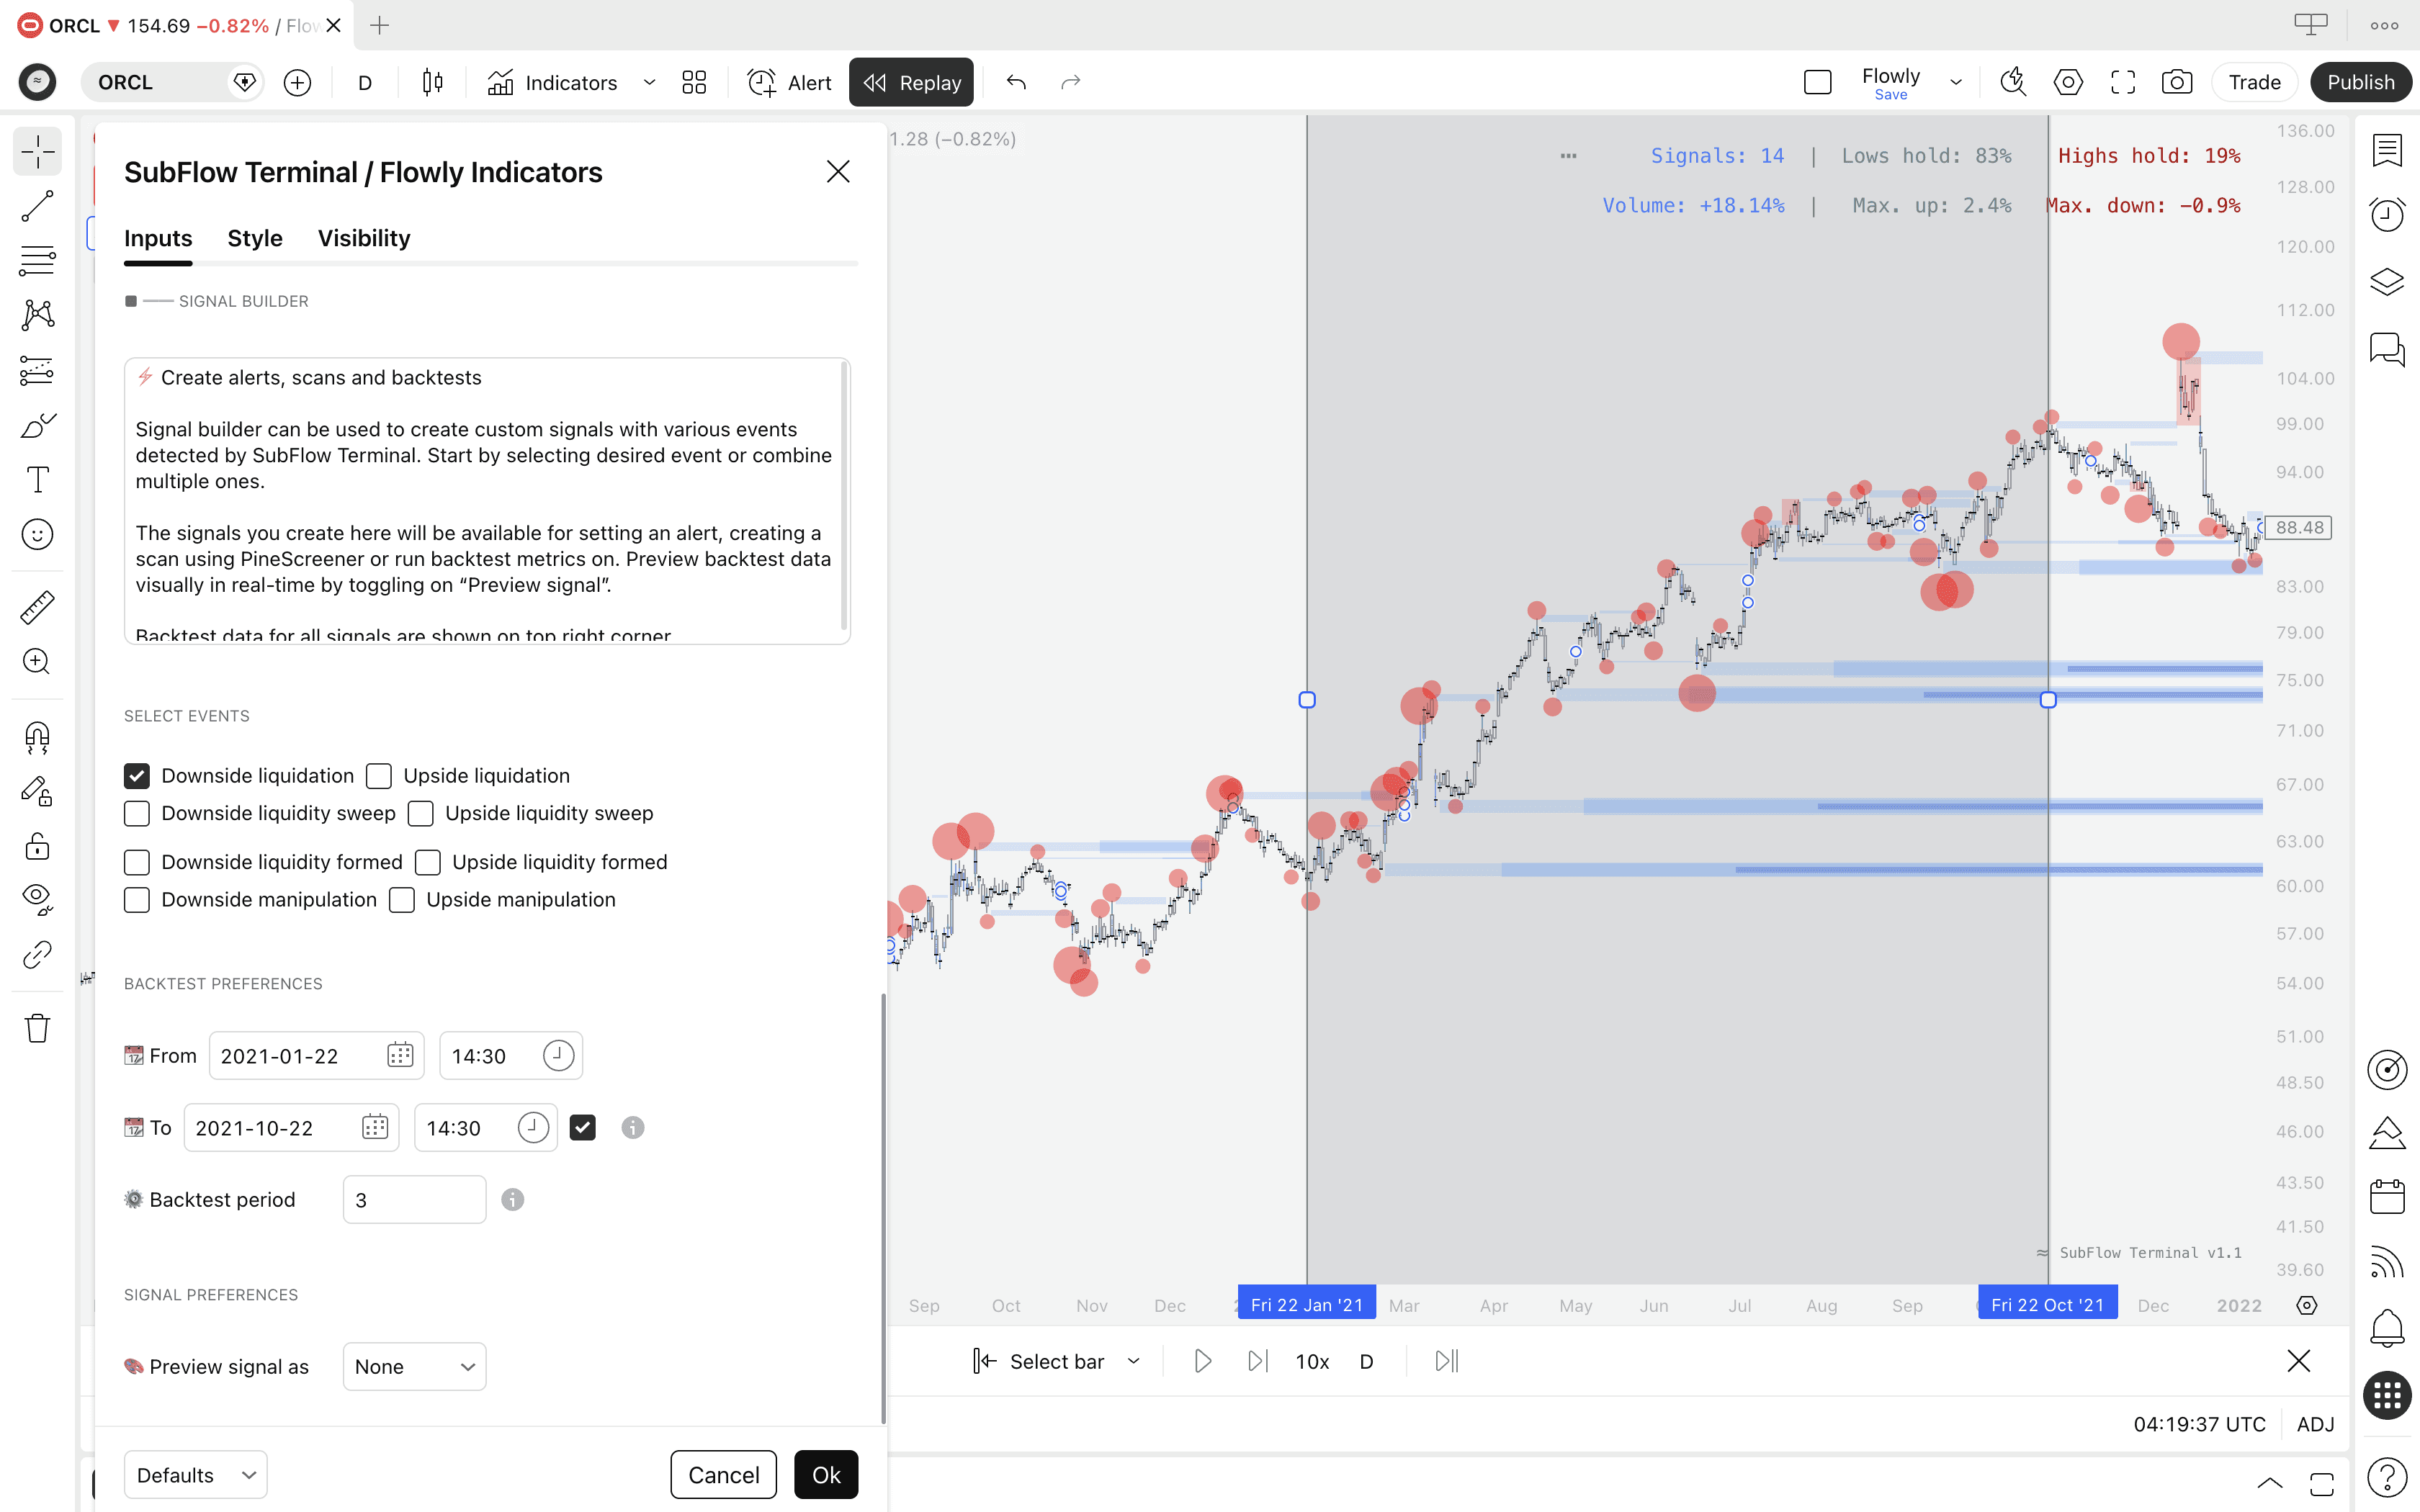
We can immediately tell our bullish skew becomes much stronger - over twice as much maximum upside than downside. Lows also hold more often and highs hold rarely ever - just 19% of the time.
We can conclude downside liquidations are high performing long signals for forecasting upside on an identified uptrend.
Backtest custom date ranges
Custom date ranges can be used to isolate SubFlow Terminal's signals to a specific market regime using custom date range.
This feature allows in-depth insights on signal performance under certain market conditions which will have great influence on how the signals behave.
Let's review an example. Here's Oracle's (ORCL) daily chart with downside liquidations running in the backtest.
We can tell there's a clear bullish skew. Lows hold 71% of the time (while highs very rarely do so) and maximum upside is greater than maximum downside.
This is throughout the chart's history, but how do the downside liquidations perform in uptrends? Let's take a sample by isolating the backtest to Oracle's uptrend regime that lasted from January 2021 to October 2021.
Let's pop up the settings menu, choose date range under Backtest preferences and toggle on the filter. SubFlow Terminal highlights the isolated region.
We can immediately tell our bullish skew becomes much stronger - over twice as much maximum upside than downside. Lows also hold more often and highs hold rarely ever - just 19% of the time.
We can conclude downside liquidations are high performing long signals for forecasting upside on an identified uptrend.
Long, medium and short term performance
We can also now determine for how long we want to measure the signal's performance with custom backtesting period.
This setting determines how long the performance is recorded after the signal is confirmed.
Let's change the backtest period to 10 candles and see what findings we get for the custom backtesting period.
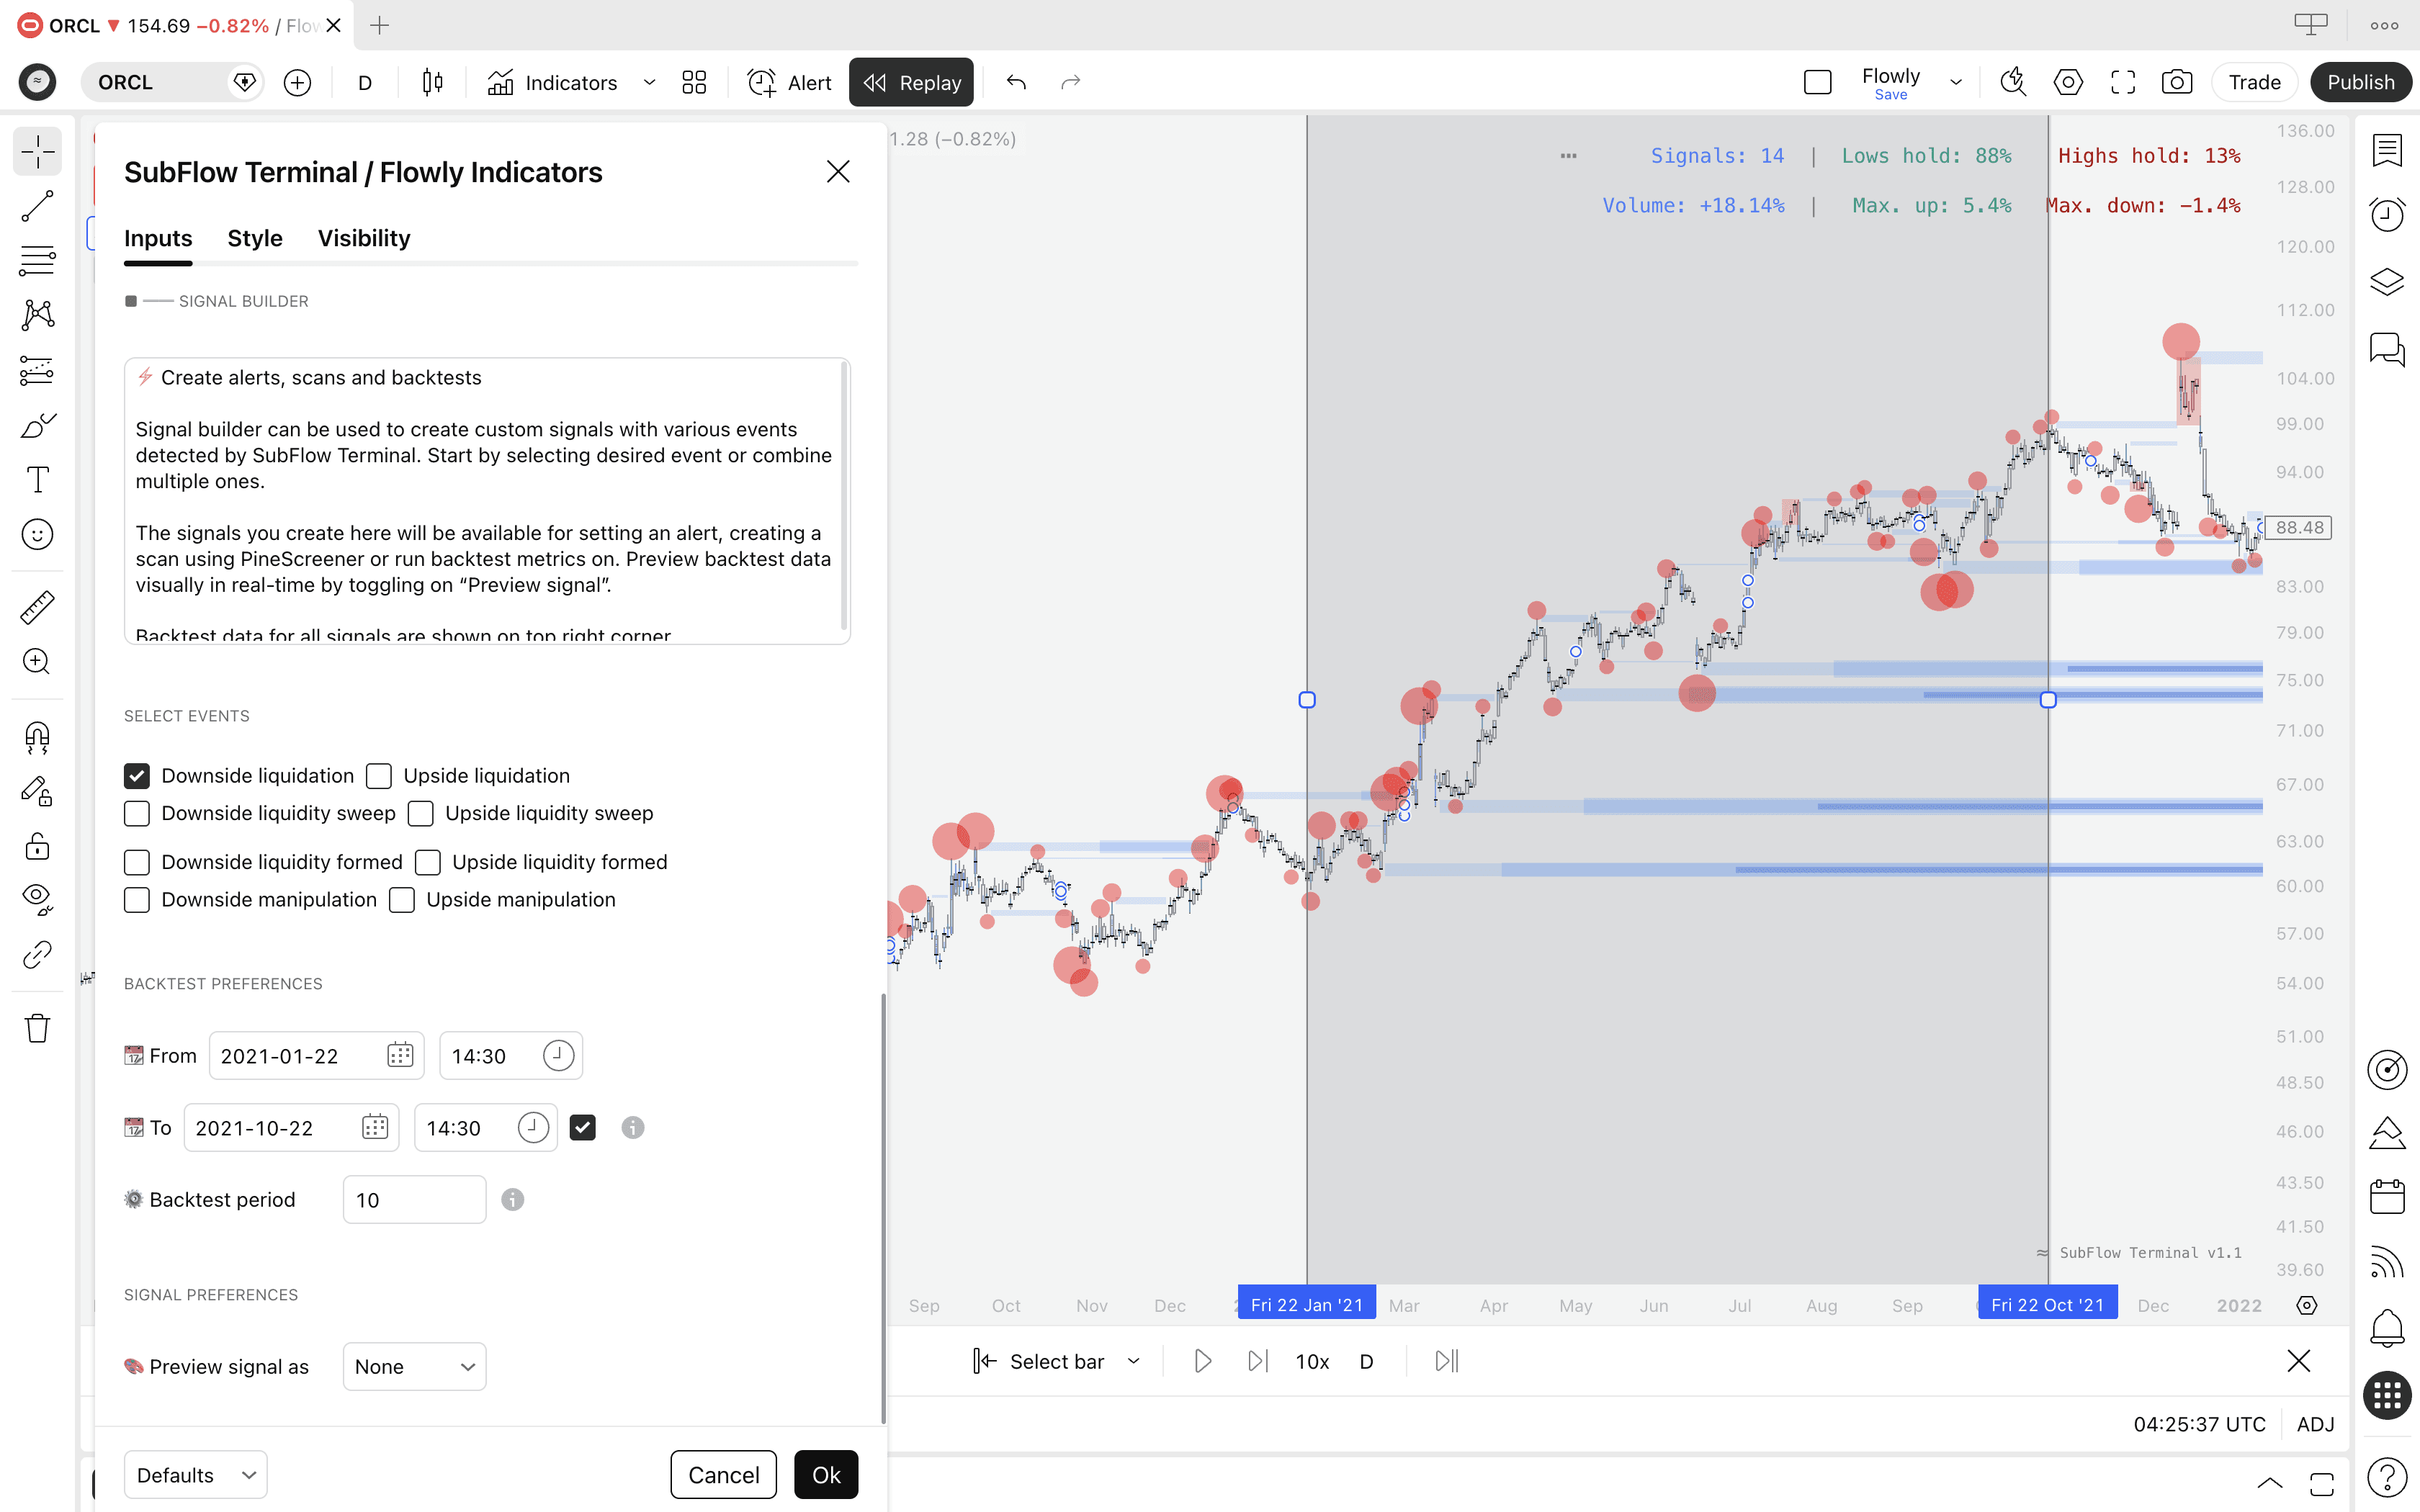
Our bullish skew remains even over the long term. Actually, it gets even better. Our signal produces a maximum upside of +5.4% during the 10 candle backtesting period. That's over 3 times more than the maximum downside.
Lows hold very strongly at 88% of the time. Highs hold rarely ever, just 13% of the time. The takeaway here is resistance is found very often at lows and breakout through highs is very likely. This is a sign of real edge.
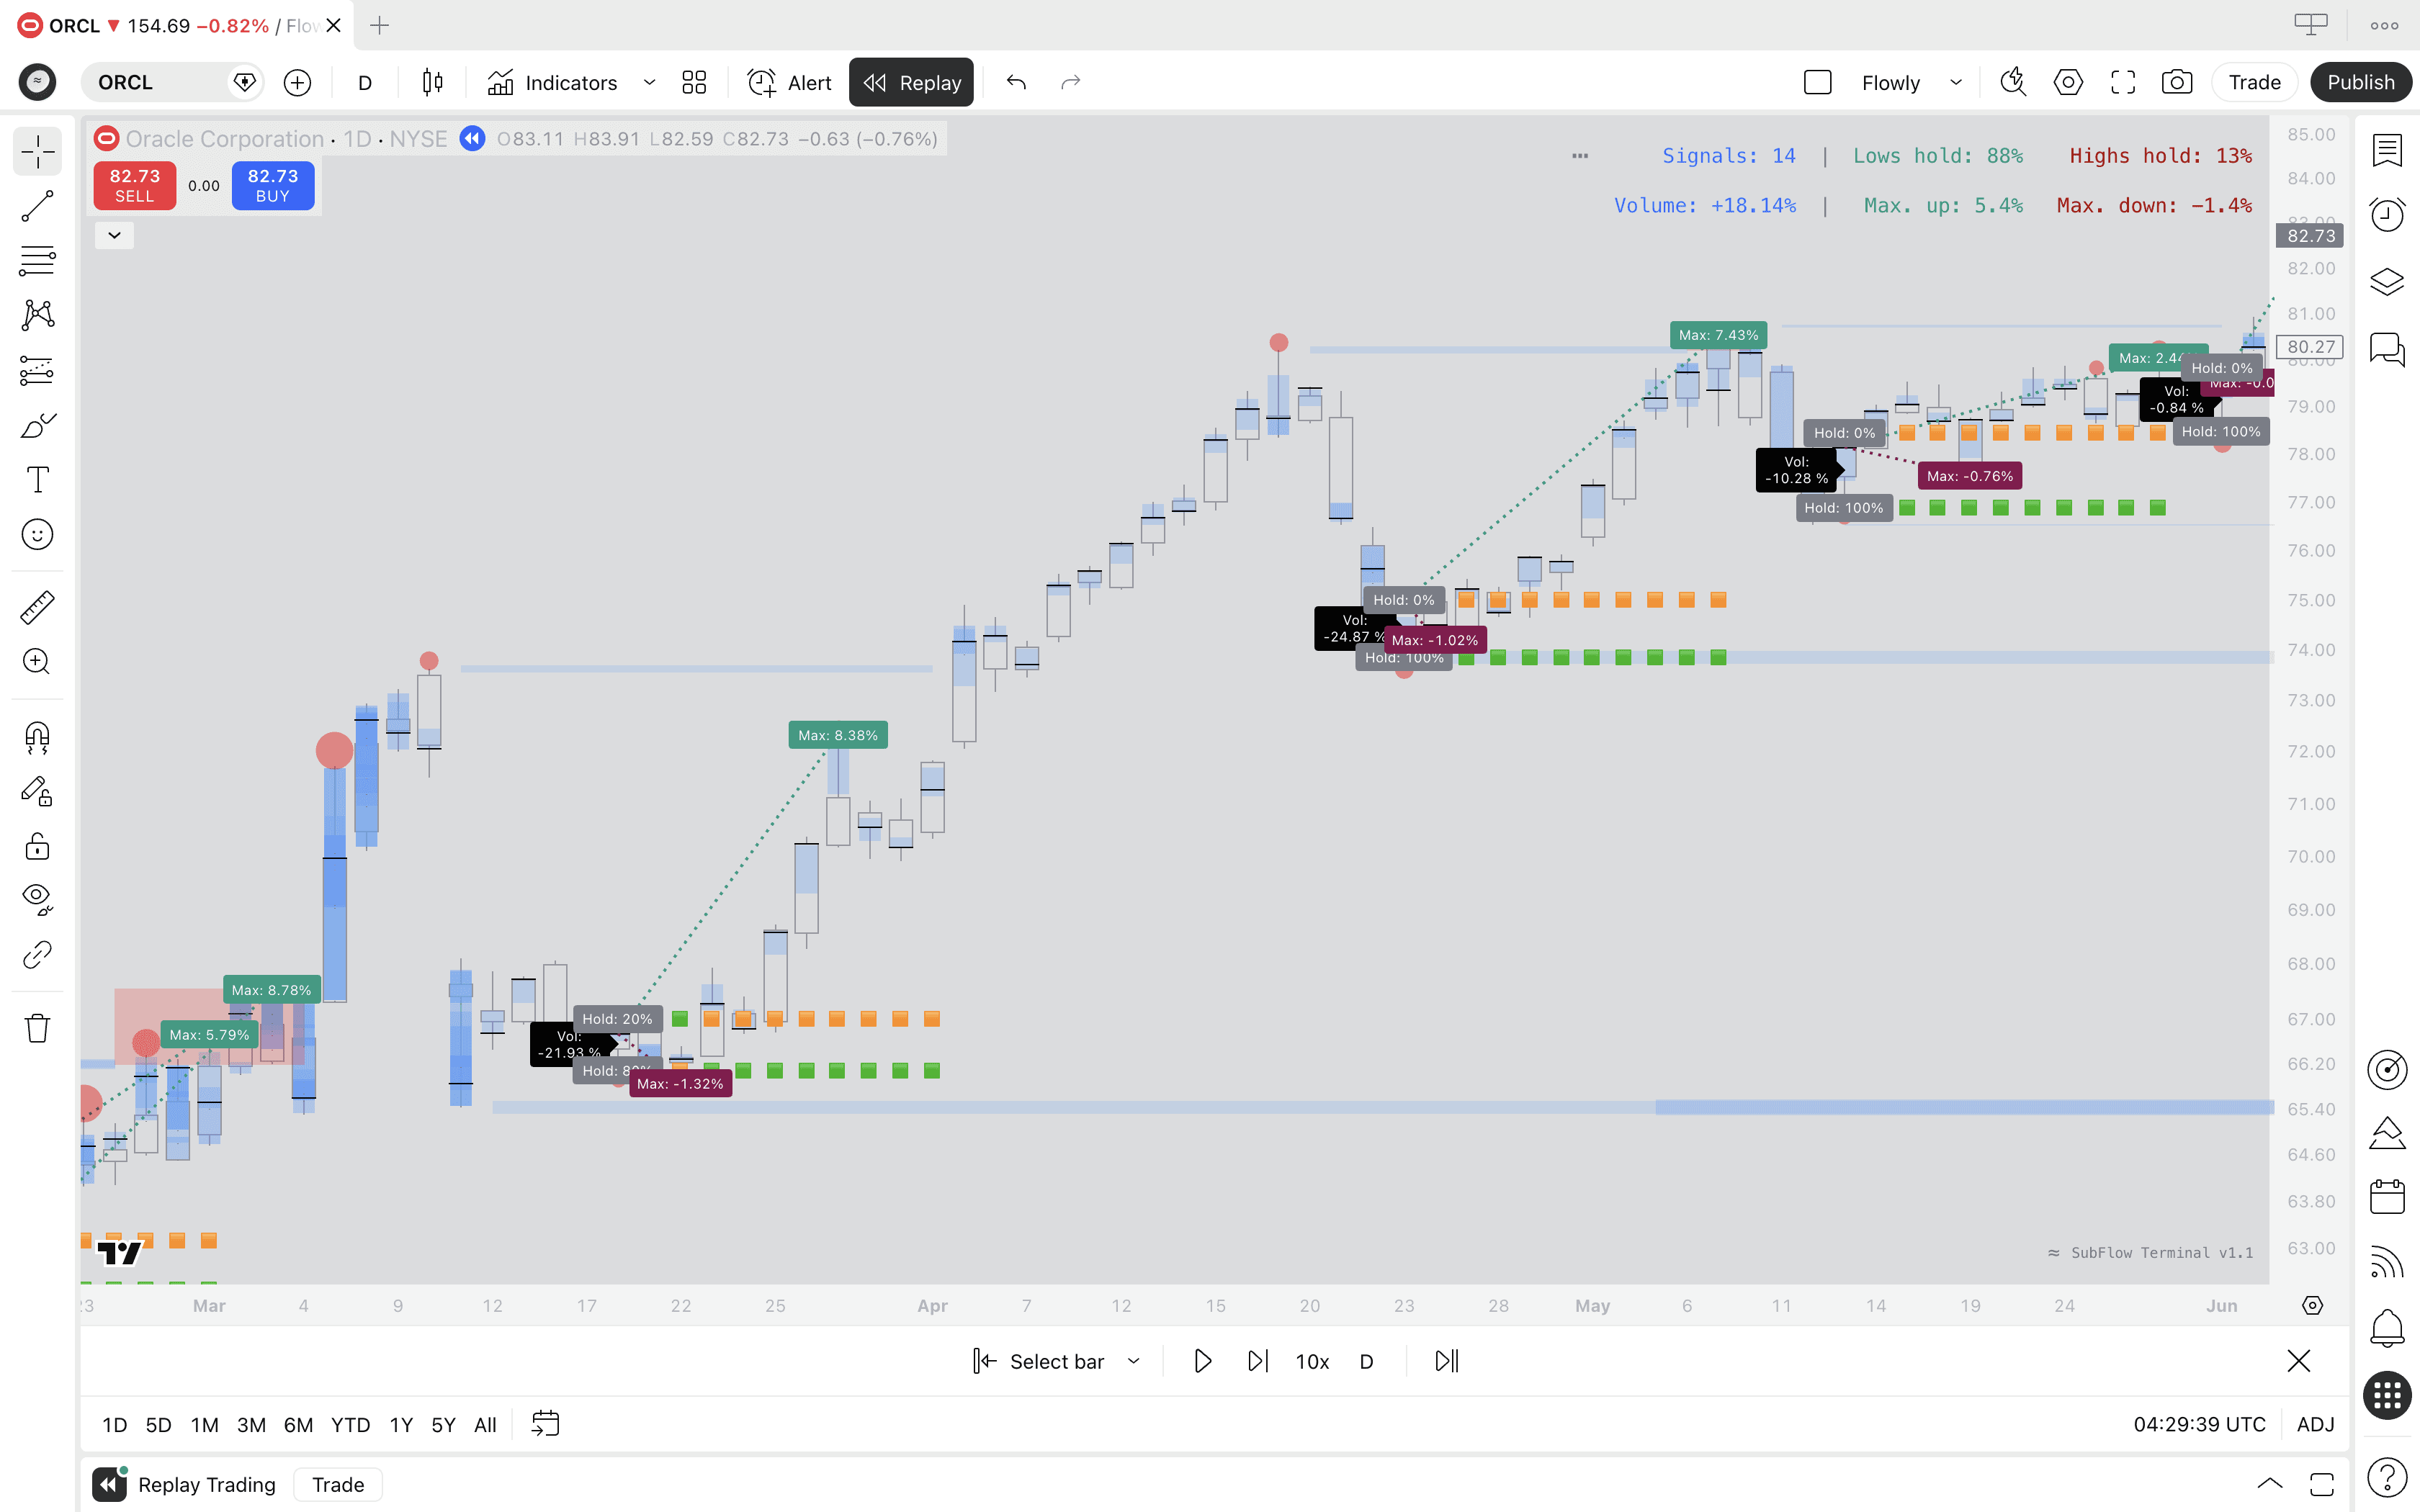
We can inspect visually the performance of each signal right on the chart by setting "Preview signal" to "Backtest".
Long, medium and short term performance
We can also now determine for how long we want to measure the signal's performance with custom backtesting period.
This setting determines how long the performance is recorded after the signal is confirmed.
Let's change the backtest period to 10 candles and see what findings we get for the custom backtesting period.
Our bullish skew remains even over the long term. Actually, it gets even better. Our signal produces a maximum upside of +5.4% during the 10 candle backtesting period. That's over 3 times more than the maximum downside.
Lows hold very strongly at 88% of the time. Highs hold rarely ever, just 13% of the time. The takeaway here is resistance is found very often at lows and breakout through highs is very likely. This is a sign of real edge.
We can inspect visually the performance of each signal right on the chart by setting "Preview signal" to "Backtest".
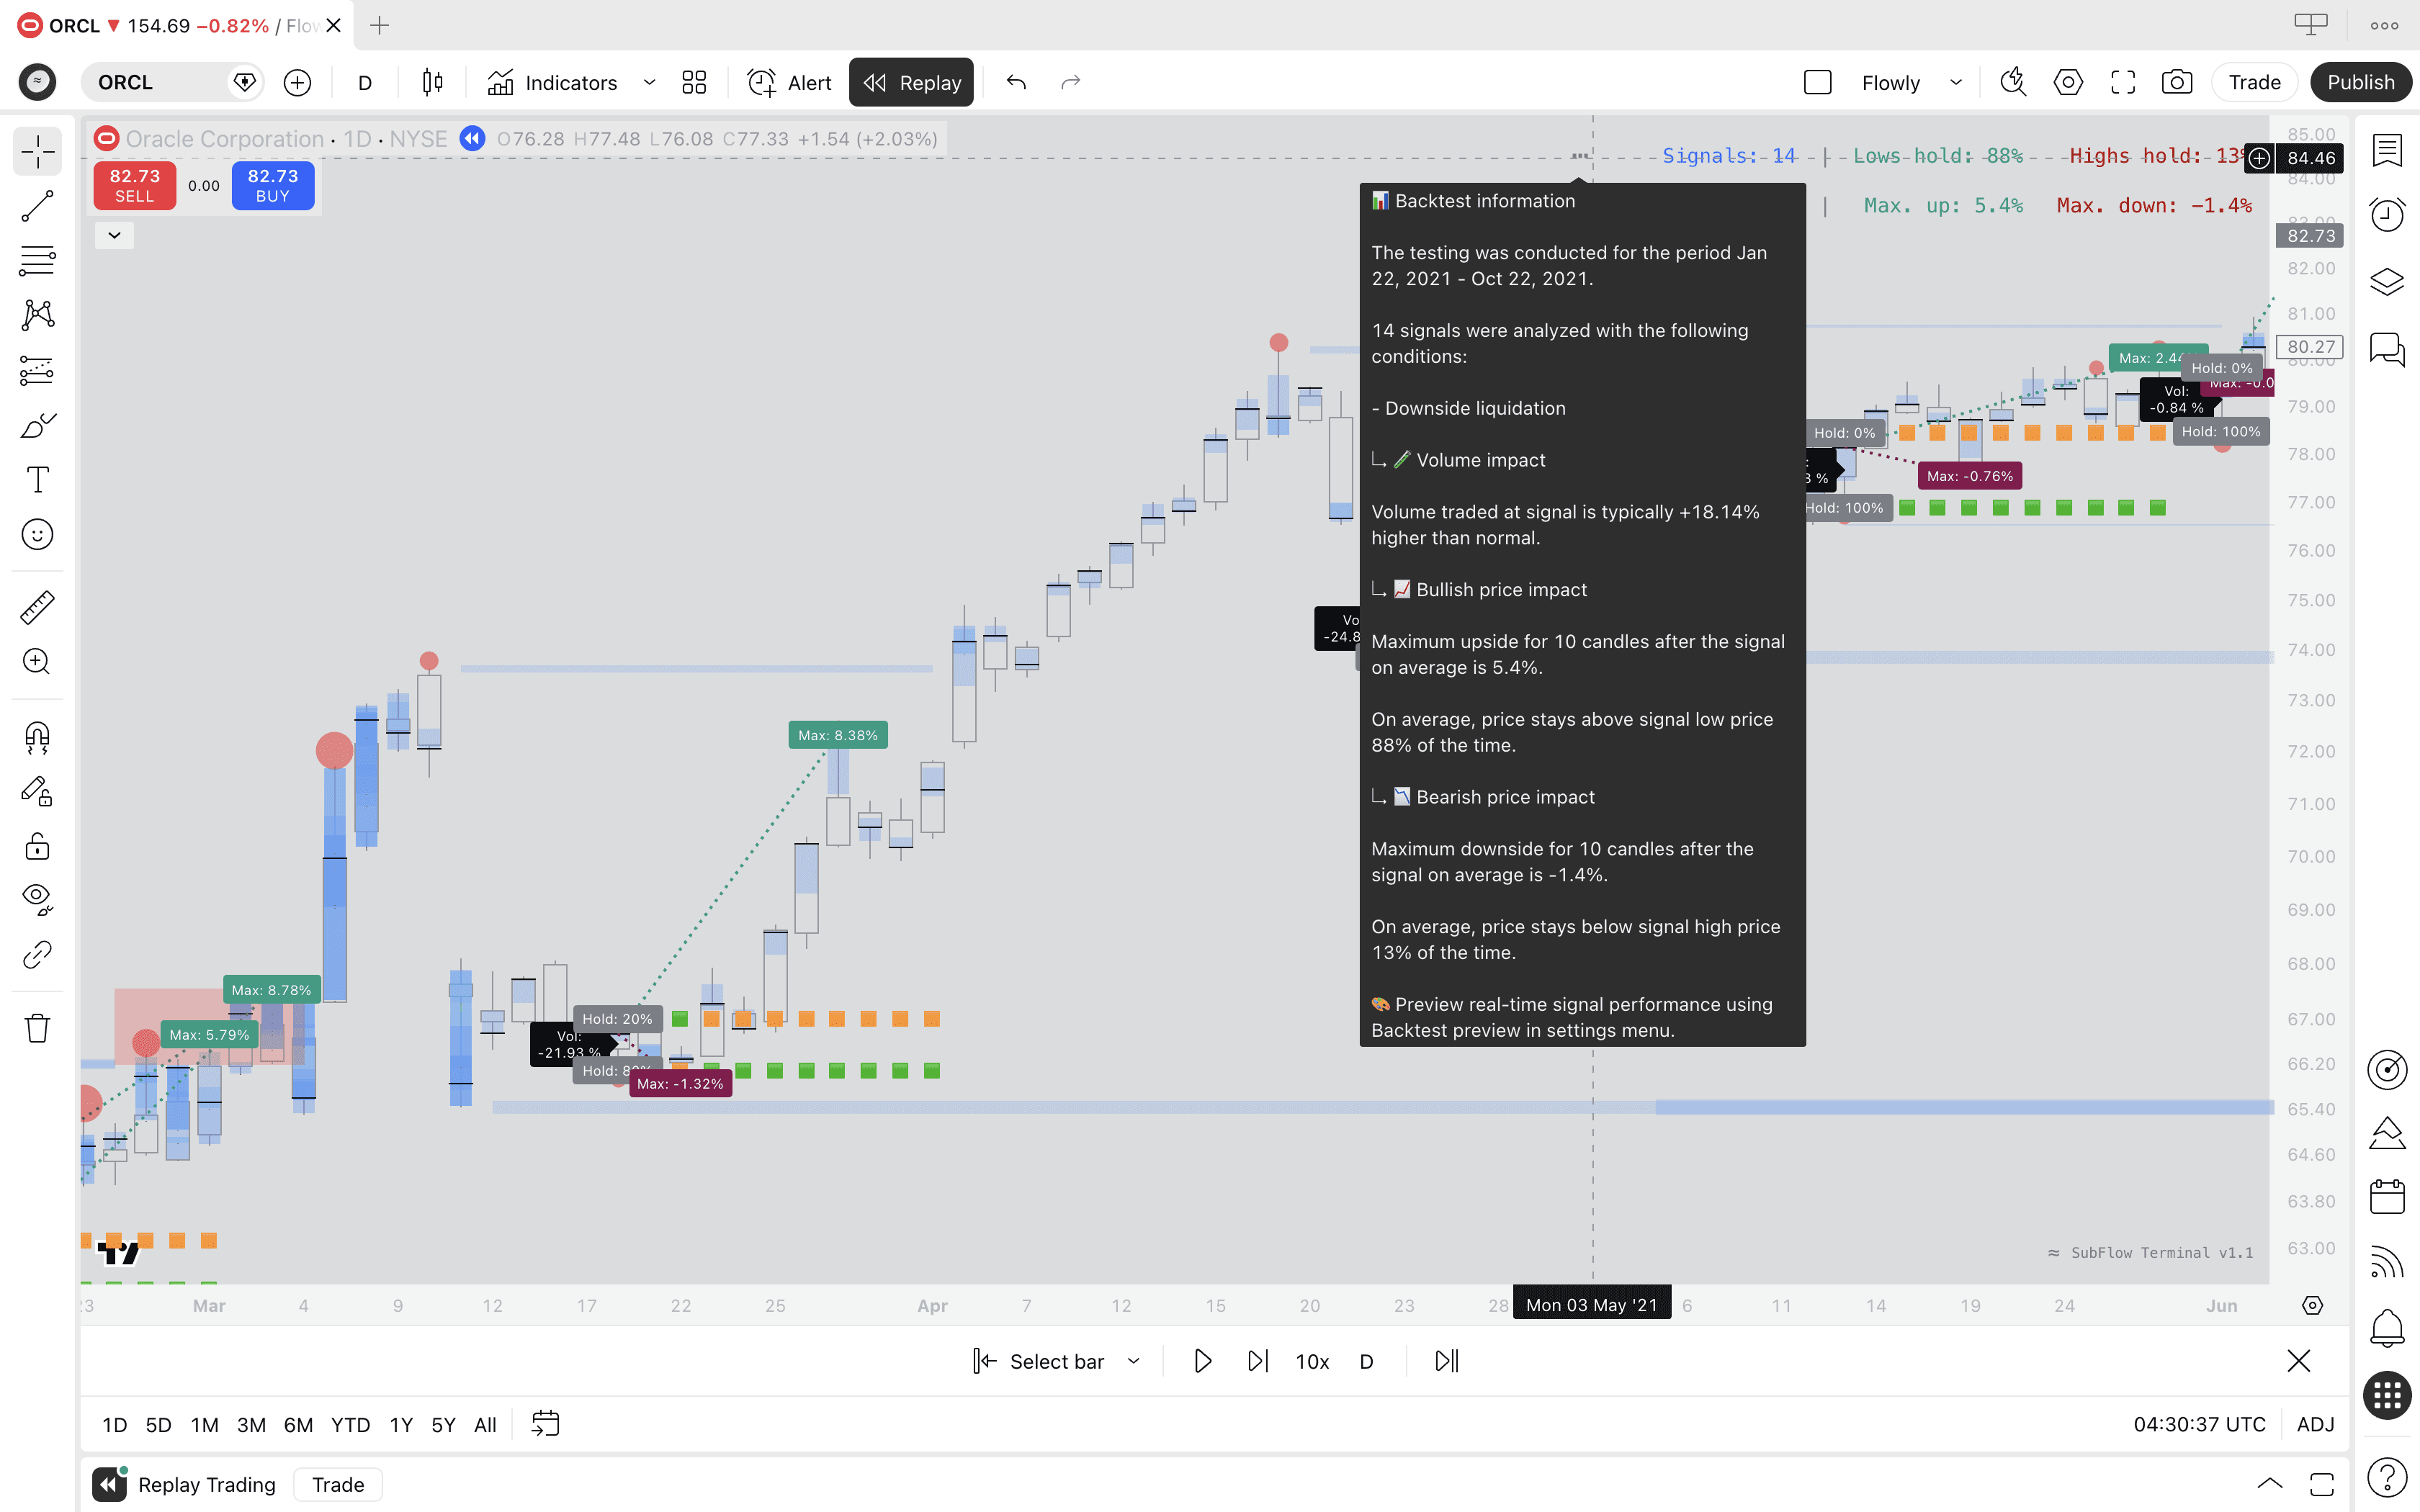
Summarize backtesting results
The backtesting results can be read in a summarized, human-friendly format by hovering mouse over the three dots on left side of the backtesting table.
We get a report of the backtest, including testing period, amount of signals, conditions and each test broken down.
Summarize backtesting results
The backtesting results can be read in a summarized, human-friendly format by hovering mouse over the three dots on left side of the backtesting table.
We get a report of the backtest, including testing period, amount of signals, conditions and each test broken down.
Wrap-up
That's it for SubFlow Terminal v1.1 update. It's good to keep in mind backtesting is a nuanced topic, the metrics should be read as indicative, not definitive.
Make sure amount of signals recorded is high enough (>100) to constitute statistical significance. Test both short and long term performance to understand the signal behavior in detail.
Happy testing!


