

Reading Time & Volume Point of Control
Before jumping into how to read point of controls on the indicator, let's briefly go over what a point of control is.
It's actually very simple. Point of Control simply refers to a single point in price where something was at its highest.
What is time point of control?
Time point of control (or TPOC in short) is the price level where price spent most amount of time. This is calculated by breaking down the whole price move into "buckets", where each accumulates time when price trades there.
What is volume point of control?
Volume point of control (or VPOC in short) is the price level where most volume was traded. This is calculated the same way as time and usually correlates very tightly with time.
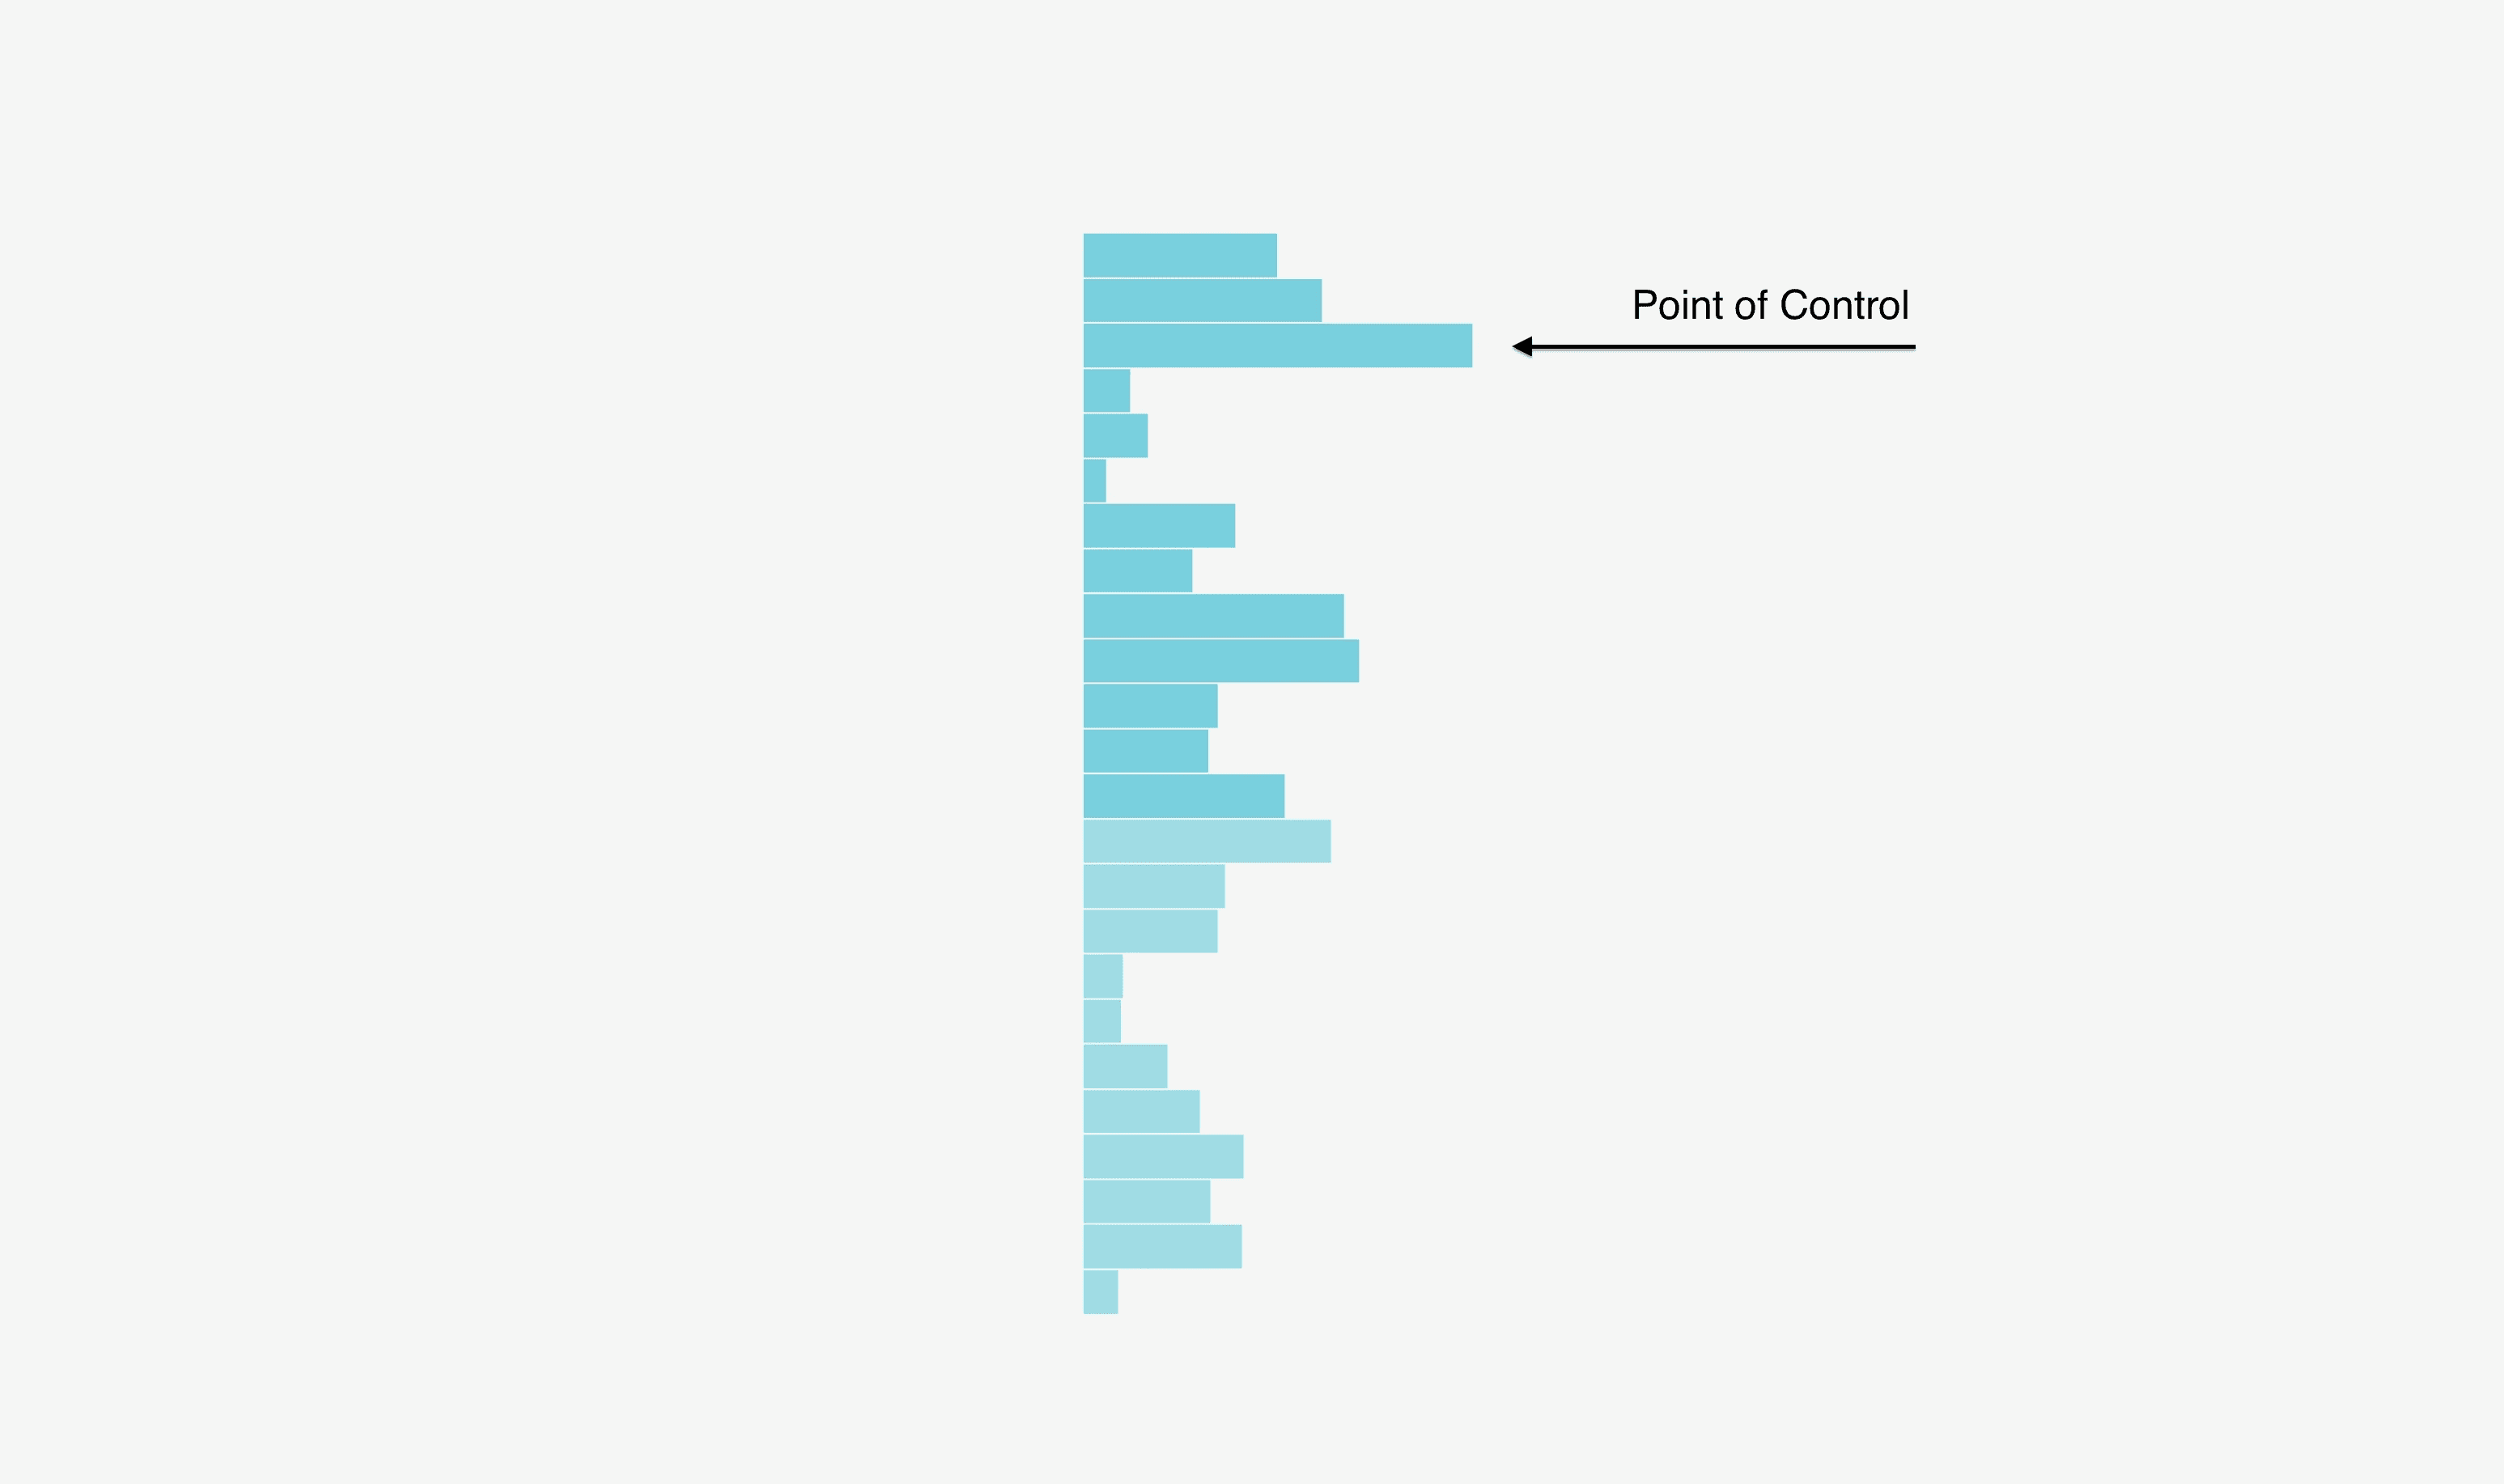
On a market profile showing total distribution of time or volume, the point of control is located at the highest node that sticks out the most.
This is what that looks like.
Reading Time & Volume Point of Control
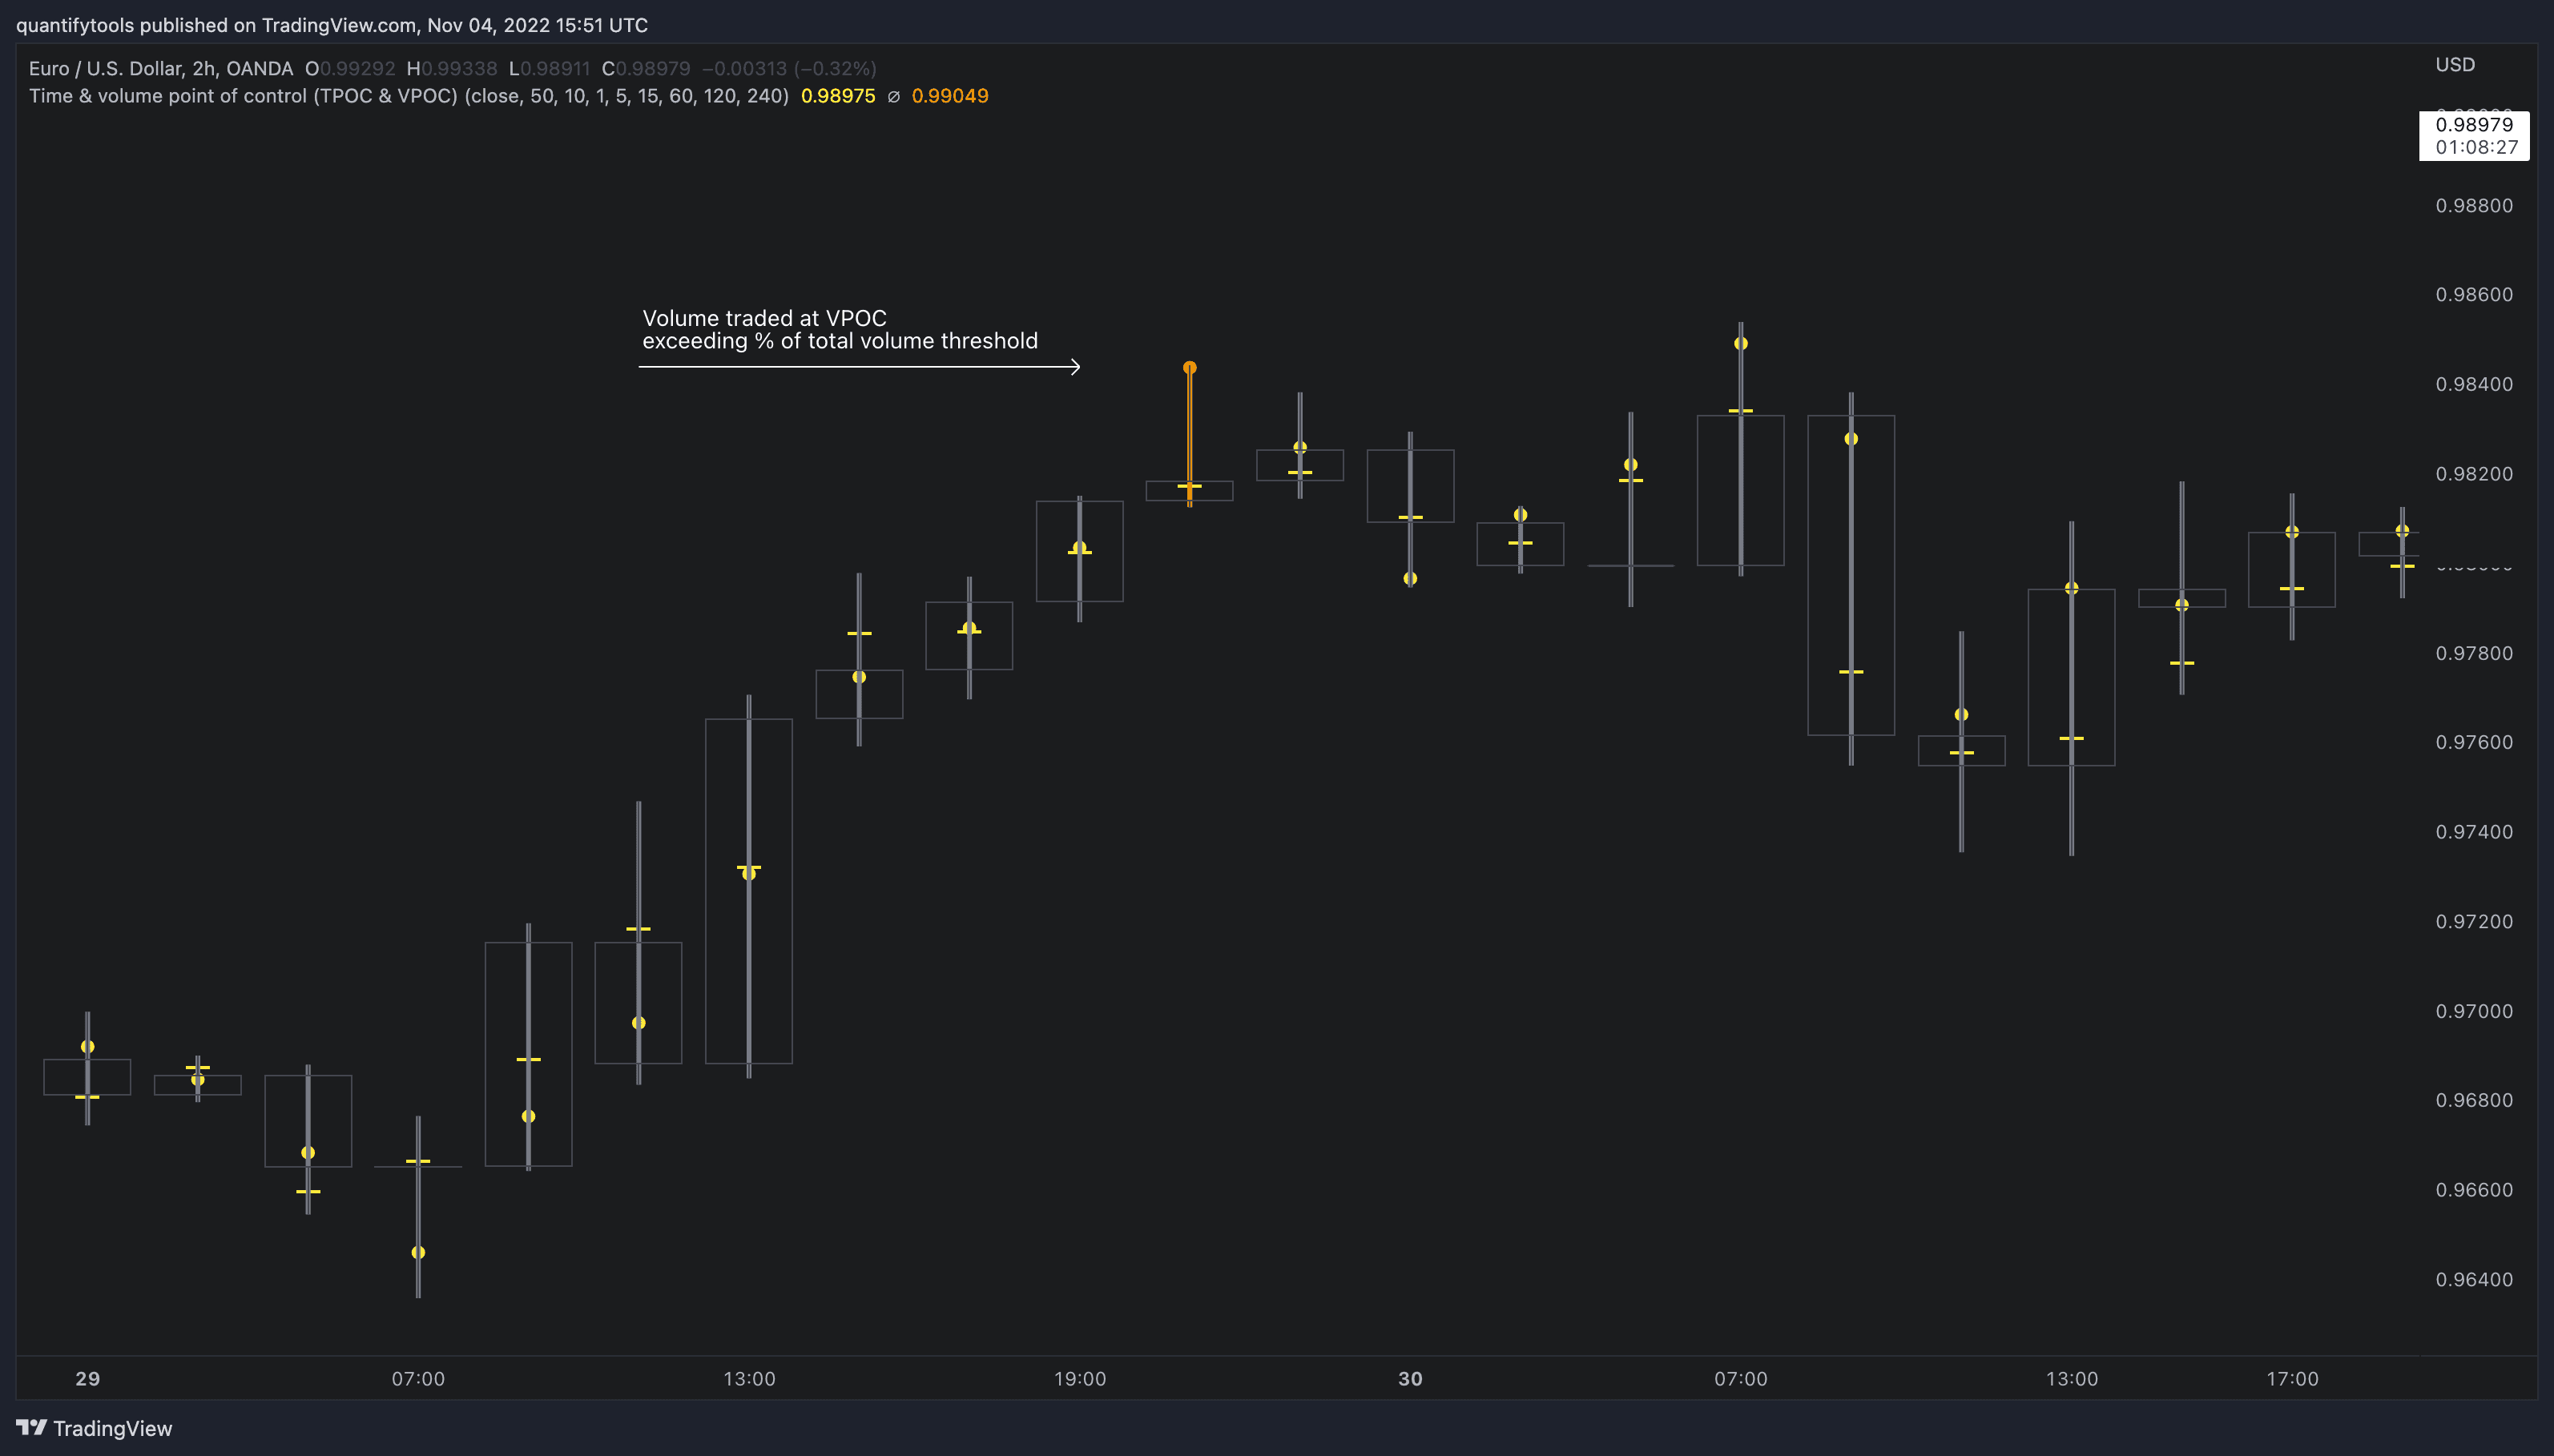
In this indicator, we are not concerned with all of the distribution, just where the pinnacle of interest is - the points of control. Here's what the points of control look like in a chart when the indicator is added.
Reading the Points of Control (or POC's for short) is very easy. There are just two symbols to keep track of to identify volume and and time point of control.
Time point of control (TPOC) | Volume point of control (VPOC) |
|---|---|
Highest amount of time traded | Highest amount of volume traded |
Visualized using a yellow line | Visualized using a yellow circle |
How is Point of Control calculated on TradingView?
Traditionally, point of control is calculated by using raw volume feed directly from exchange (known as volume tick data) and tracking at what price level it is recorded the most.
As TradingView doesn't offer this data without breaking you wallet (you need an expensive plan and even then it's limited), a popular work around is using lower timeframe data or the aggregation method.
Let's go over how that is implemented for this indicator.
How is Time Point of Control calculated?
In this indicator, each candle are broken into 10 equal sized sections or "lots", where the indicator tracks lower timeframe price and volume data.
For example, when viewing 1 hour timeframe, the indicator will break the 1 hour (or 60 minutes) into 12x5 minute candles (totalling 60 minutes) and track whenever one of those 12 candle trades at a lot.
If it trades at a lot, the lot gains "1 unit of time". When the candle closes, the lot with highest amount of "time units" becomes the time point of control.
How is Volume Point of Control calculated?
For volume the calculation is way more simple. Check which lower timeframe candle had the highest volume, check its closing price - that's where the volume point of control is.
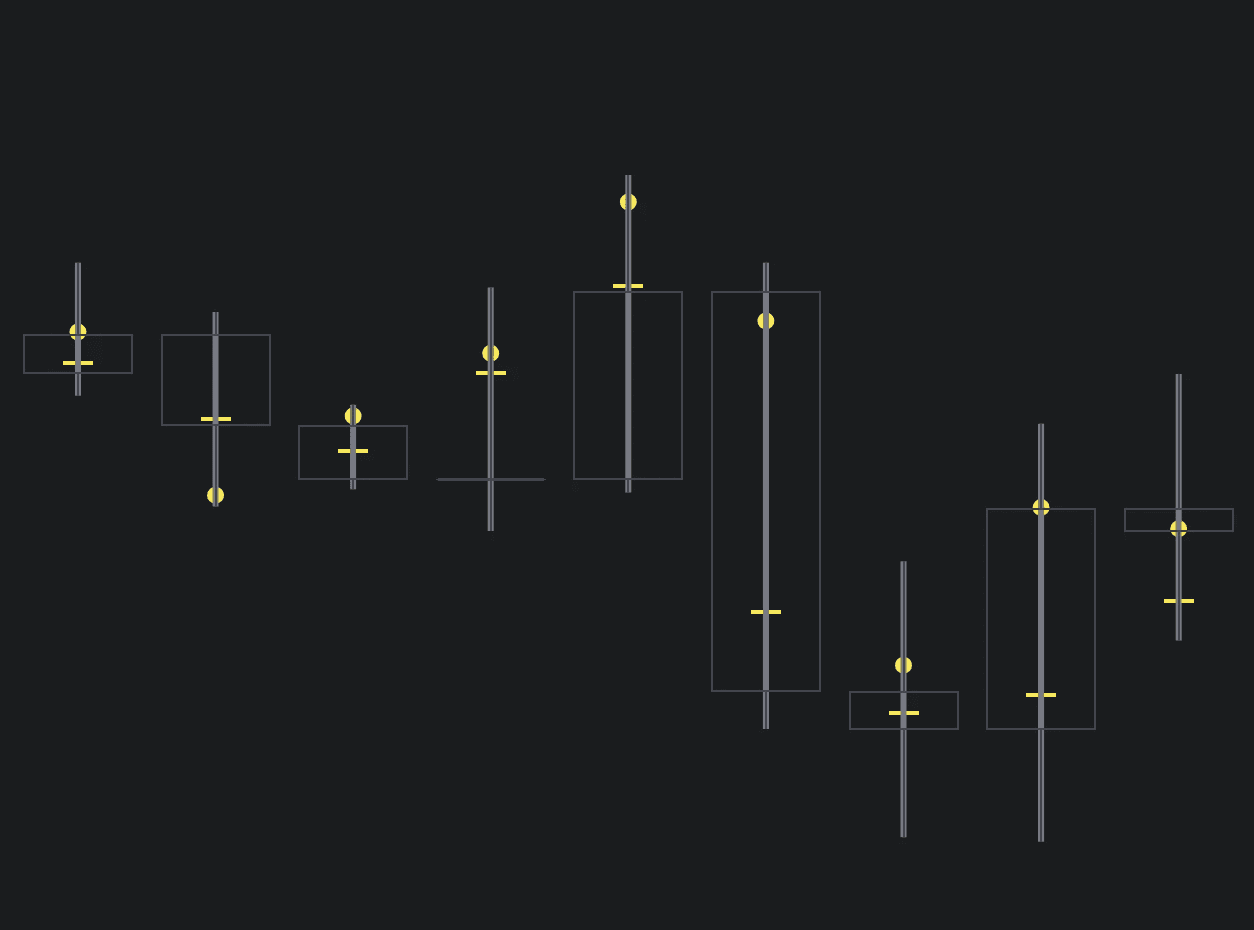
Still confused? Worry not, here's an illustration of how we break candle into 10 lots and where the points of control are located.

Reading Time & Volume Point of Control
Before jumping into how to read point of controls on the indicator, let's briefly go over what a point of control is.
It's actually very simple. Point of Control simply refers to a single point in price where something was at its highest.
What is time point of control?
Time point of control (or TPOC in short) is the price level where price spent most amount of time. This is calculated by breaking down the whole price move into "buckets", where each accumulates time when price trades there.
What is volume point of control?
Volume point of control (or VPOC in short) is the price level where most volume was traded. This is calculated the same way as time and usually correlates very tightly with time.
On a market profile showing total distribution of time or volume, the point of control is located at the highest node that sticks out the most.
This is what that looks like.
Reading Time & Volume Point of Control
In this indicator, we are not concerned with all of the distribution, just where the pinnacle of interest is - the points of control. Here's what the points of control look like in a chart when the indicator is added.
Reading the Points of Control (or POC's for short) is very easy. There are just two symbols to keep track of to identify volume and and time point of control.
Time point of control (TPOC) | Volume point of control (VPOC) |
|---|---|
Highest amount of time traded | Highest amount of volume traded |
Visualized using a yellow line | Visualized using a yellow circle |
How is Point of Control calculated on TradingView?
Traditionally, point of control is calculated by using raw volume feed directly from exchange (known as volume tick data) and tracking at what price level it is recorded the most.
As TradingView doesn't offer this data without breaking you wallet (you need an expensive plan and even then it's limited), a popular work around is using lower timeframe data or the aggregation method.
Let's go over how that is implemented for this indicator.
How is Time Point of Control calculated?
In this indicator, each candle are broken into 10 equal sized sections or "lots", where the indicator tracks lower timeframe price and volume data.
For example, when viewing 1 hour timeframe, the indicator will break the 1 hour (or 60 minutes) into 12x5 minute candles (totalling 60 minutes) and track whenever one of those 12 candle trades at a lot.
If it trades at a lot, the lot gains "1 unit of time". When the candle closes, the lot with highest amount of "time units" becomes the time point of control.
How is Volume Point of Control calculated?
For volume the calculation is way more simple. Check which lower timeframe candle had the highest volume, check its closing price - that's where the volume point of control is.
Still confused? Worry not, here's an illustration of how we break candle into 10 lots and where the points of control are located.
Key features of Time & Volume Point of Control
While the points of control are simple to detect and use, we always pack our indicators with useful extras. Here's what we did for Time and Volume Point of Control.
Extreme points of control
Volume Points of Control with unusually high volume can be highlighted with a separate color. Users can define a percentage of total volume traded at POC to trigger the highlight.
For example, setting threshold at 50% will activate a highlight whenever volume traded at VPOC or time traded at TPOC is equal to or greater than 50% of all volume/time traded.
This feature is useful for identifying when traders are showing extremely high interest at a single small point in price.
Trend initiation and trap signals
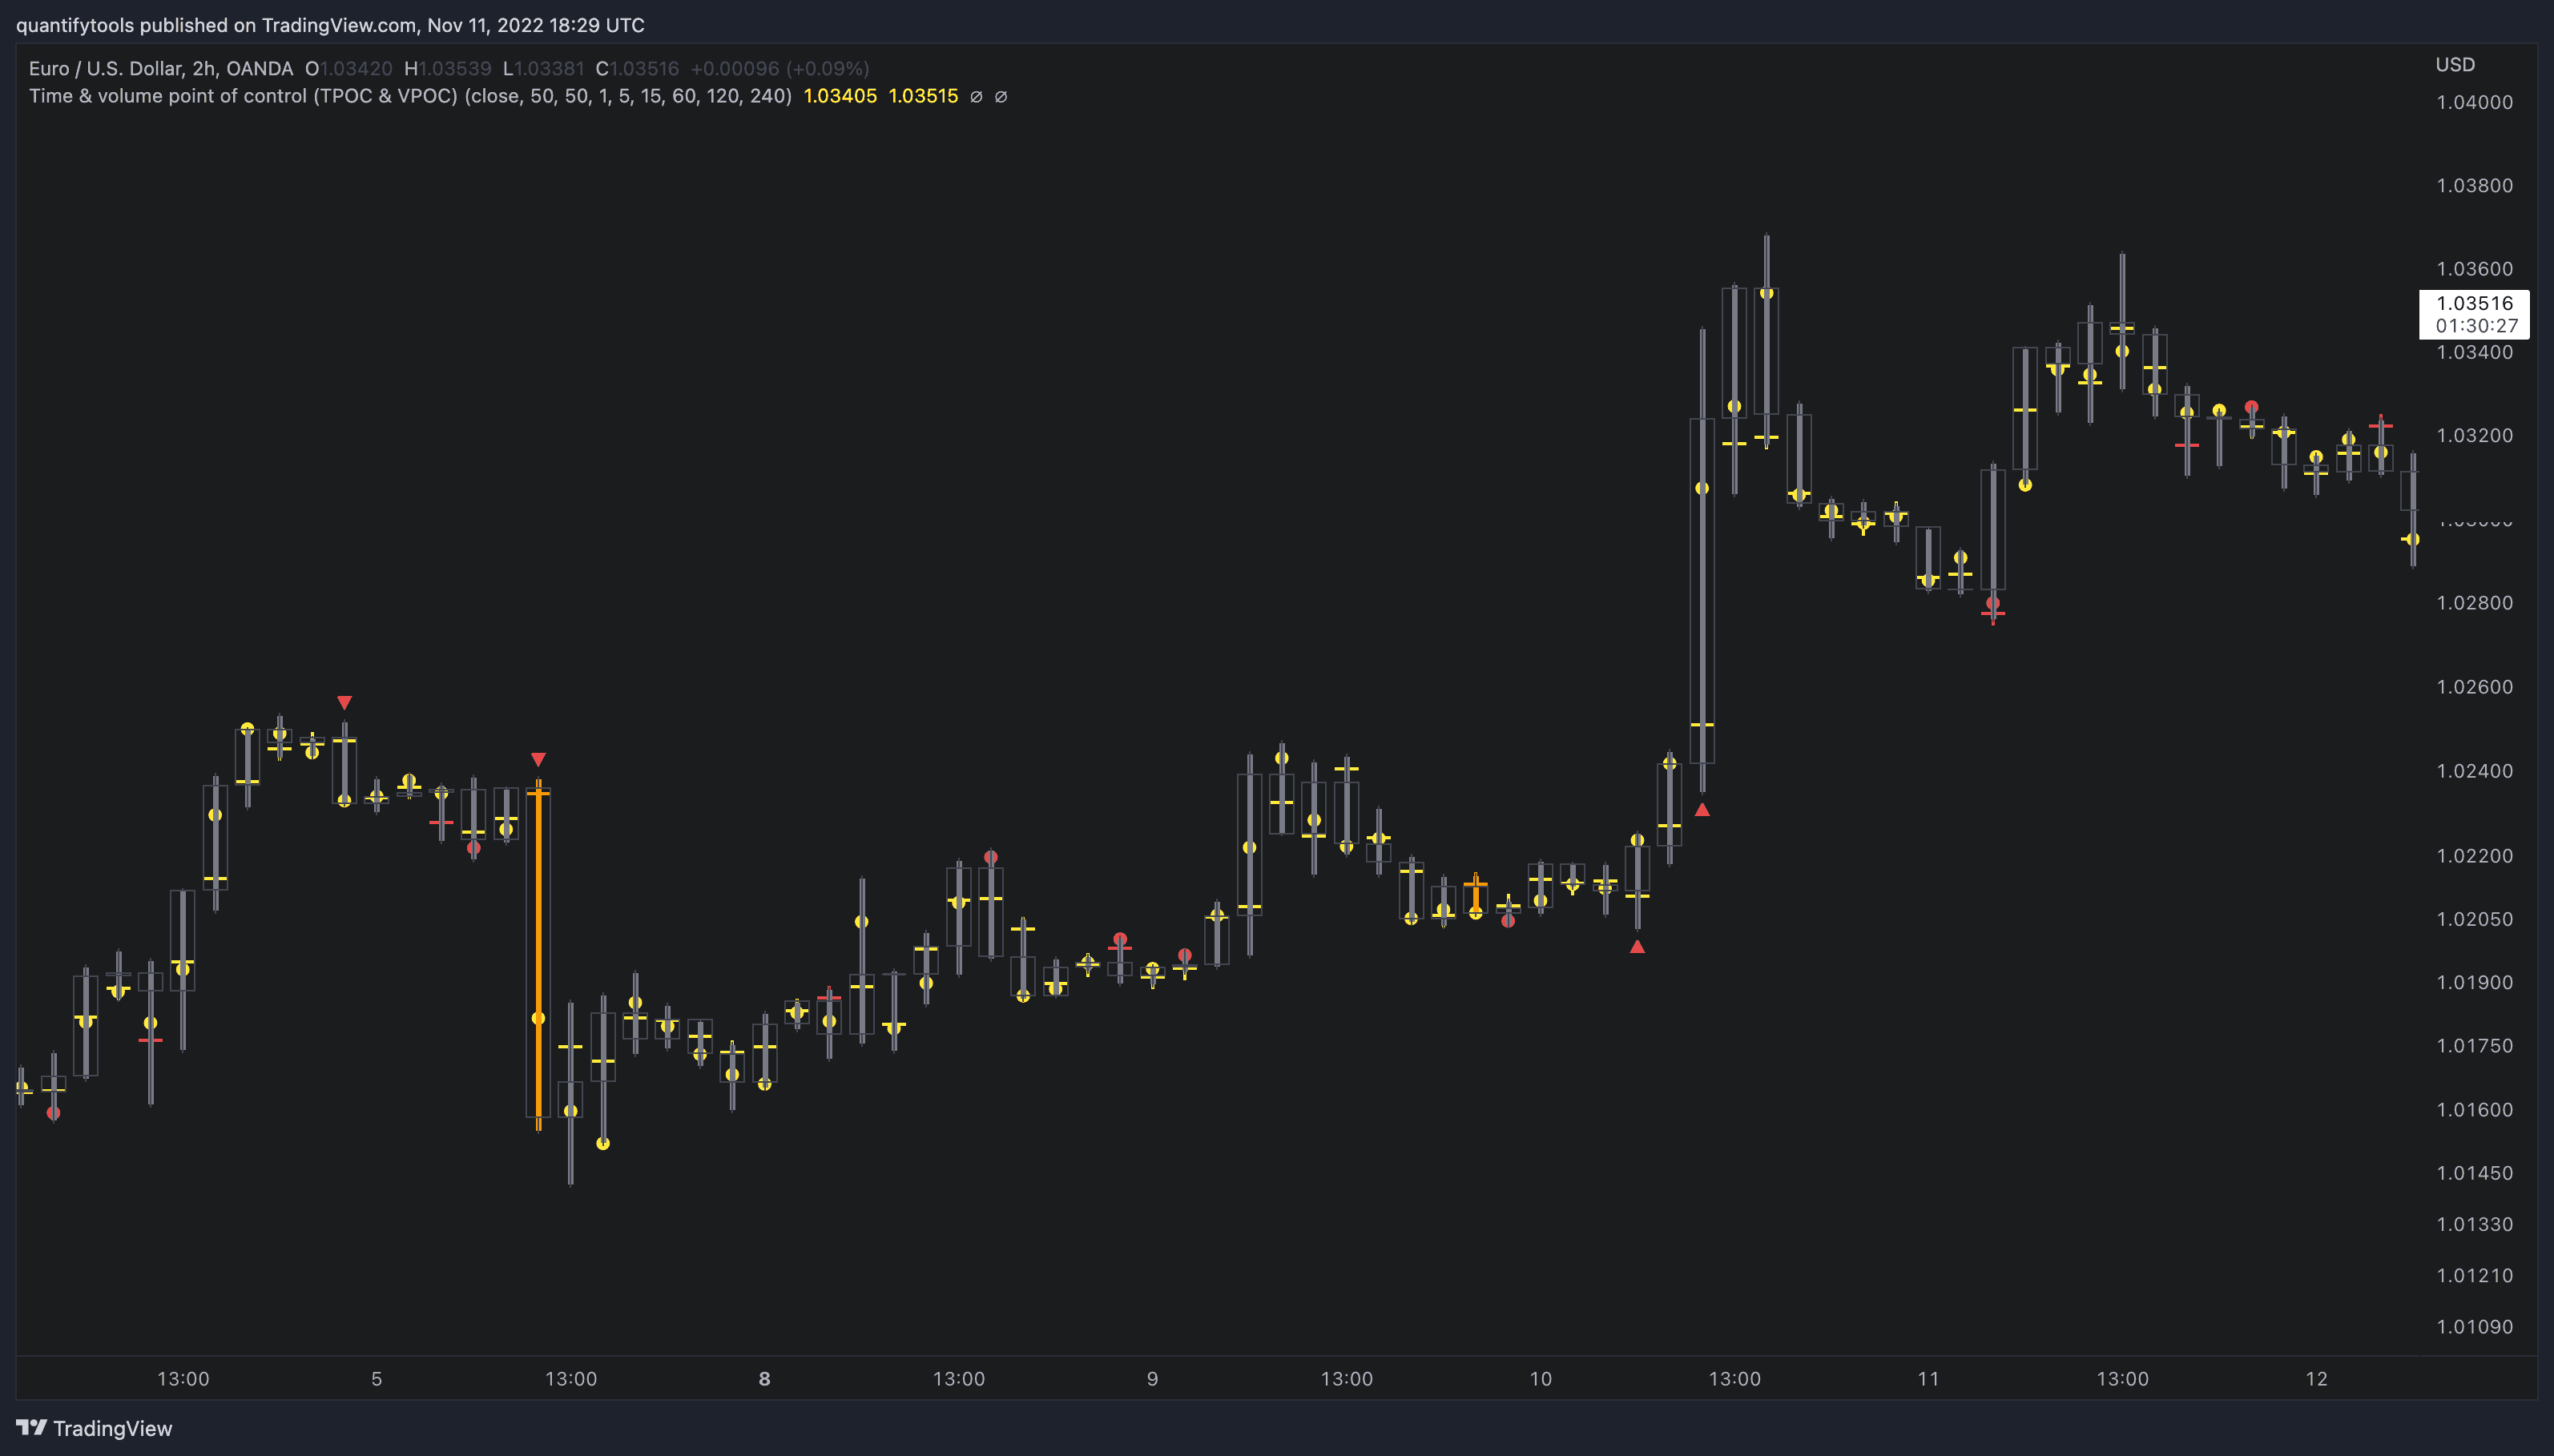
Users can highlight instances where the Points of Control are signalling new initiated trends (expect trend continuation) and trapped traders (expect trend reversal).
These concepts will be covered further below.
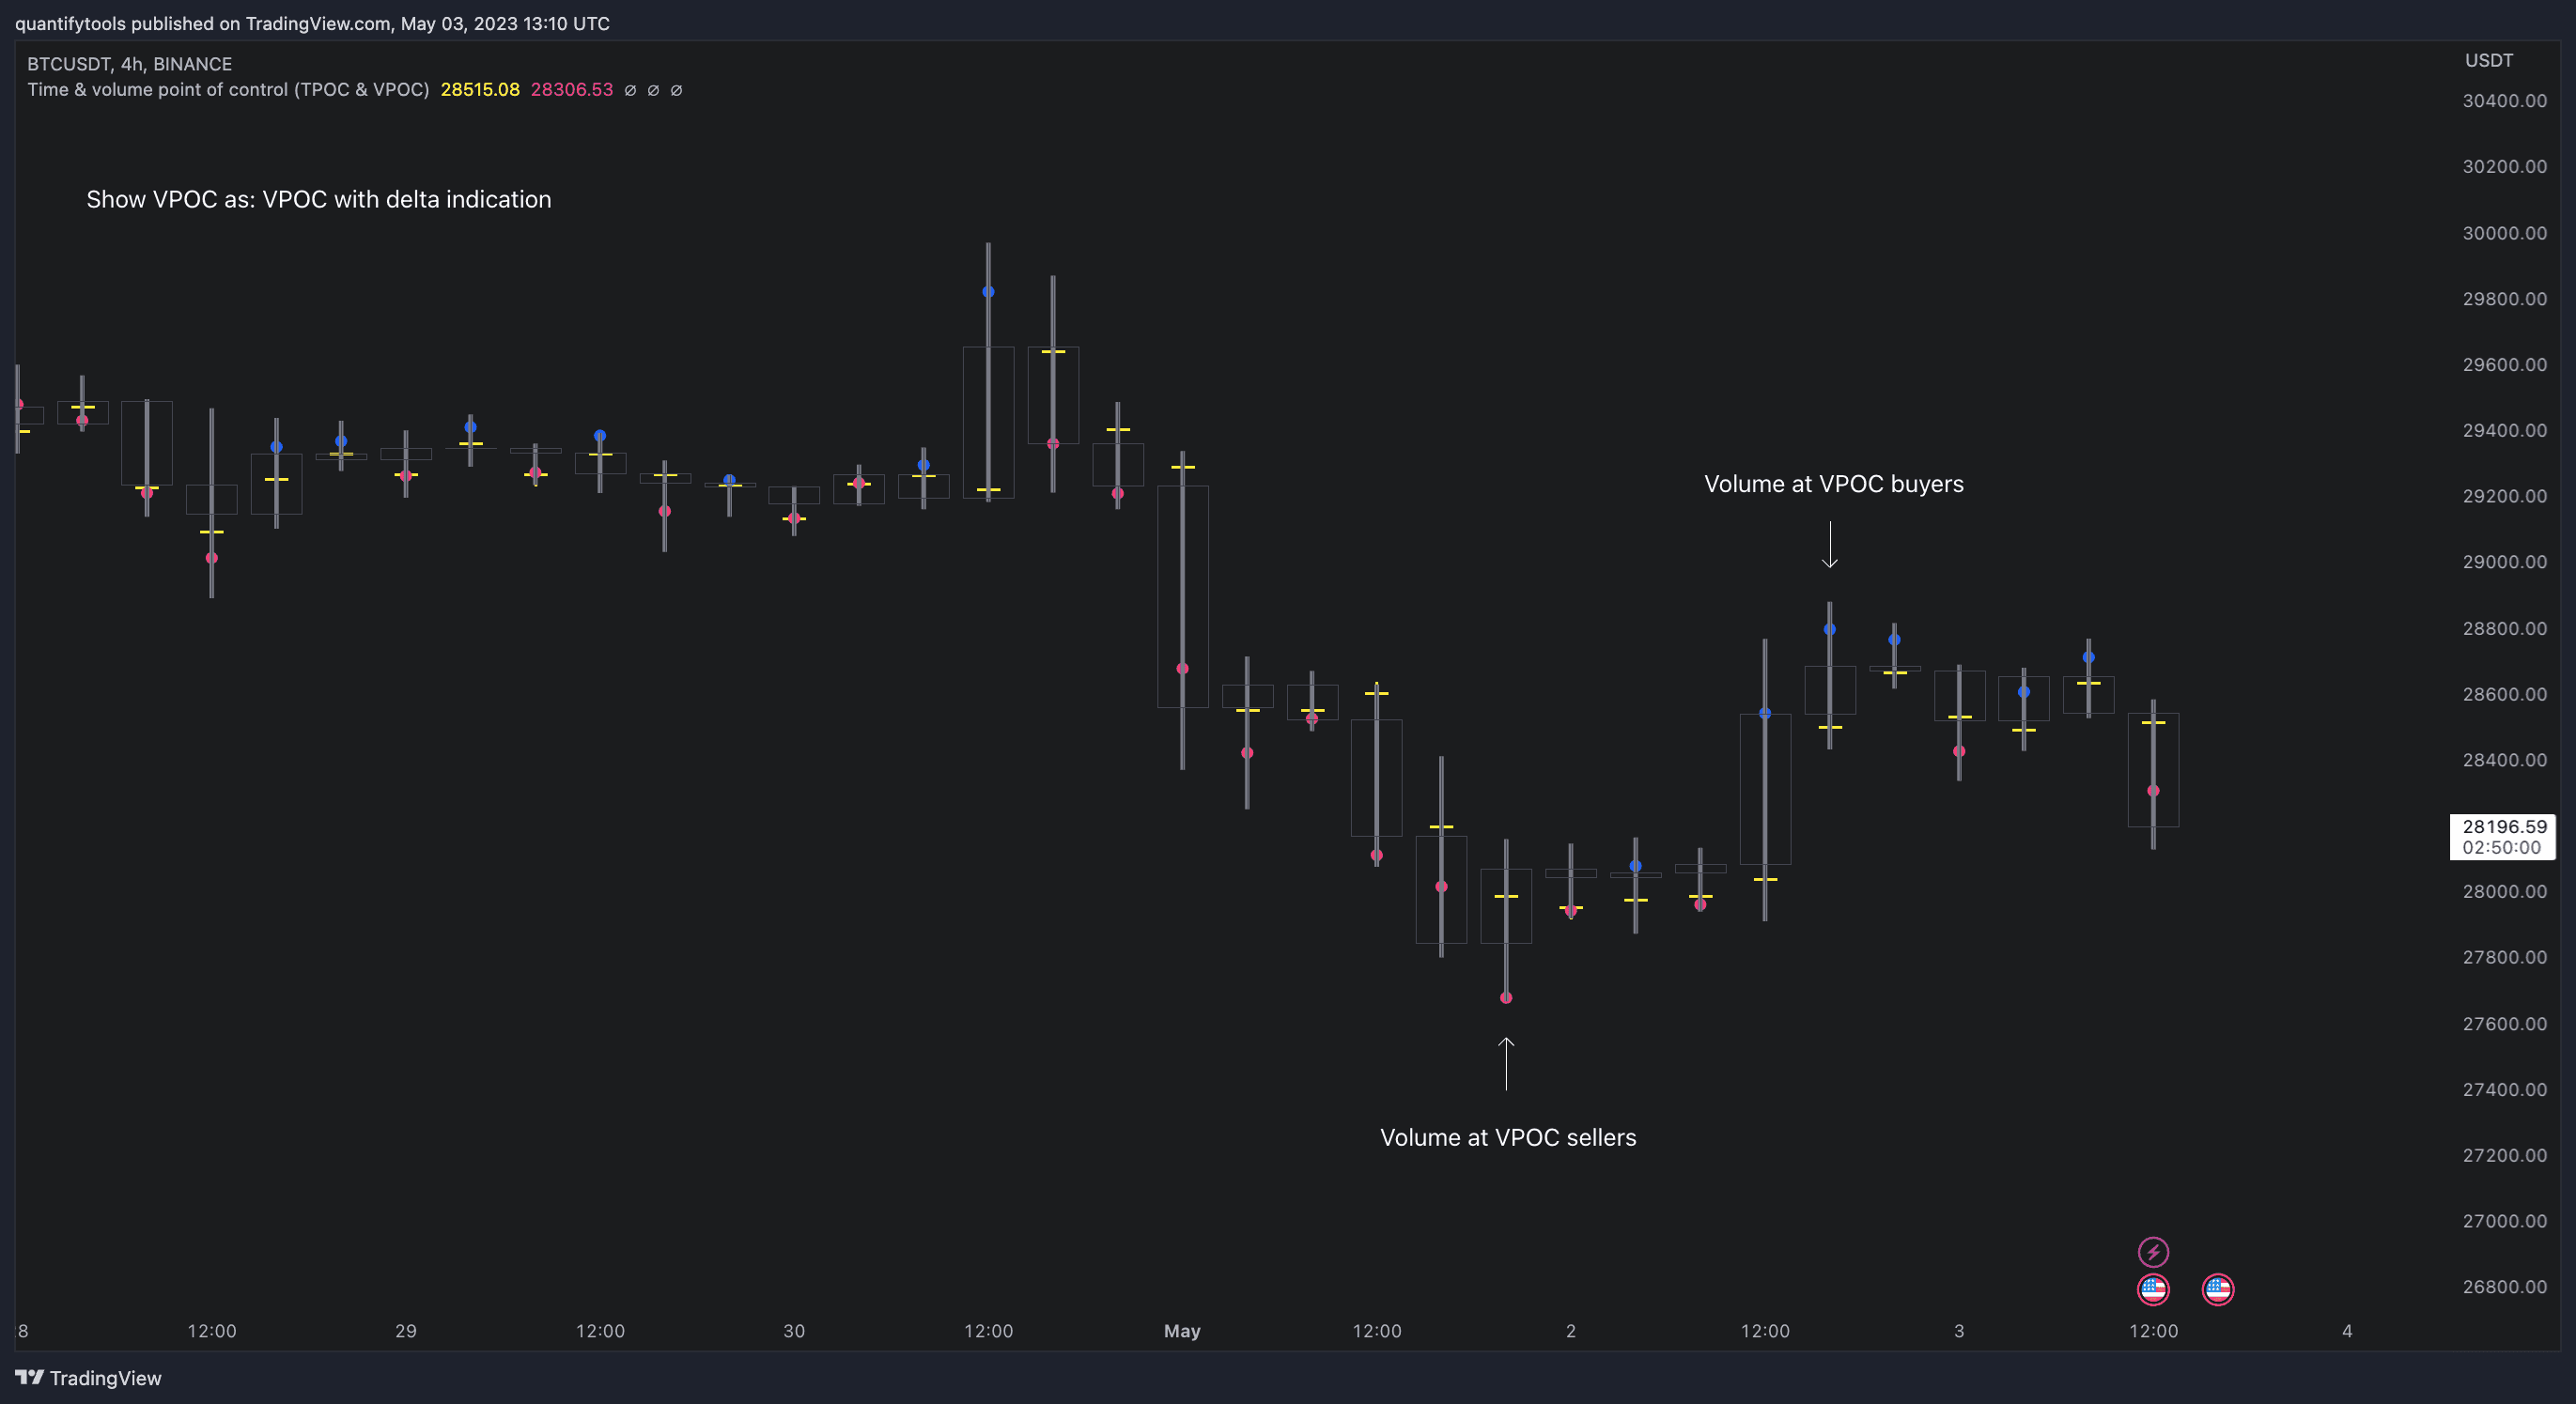
Volume delta Point of Control
This setting will distinguish volume delta (dominant side of volume, buyers or sellers) traded at Volume Point of Control and apply visuals accordingly.
Blue colors indicate buyers dominated the POC, red colors indicate sellers dominated.
Alerts
Both trend initiation and trap signals can be used for alerts in the indicator. Users can define whether they want the just bullish, bearish or either to trigger an alert.
Key features of Time & Volume Point of Control
While the points of control are simple to detect and use, we always pack our indicators with useful extras. Here's what we did for Time and Volume Point of Control.
Extreme points of control
Volume Points of Control with unusually high volume can be highlighted with a separate color. Users can define a percentage of total volume traded at POC to trigger the highlight.
For example, setting threshold at 50% will activate a highlight whenever volume traded at VPOC or time traded at TPOC is equal to or greater than 50% of all volume/time traded.
This feature is useful for identifying when traders are showing extremely high interest at a single small point in price.
Trend initiation and trap signals
Users can highlight instances where the Points of Control are signalling new initiated trends (expect trend continuation) and trapped traders (expect trend reversal).
These concepts will be covered further below.
Volume delta Point of Control
This setting will distinguish volume delta (dominant side of volume, buyers or sellers) traded at Volume Point of Control and apply visuals accordingly.
Blue colors indicate buyers dominated the POC, red colors indicate sellers dominated.
Alerts
Both trend initiation and trap signals can be used for alerts in the indicator. Users can define whether they want the just bullish, bearish or either to trigger an alert.
How to trade with Time & Volume Point of Control
Time and volume point of control are considered key elements of Auction Market Theory and orderflow..
This information can be used to identify ideal environments for reversals as well as trend continuation.
Let's explore a few practical examples.
Detecting trapped traders
One or both points of control at one end of candle range (wick tail) and candle close at the other end serves as an indication of market participants trapped in an awkward position.
This tells us price traded a lot of time and volume at a location that was rejected, meaning the traders putting in the time and volume are now at an immediate loss.
When price runs away further from these trapped participants, they are eventually forced to cover and drive price even further to the opposite direction.

Spotting trend initiations
A large move that leaves time point of control behind while volume point of control is supportive serves as an indication of a trend initiation.
Essentially, this is one way to identify an event where price traded sideways most of the time and suddenly moved away with volume.
This kind of move has an element of "surprise", ideal for fresh trends.

Detecting consistent trends using POC
A trend is healthy when it's supported by a point of control. Ideally you want to see either time or volume supporting a trend.

How to trade with Time & Volume Point of Control
Time and volume point of control are considered key elements of Auction Market Theory and orderflow..
This information can be used to identify ideal environments for reversals as well as trend continuation.
Let's explore a few practical examples.
Detecting trapped traders
One or both points of control at one end of candle range (wick tail) and candle close at the other end serves as an indication of market participants trapped in an awkward position.
This tells us price traded a lot of time and volume at a location that was rejected, meaning the traders putting in the time and volume are now at an immediate loss.
When price runs away further from these trapped participants, they are eventually forced to cover and drive price even further to the opposite direction.
Spotting trend initiations
A large move that leaves time point of control behind while volume point of control is supportive serves as an indication of a trend initiation.
Essentially, this is one way to identify an event where price traded sideways most of the time and suddenly moved away with volume.
This kind of move has an element of "surprise", ideal for fresh trends.
Detecting consistent trends using POC
A trend is healthy when it's supported by a point of control. Ideally you want to see either time or volume supporting a trend.
Get Time & Volume Point of Control on TradingView
Time & Volume Point of Control works by simply adding it to your chart on TradingView, no installations or configurations needed.
Open any chart on TradingView and click Indicators tab on top menu.
Search "Flowly" and click an indicator to add to your chart.
Can't find the indicator? Find full guide:
How to add indicators ↗
You can navigate straight to the indicator page here:
Time & volume POC on TradingView ↗
But wait… there's more
We have more volume and orderflow indicators for free to use on TradingView.
If you enjoyed this one, you'll enjoy these too (we promise). Find them here 👇


