

What are imbalances?
Imbalances occur when buyers or sellers take over the market overshadowing the other side.
Also known as
Fair Value Gap (FVG), single prints, volume null, volume void, gaps
This creates a literal imbalance in supply and demand, shown as an expansive move to upside or downside.
Imbalance is considered to be in that area where price did not spend time to trade properly and therefore efficiently.
Due to inherent competitive and therefore efficient nature of markets, imbalances tend to sooner or later "rebalance" by trading again in the area.
What is balance then?
In contrast to imbalance, balance is where buyers and sellers are at equilibrium. A state of balance does the opposite - price trades efficiently with no side holding clear upper hand. This results in a ranging price.
Price always exists either as imbalance or balance - trending or ranging.
Bullish and bearish imbalances
Imbalances are classically divided into bullish and bearish, depending on the dominating side.
Bullish imbalances refer to buy-side imbalances (upside), whereas bearish to sell-side imbalances (downside)
Bullish imbalance | Bearish imbalance |
|---|---|
Expansion upside | Expansion downside |
Mostly buyers | Mostly sellers |
Both bullish and bearish imbalances have implications as to what to expect price do next, but many factors play into this.
To predict the implications of an imbalance, traders need to seek confluence from other types of analysis, such as recent price action, volume, indicators and market regime.
Different types of imbalances
Imbalances manifest in various forms, some being less obvious than others. Despite their various forms, imbalances are fundamentally due to the same supply and demand imbalance.
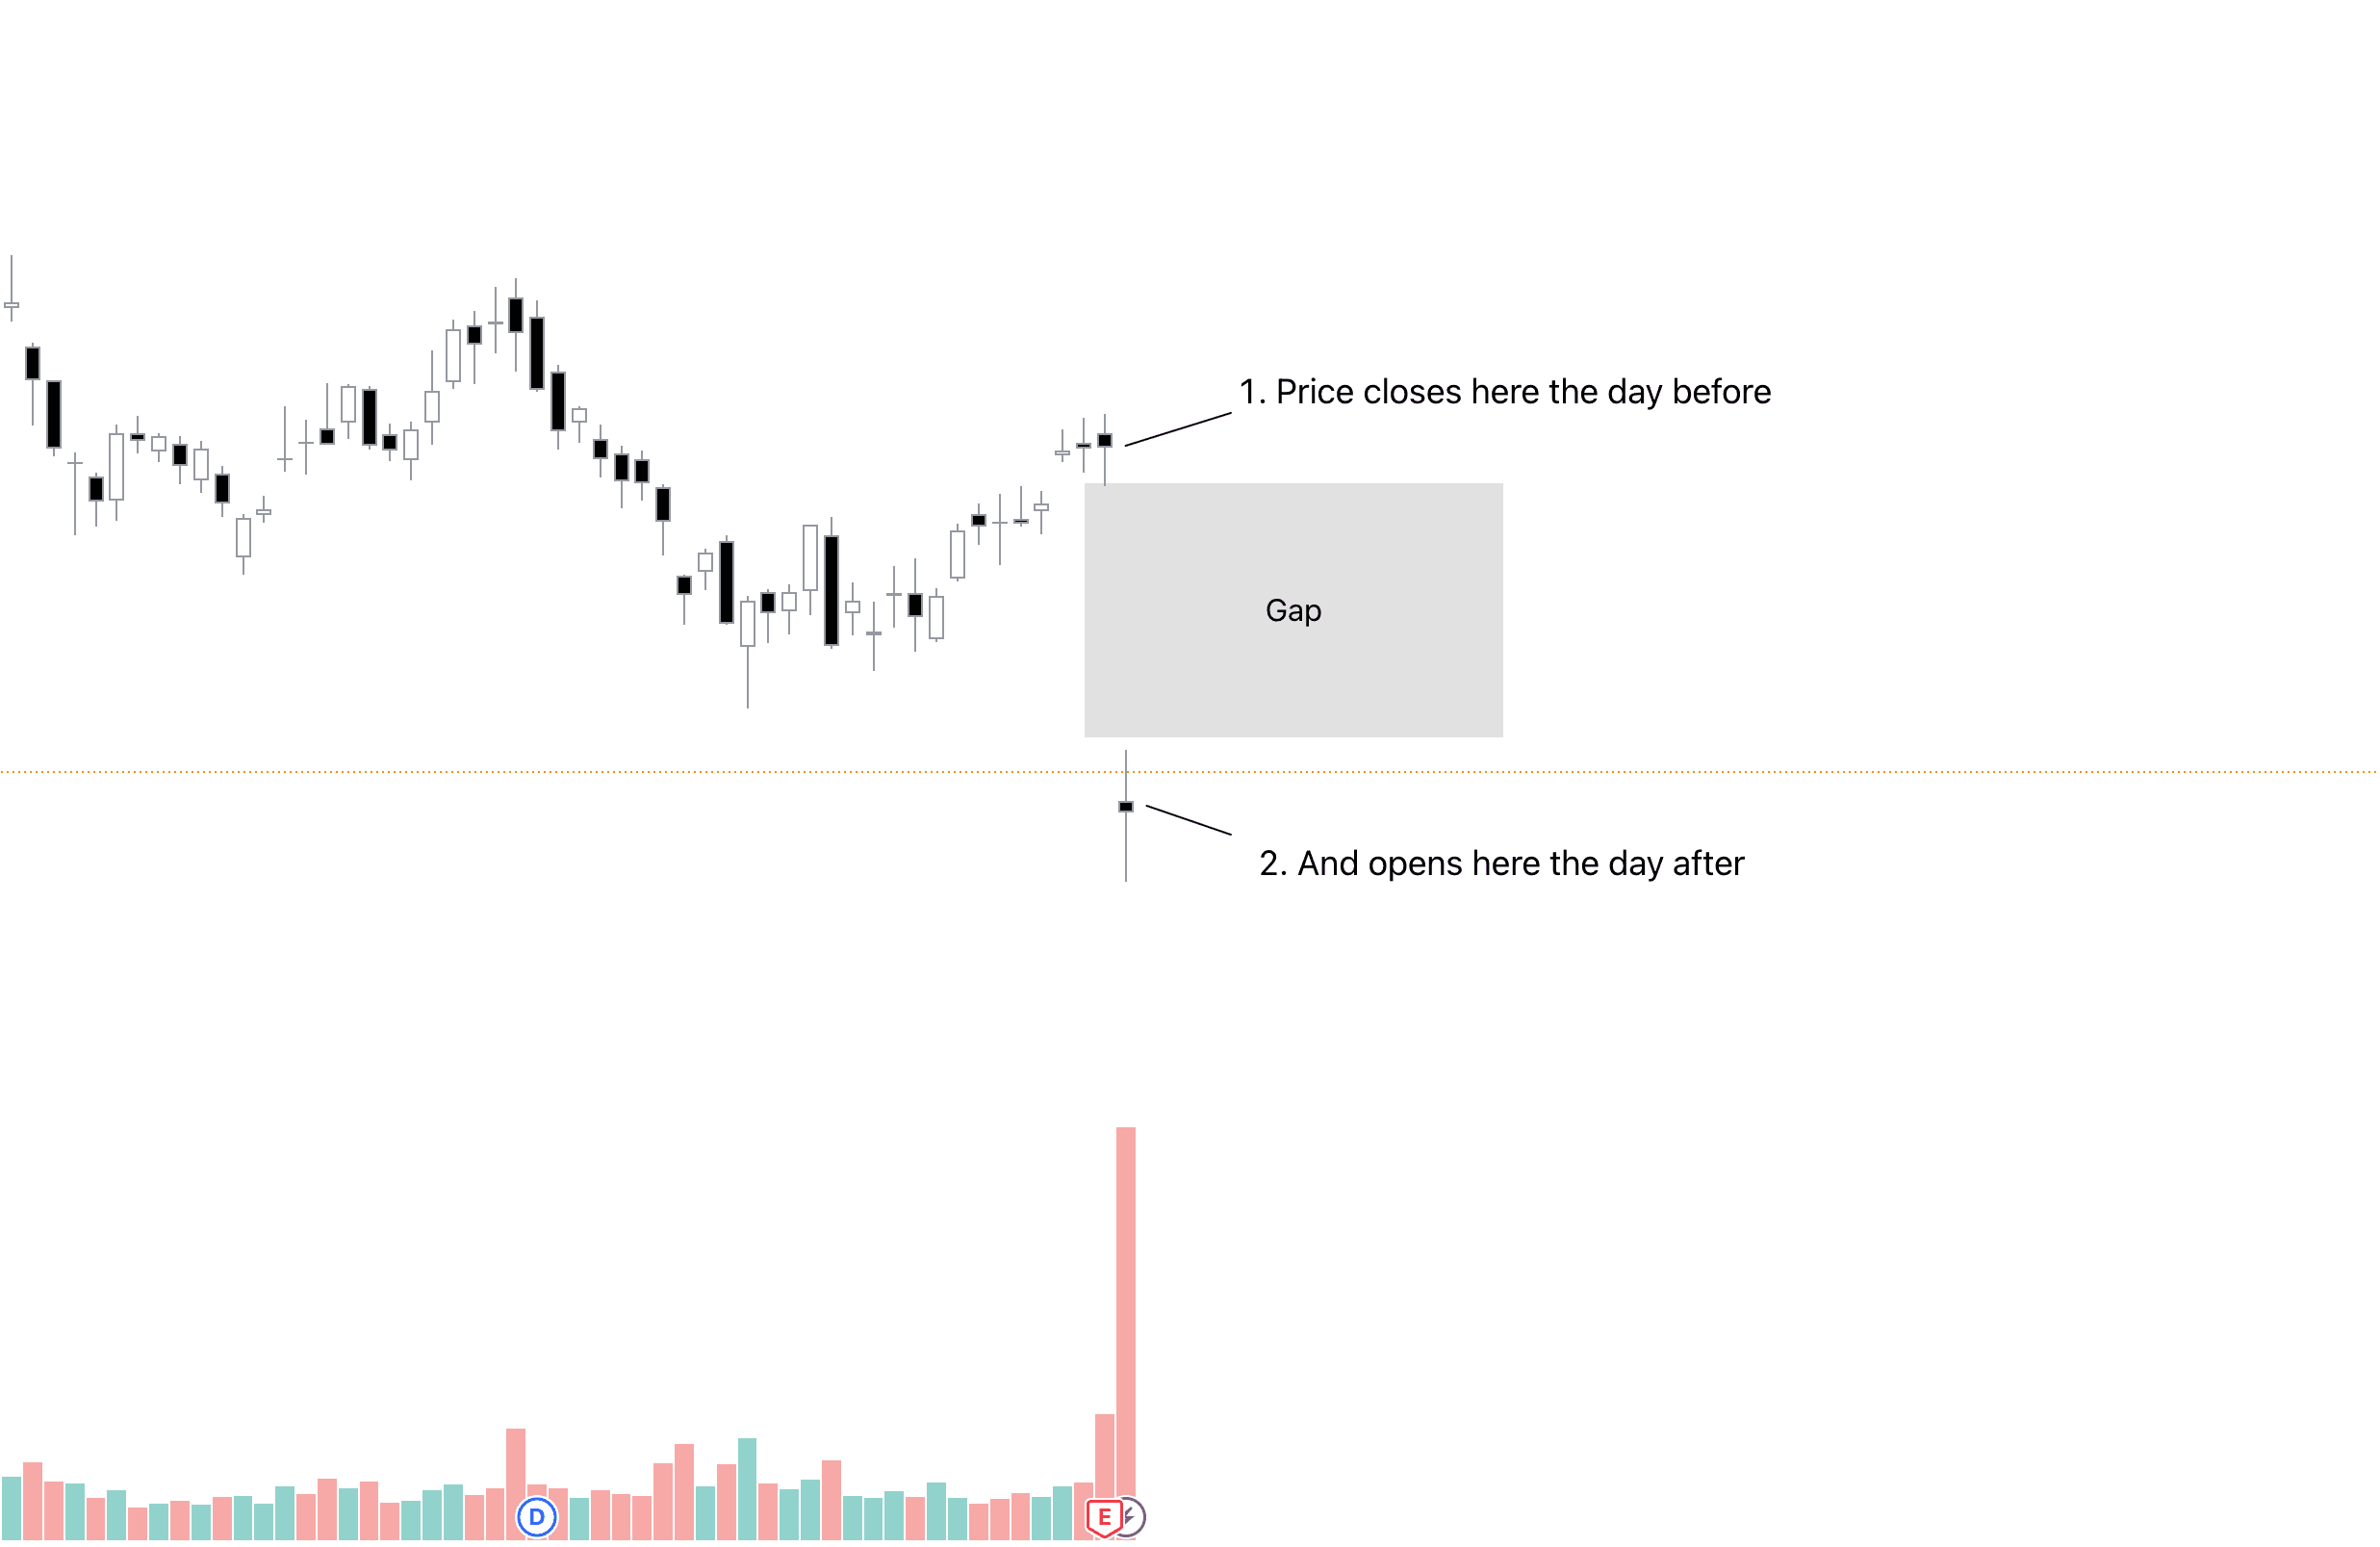
Overnight gaps
The most well known and obvious imbalance is overnight gaps (usually referred to as just gaps).
This happens when a stock opens significantly higher or lower than close of the previous trading day. Here's what that looks like.
It might not be very surprising to find out that this looks like a literal gap. Poof, just air.
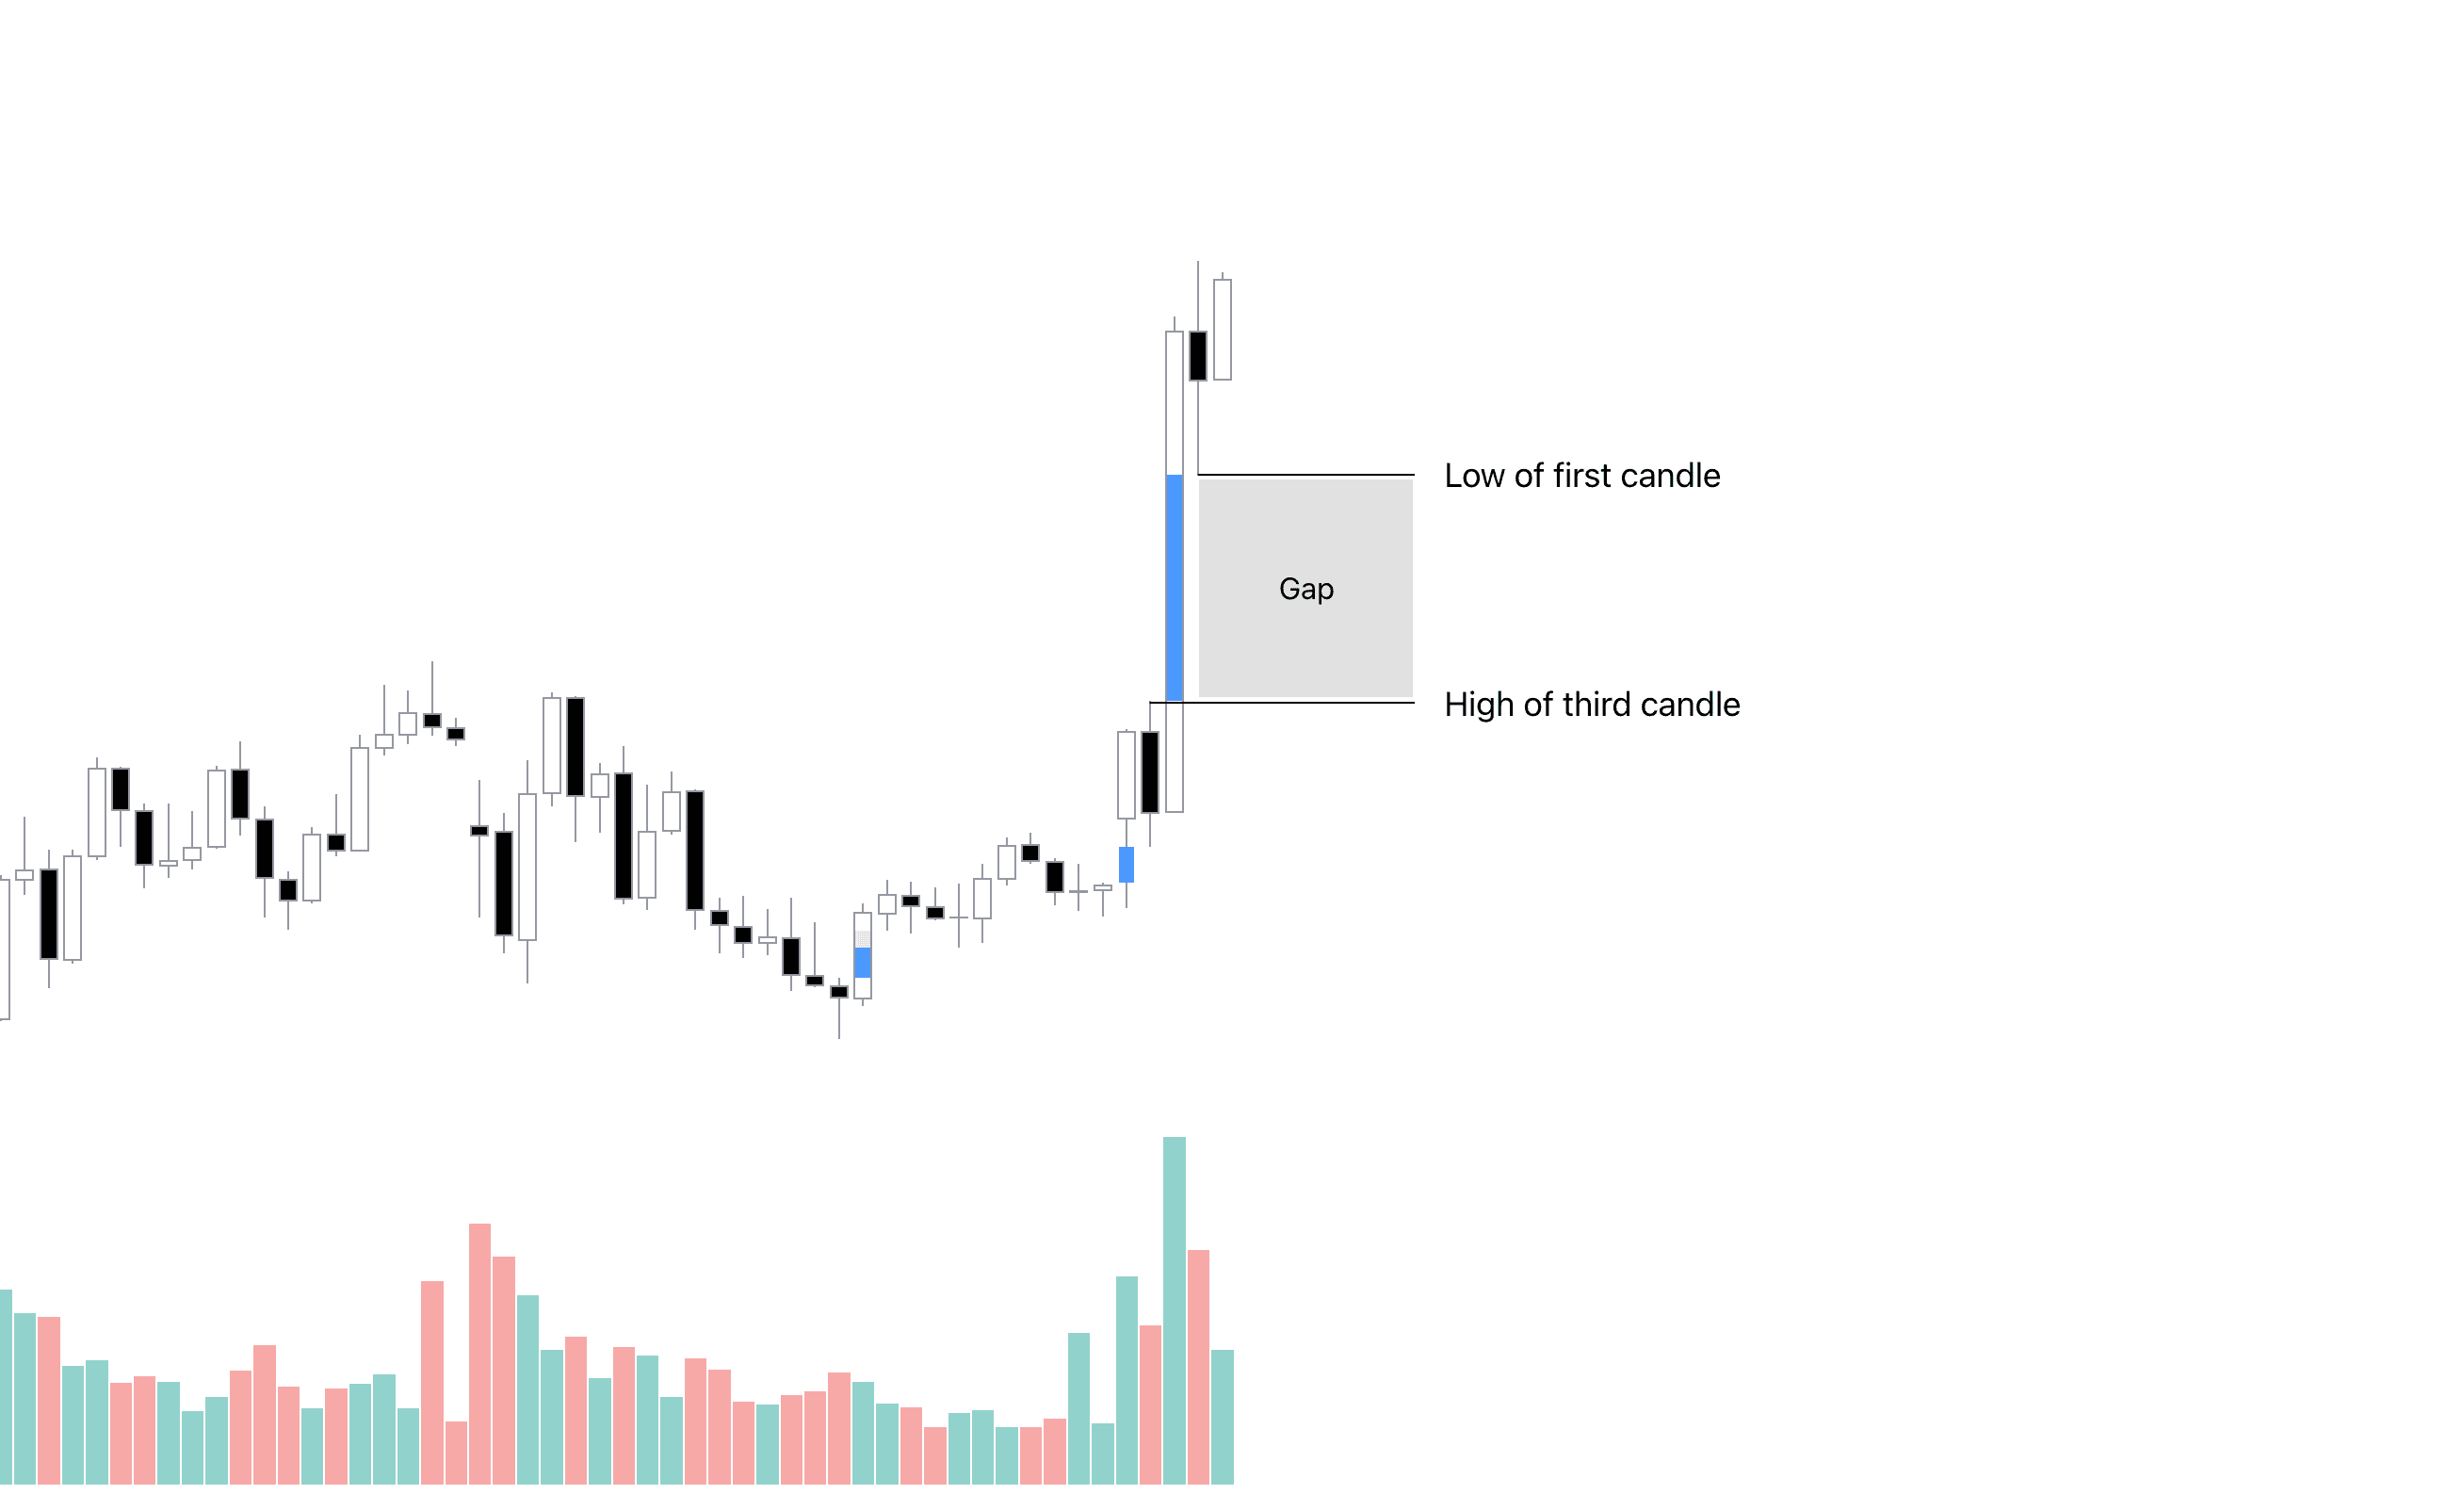
Fair value gaps
Less obvious, but equally imbalanced, are the ones that occur during trading day. These type of imbalances are most often referred to as a fair value gaps.
We can detect this pattern by looking for highs and lows of first and third candle that don't touch.
Here's what it looks like and also what the indicator highlights, visualized using a blue line.
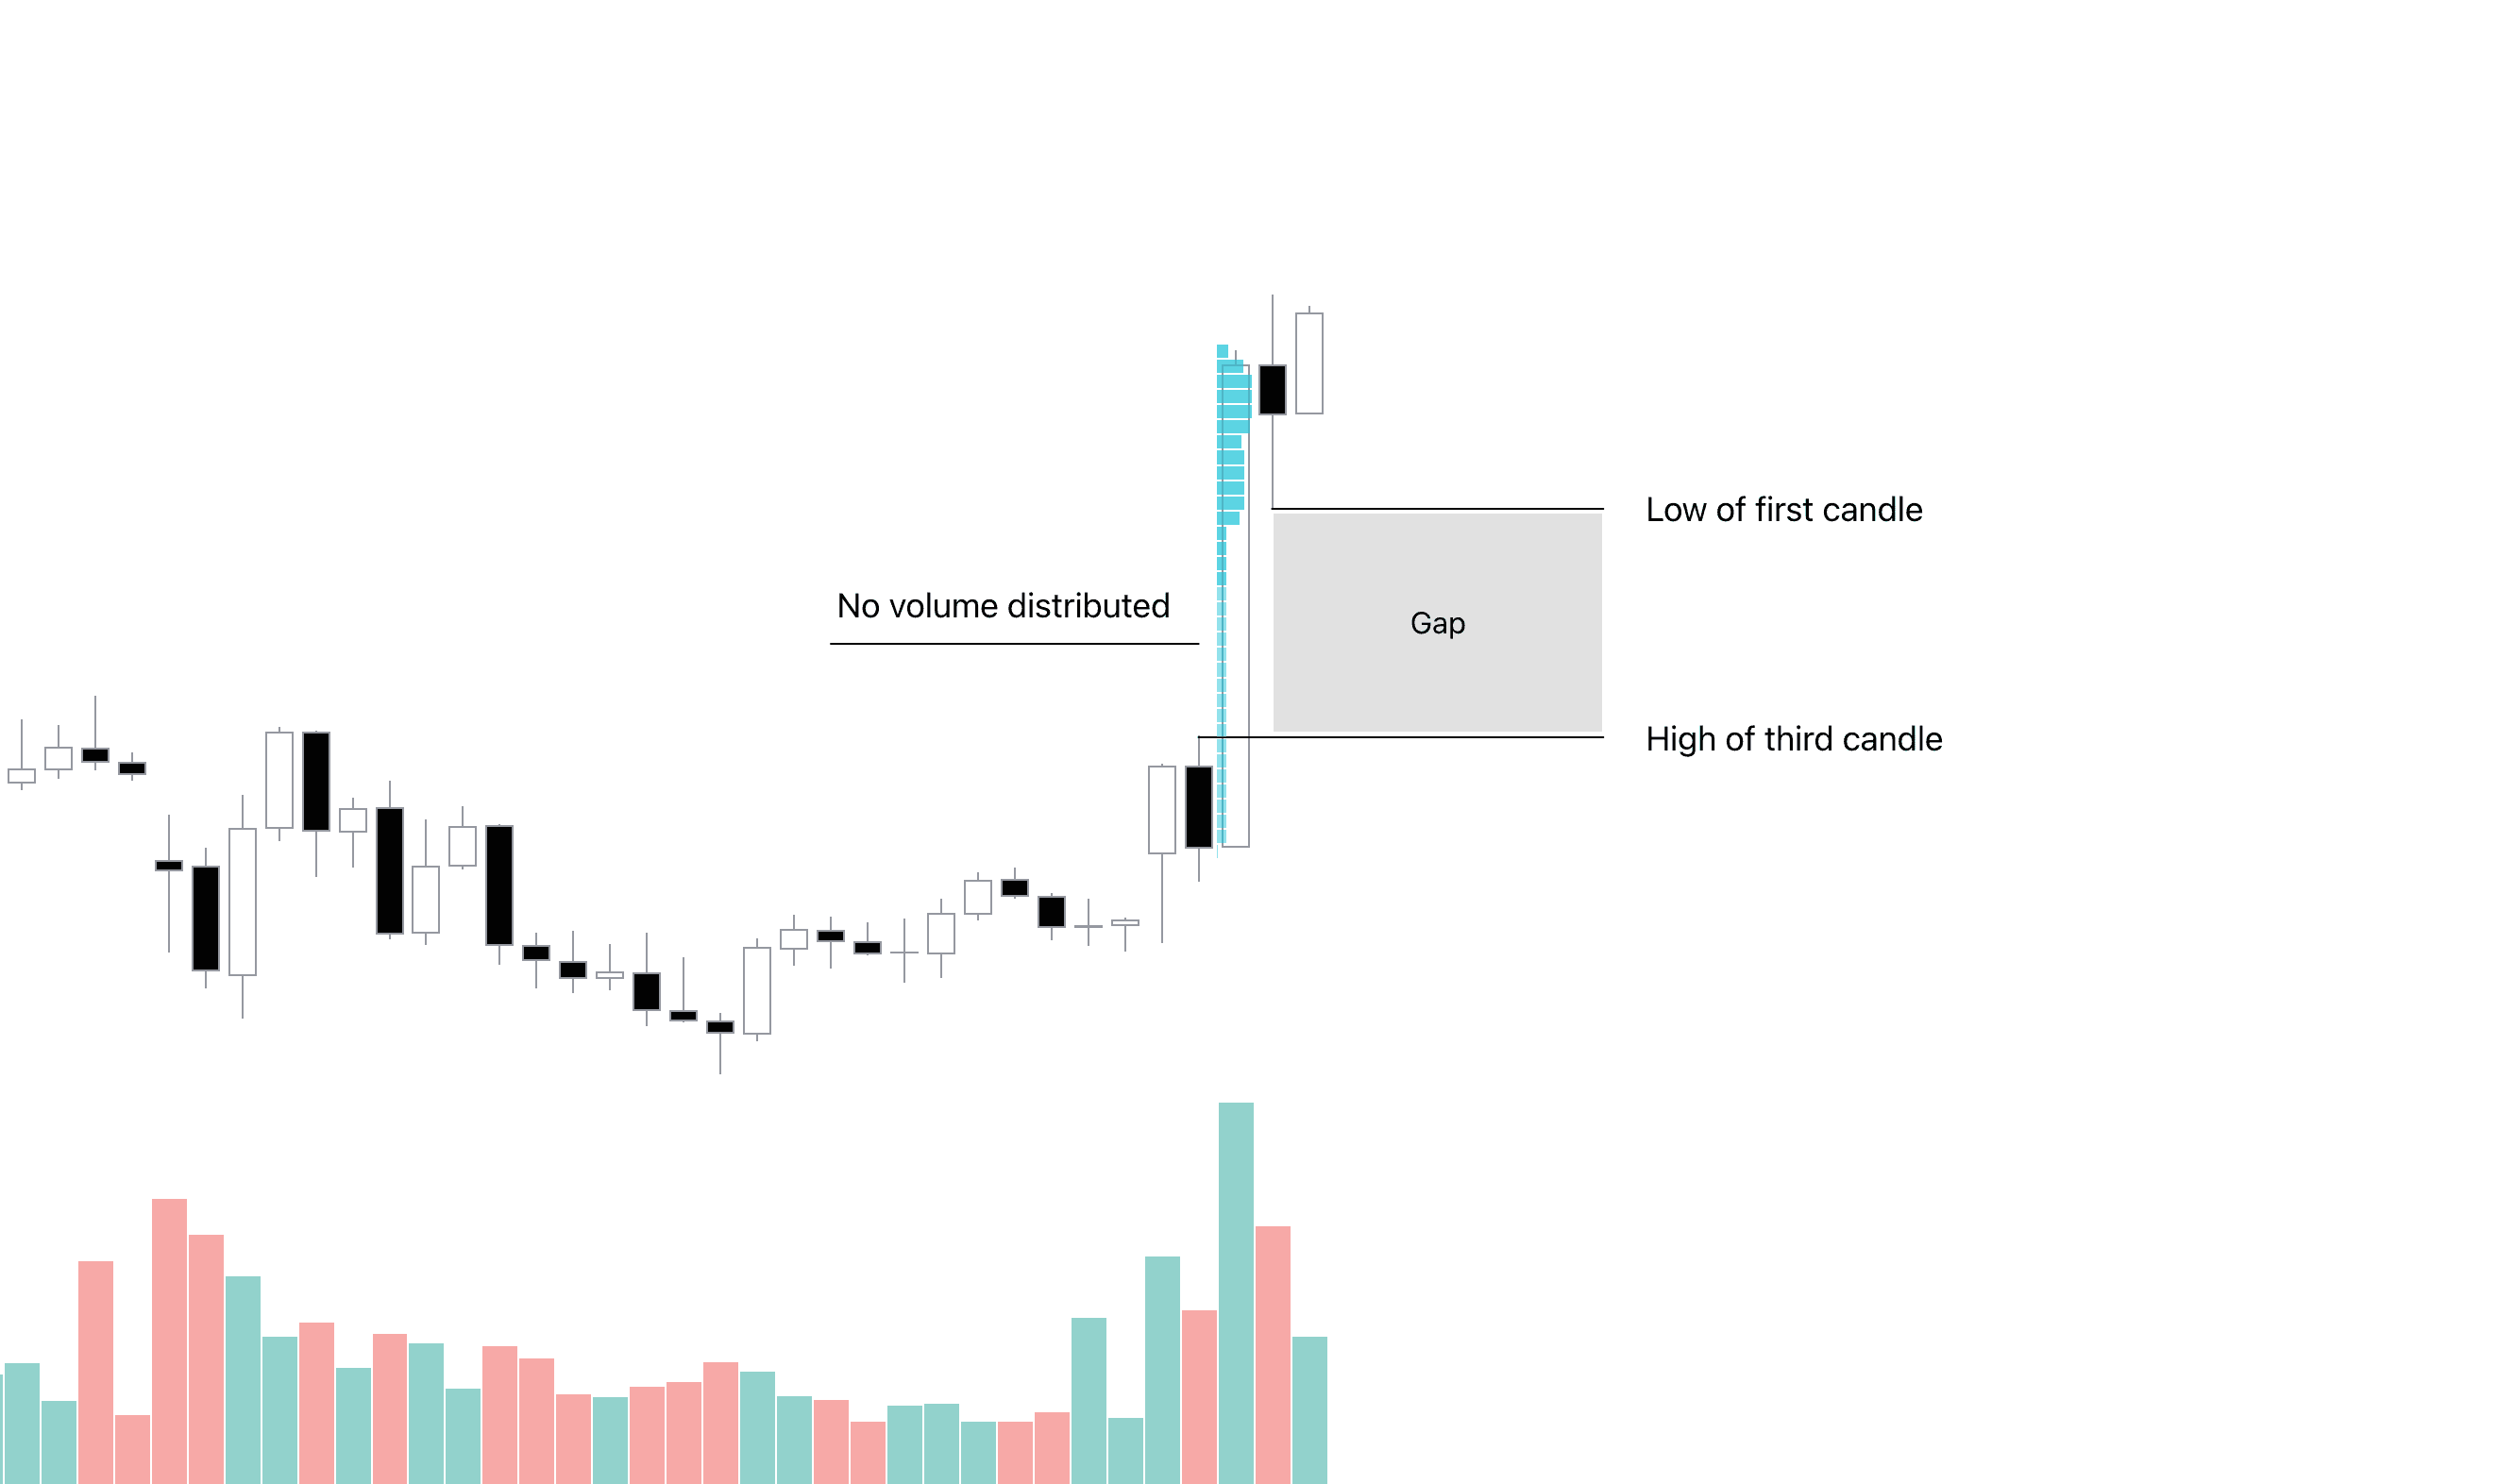
Imbalances speak of volume
Counterintuitively, this price pattern actually tells us more about volume. Price is in fact always a visualization and a story of how volume moved in markets.
Either way, it is fundamentally volume that is imbalanced within a gap, which we can easily see ourself using a volume profile. Volume profile is a tool showing us how volume distributed inside a trading candle.
At imbalances, we can note there is a significant lack of traded volume at the location of the gap.
What are imbalances?
Imbalances occur when buyers or sellers take over the market overshadowing the other side.
Also known as
Fair Value Gap (FVG), single prints, volume null, volume void, gaps
This creates a literal imbalance in supply and demand, shown as an expansive move to upside or downside.
Imbalance is considered to be in that area where price did not spend time to trade properly and therefore efficiently.
Due to inherent competitive and therefore efficient nature of markets, imbalances tend to sooner or later "rebalance" by trading again in the area.
What is balance then?
In contrast to imbalance, balance is where buyers and sellers are at equilibrium. A state of balance does the opposite - price trades efficiently with no side holding clear upper hand. This results in a ranging price.
Price always exists either as imbalance or balance - trending or ranging.
Bullish and bearish imbalances
Imbalances are classically divided into bullish and bearish, depending on the dominating side.
Bullish imbalances refer to buy-side imbalances (upside), whereas bearish to sell-side imbalances (downside)
Bullish imbalance | Bearish imbalance |
|---|---|
Expansion upside | Expansion downside |
Mostly buyers | Mostly sellers |
Both bullish and bearish imbalances have implications as to what to expect price do next, but many factors play into this.
To predict the implications of an imbalance, traders need to seek confluence from other types of analysis, such as recent price action, volume, indicators and market regime.
Different types of imbalances
Imbalances manifest in various forms, some being less obvious than others. Despite their various forms, imbalances are fundamentally due to the same supply and demand imbalance.
Overnight gaps
The most well known and obvious imbalance is overnight gaps (usually referred to as just gaps).
This happens when a stock opens significantly higher or lower than close of the previous trading day. Here's what that looks like.
It might not be very surprising to find out that this looks like a literal gap. Poof, just air.
Fair value gaps
Less obvious, but equally imbalanced, are the ones that occur during trading day. These type of imbalances are most often referred to as a fair value gaps.
We can detect this pattern by looking for highs and lows of first and third candle that don't touch.
Here's what it looks like and also what the indicator highlights, visualized using a blue line.
Imbalances speak of volume
Counterintuitively, this price pattern actually tells us more about volume. Price is in fact always a visualization and a story of how volume moved in markets.
Either way, it is fundamentally volume that is imbalanced within a gap, which we can easily see ourself using a volume profile. Volume profile is a tool showing us how volume distributed inside a trading candle.
At imbalances, we can note there is a significant lack of traded volume at the location of the gap.
Key features of Imbalances
This indicator has few core features and settings to get most out of trading imbalances. On top of visually detecting the imbalances, the following features are available.
Imbalance fill point
Users can choose a custom fill point for the imbalances where imbalance is "filled" and no longer considered valid.
Available values are 25%, 50%, 75% and 100%.
Example
At 50%, price filling half of imbalance is considered as successful rebalancing.
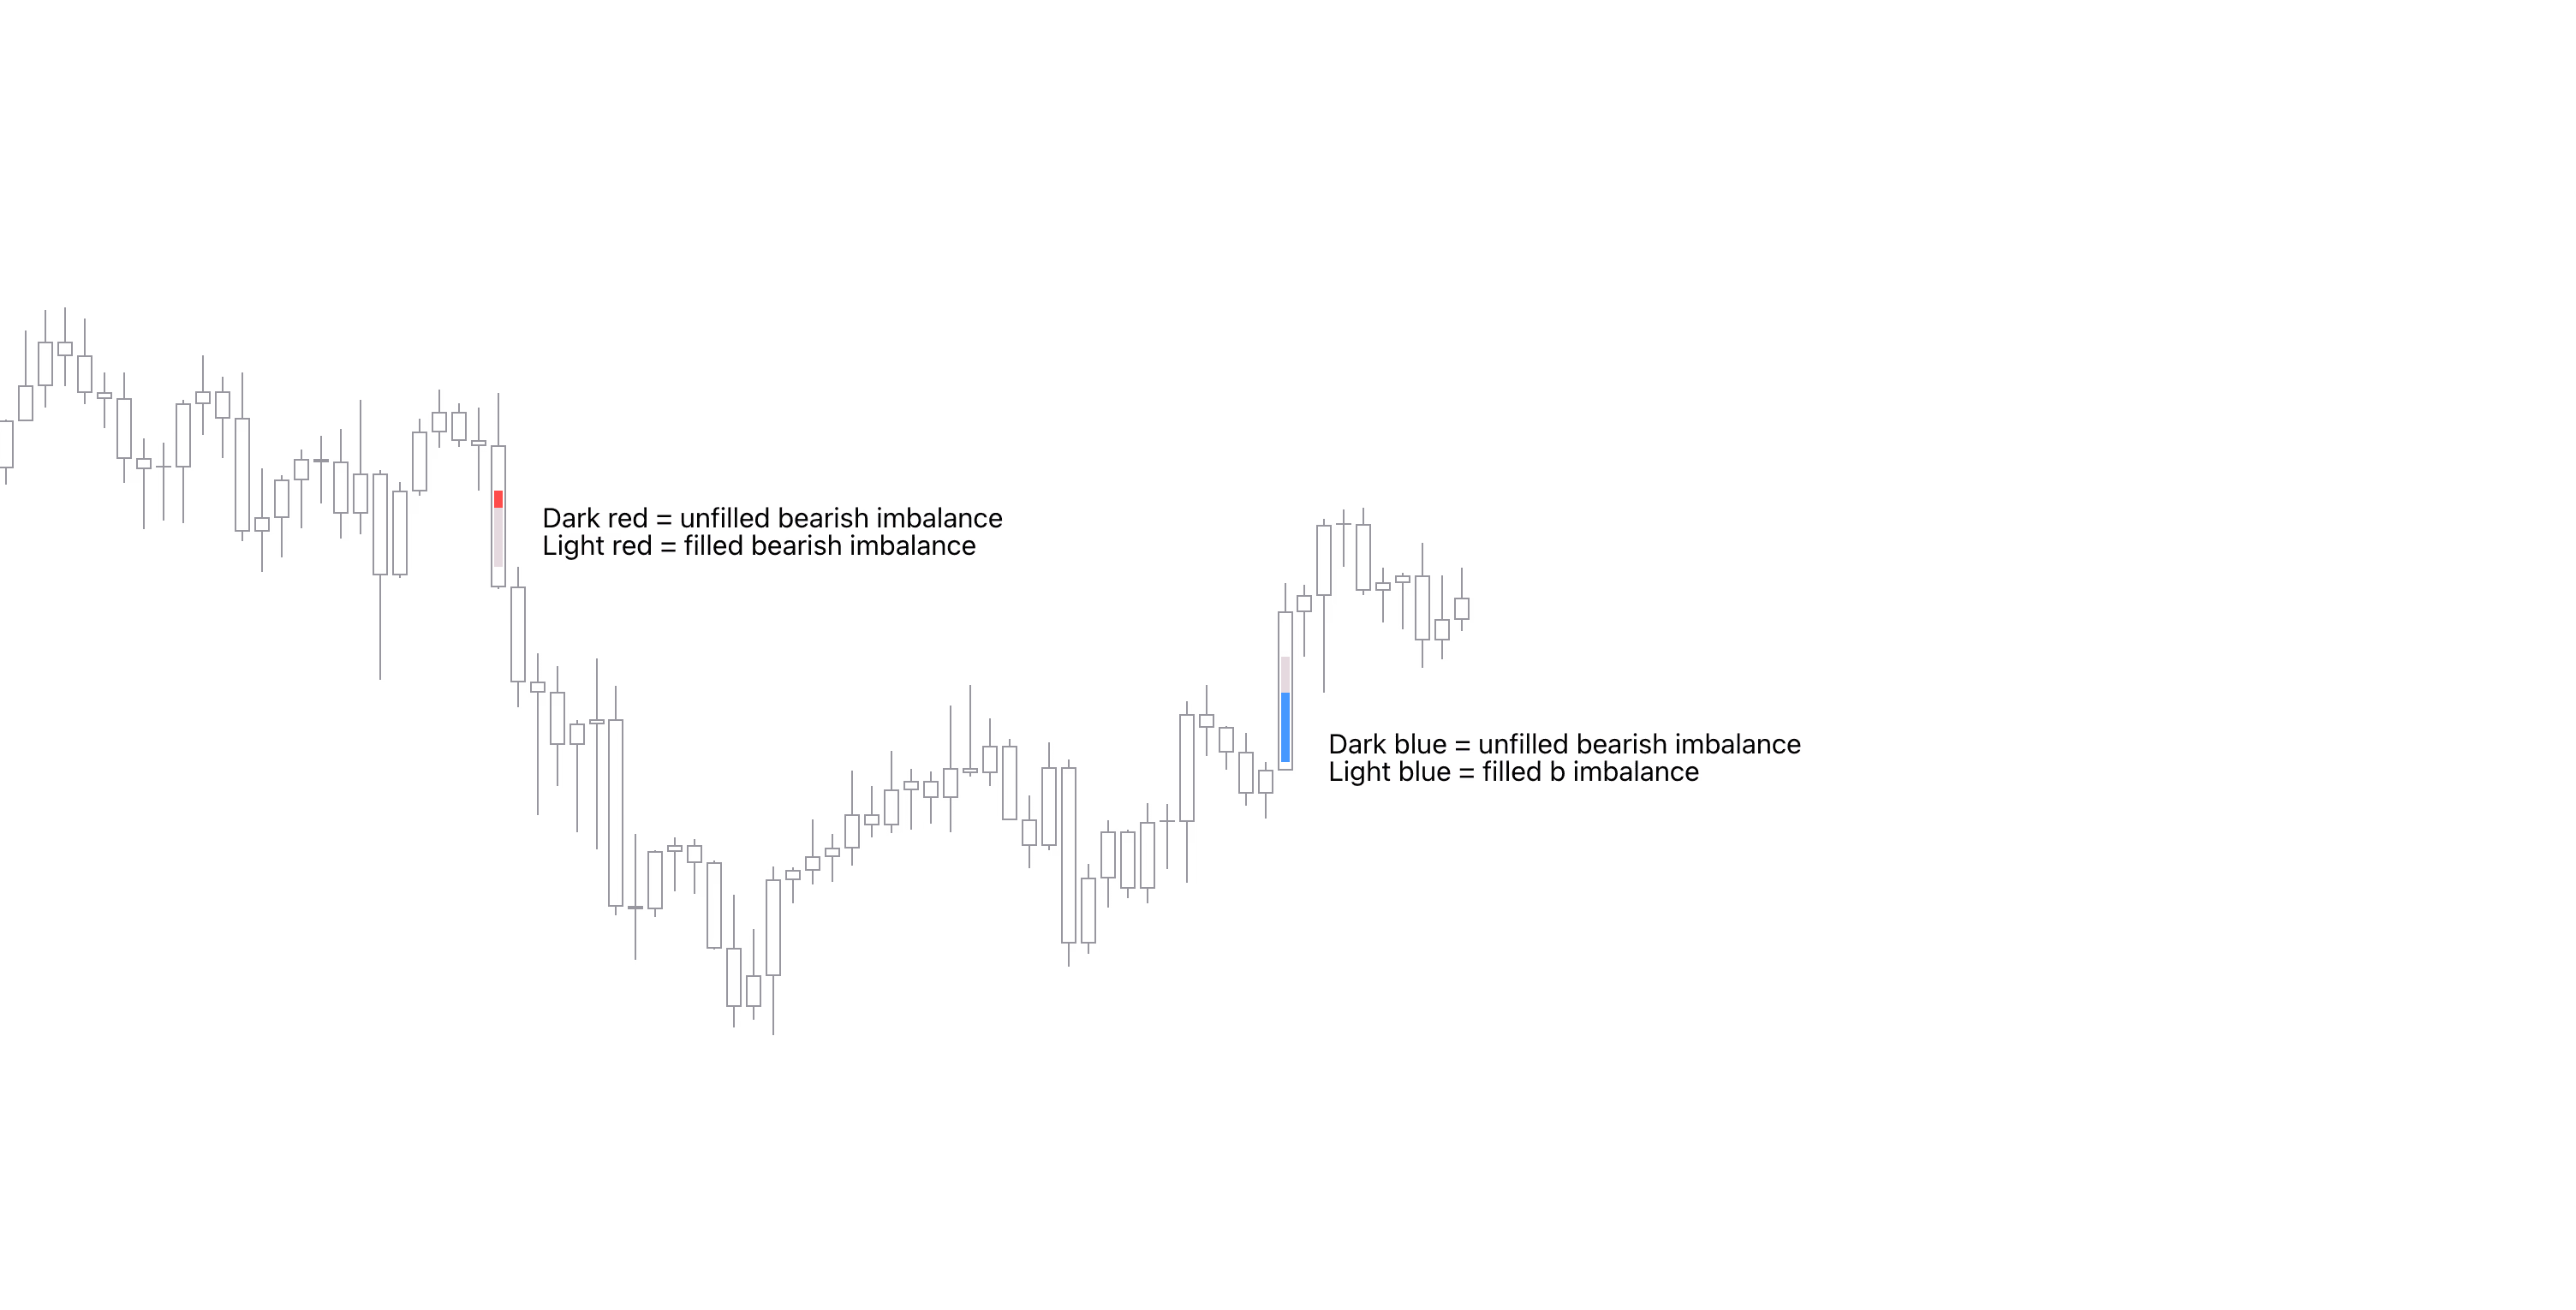
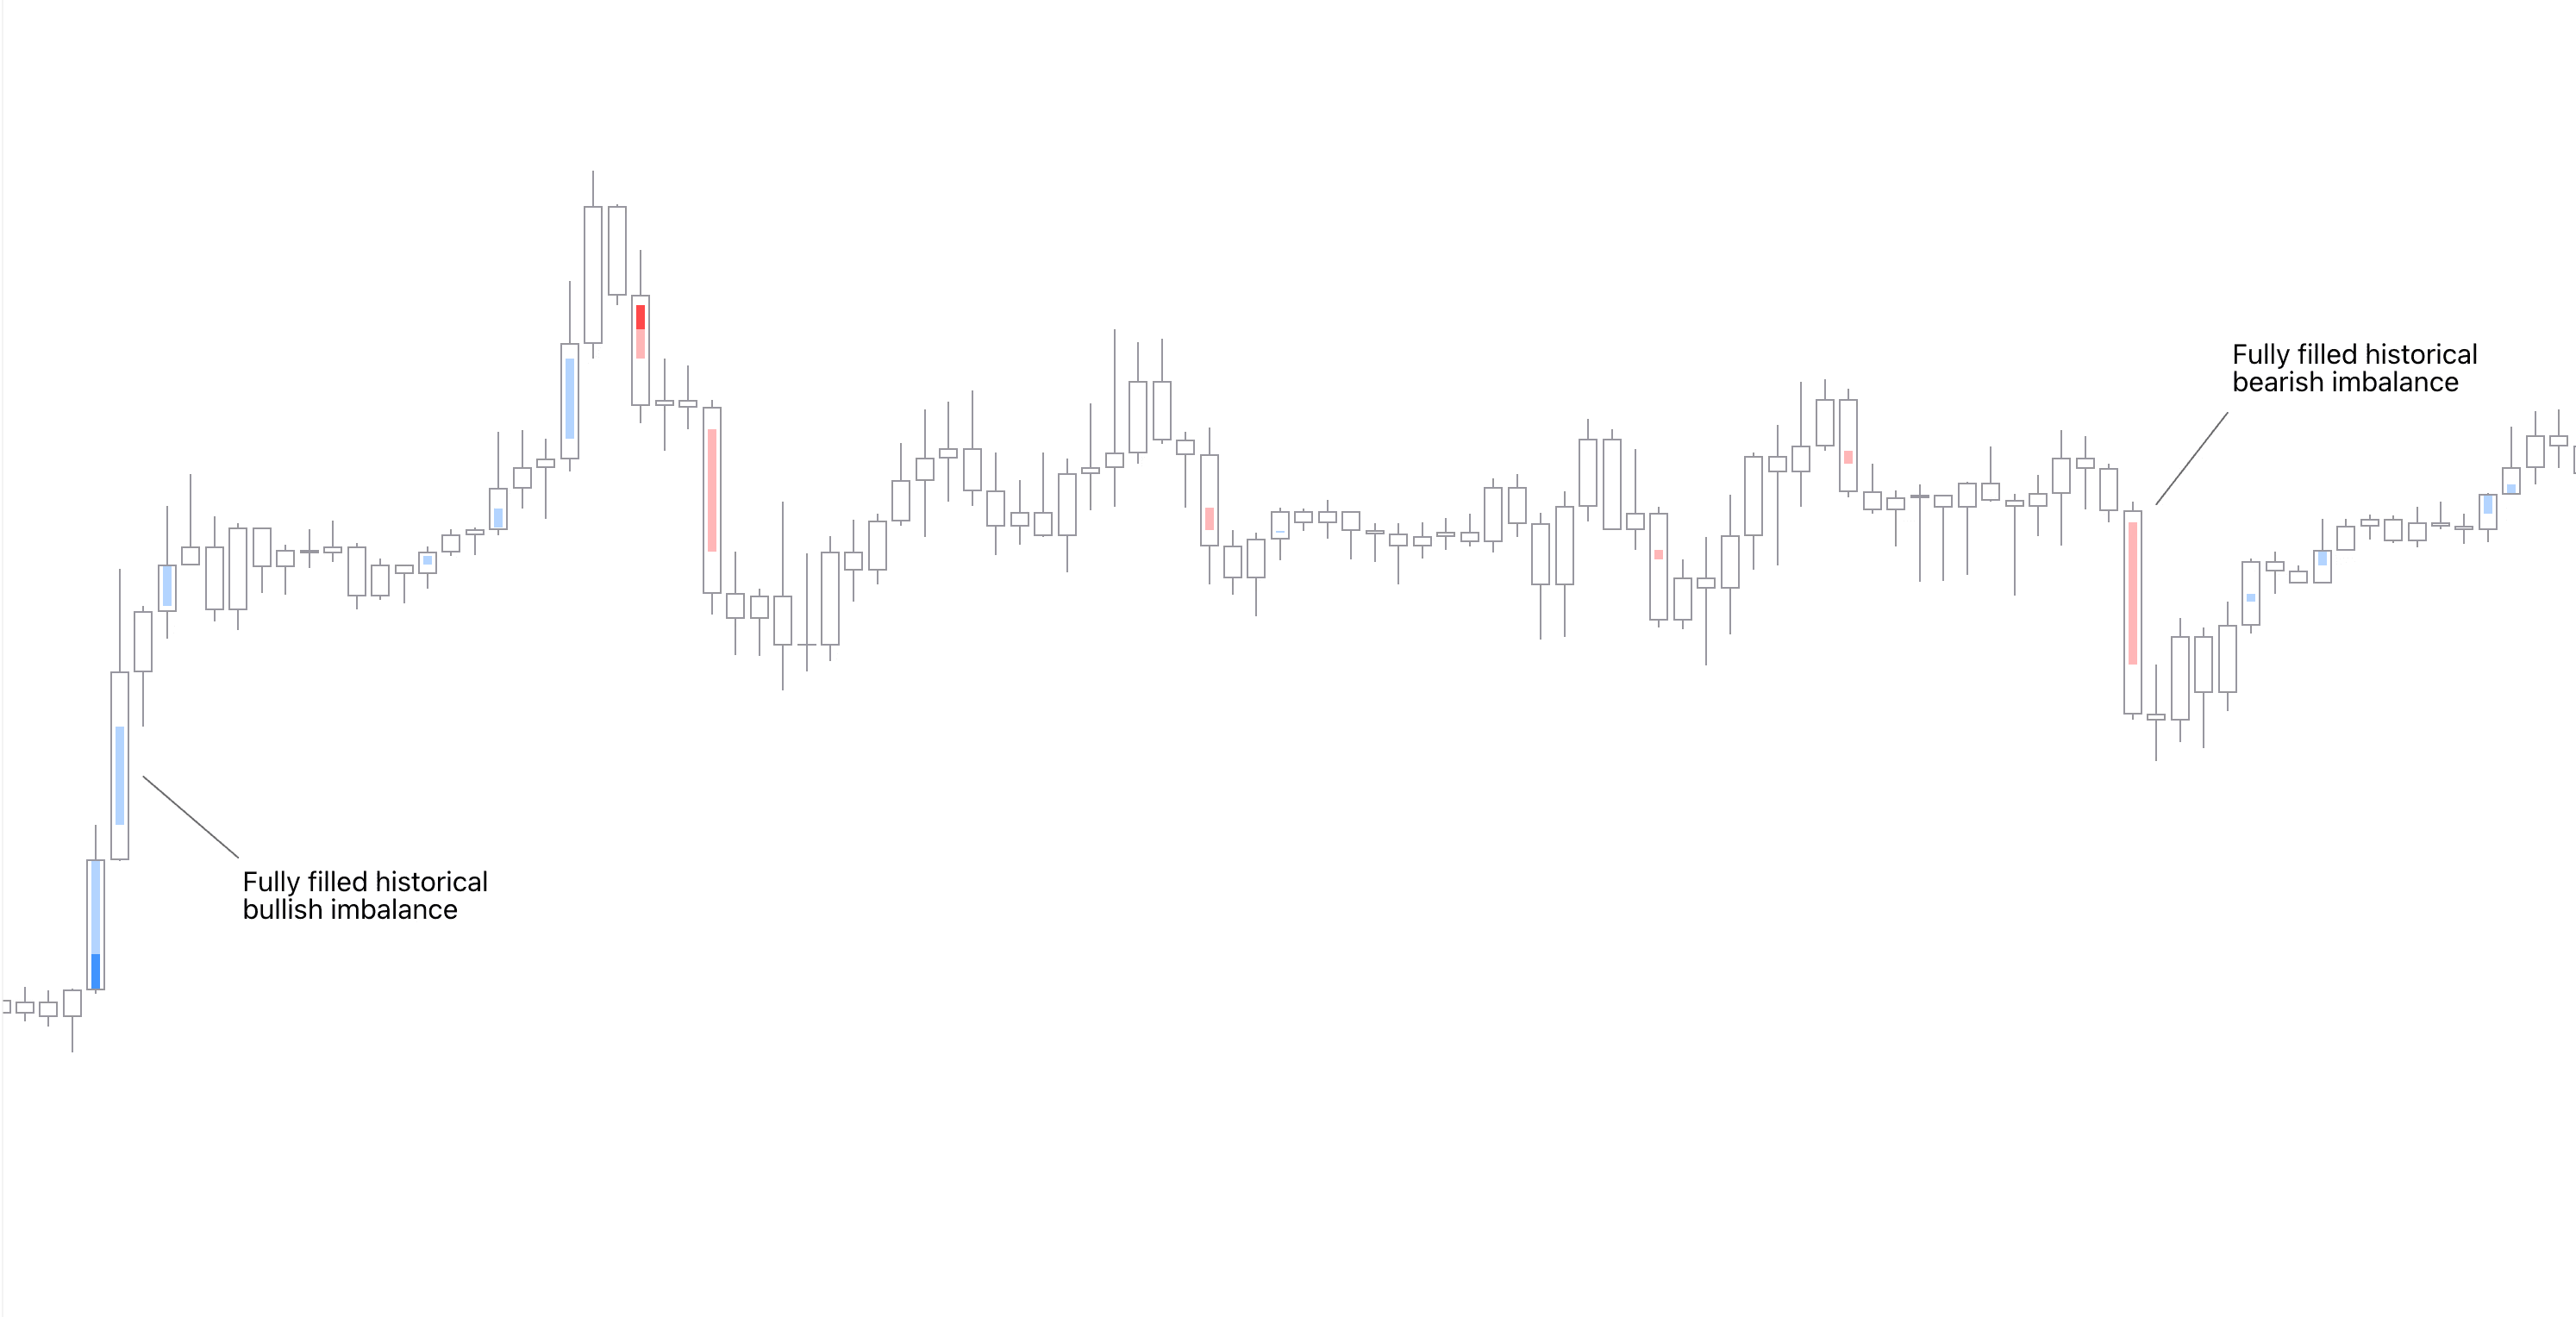
Extended imbalances
Imbalances that have yet to fully fill can be extended forward, revealing their filled and unfilled parts accordingly.
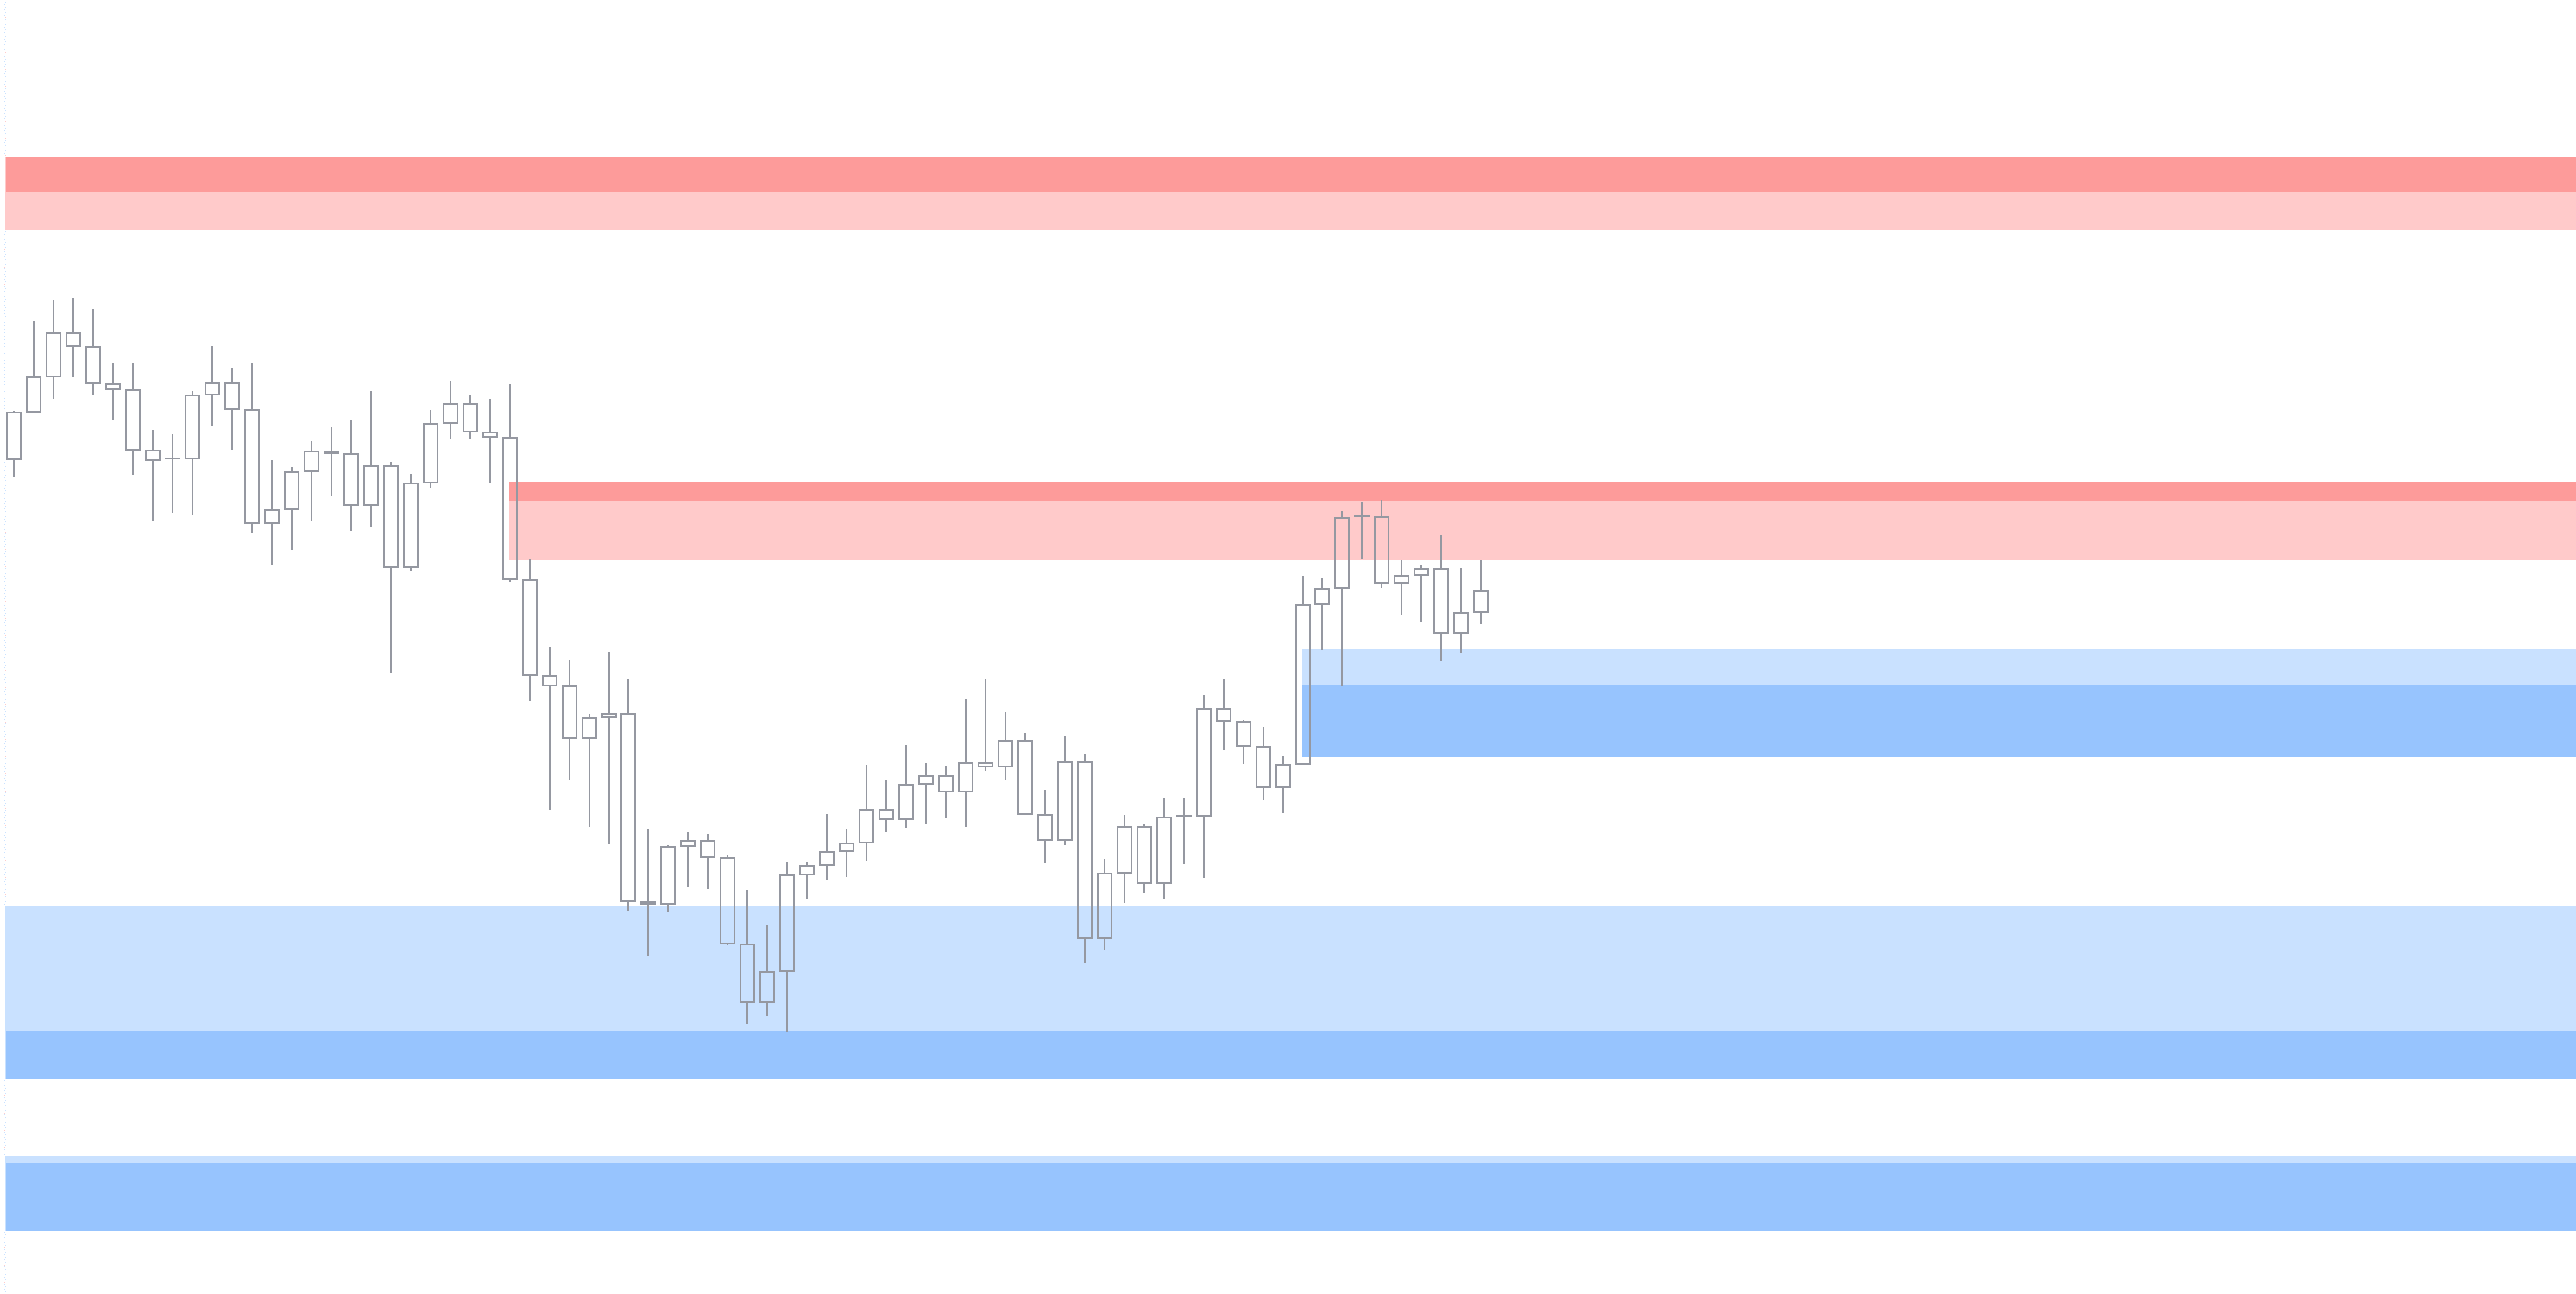
Conditional visibility
The indicator can be set to show only unfilled imbalances or both unfilled and filled. Users can also hide all imbalances if needed.
Imbalance size filter
Users can set a filter for how large the imbalance needs to be to consider as valid. This setting effectively filters out tiny and irrelevant imbalances.
Controlling this setting is done using relative size of an imbalance.
Example
At 1.5, imbalance needs to be 1.5x the size of an average imbalance to qualify as valid.
Key features of Imbalances
This indicator has few core features and settings to get most out of trading imbalances. On top of visually detecting the imbalances, the following features are available.
Imbalance fill point
Users can choose a custom fill point for the imbalances where imbalance is "filled" and no longer considered valid.
Available values are 25%, 50%, 75% and 100%.
Example
At 50%, price filling half of imbalance is considered as successful rebalancing.
Extended imbalances
Imbalances that have yet to fully fill can be extended forward, revealing their filled and unfilled parts accordingly.
Conditional visibility
The indicator can be set to show only unfilled imbalances or both unfilled and filled. Users can also hide all imbalances if needed.
Imbalance size filter
Users can set a filter for how large the imbalance needs to be to consider as valid. This setting effectively filters out tiny and irrelevant imbalances.
Controlling this setting is done using relative size of an imbalance.
Example
At 1.5, imbalance needs to be 1.5x the size of an average imbalance to qualify as valid.
How to trade imbalances
Efficient markets don't like inefficiency. Sooner or later, the void must be filled with volume. Very rarely they stick without filling.
This makes imbalances particularly great for timing and targeting both trade entries and exits.
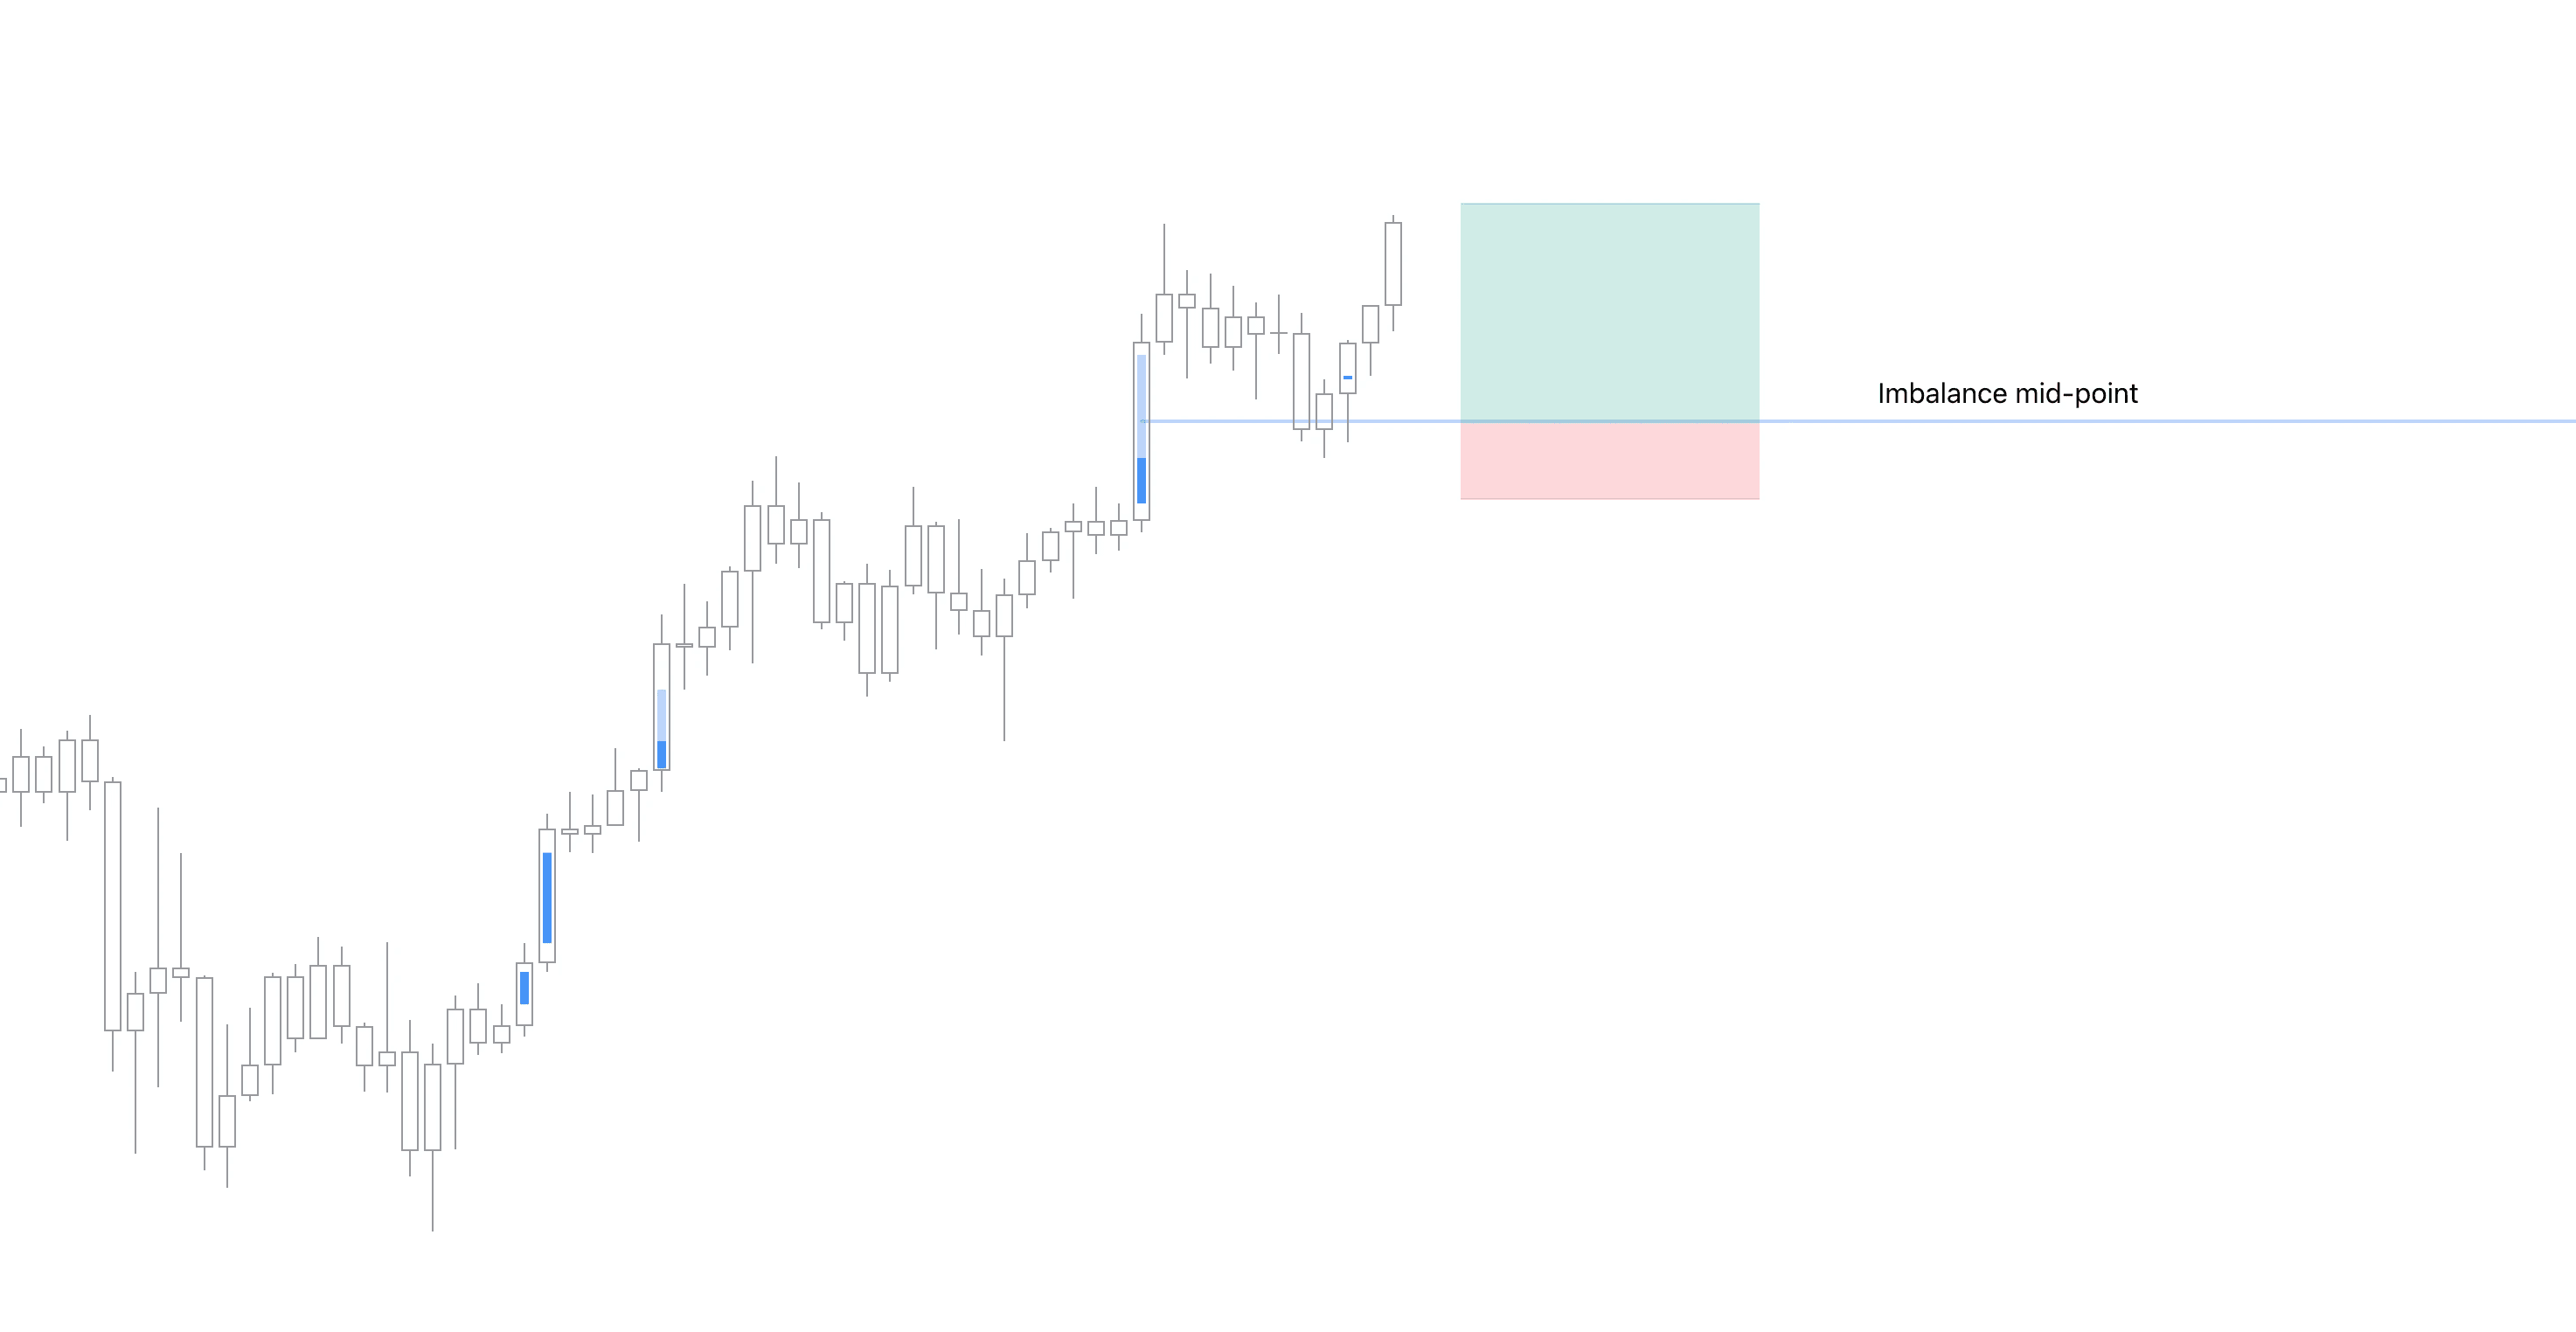
Imbalances as trade entry targets
As imbalances pull price like a magnet, inviting the inefficiency to trade out, they can be used to anticipate an optimal entry.
On a well established trend that can be assumed to continue, imbalances serve as low risk points to participate in the trend.
Traders sometimes prefer to use mid-point of imbalances as reference point, in case a full rebalancing does not occur.
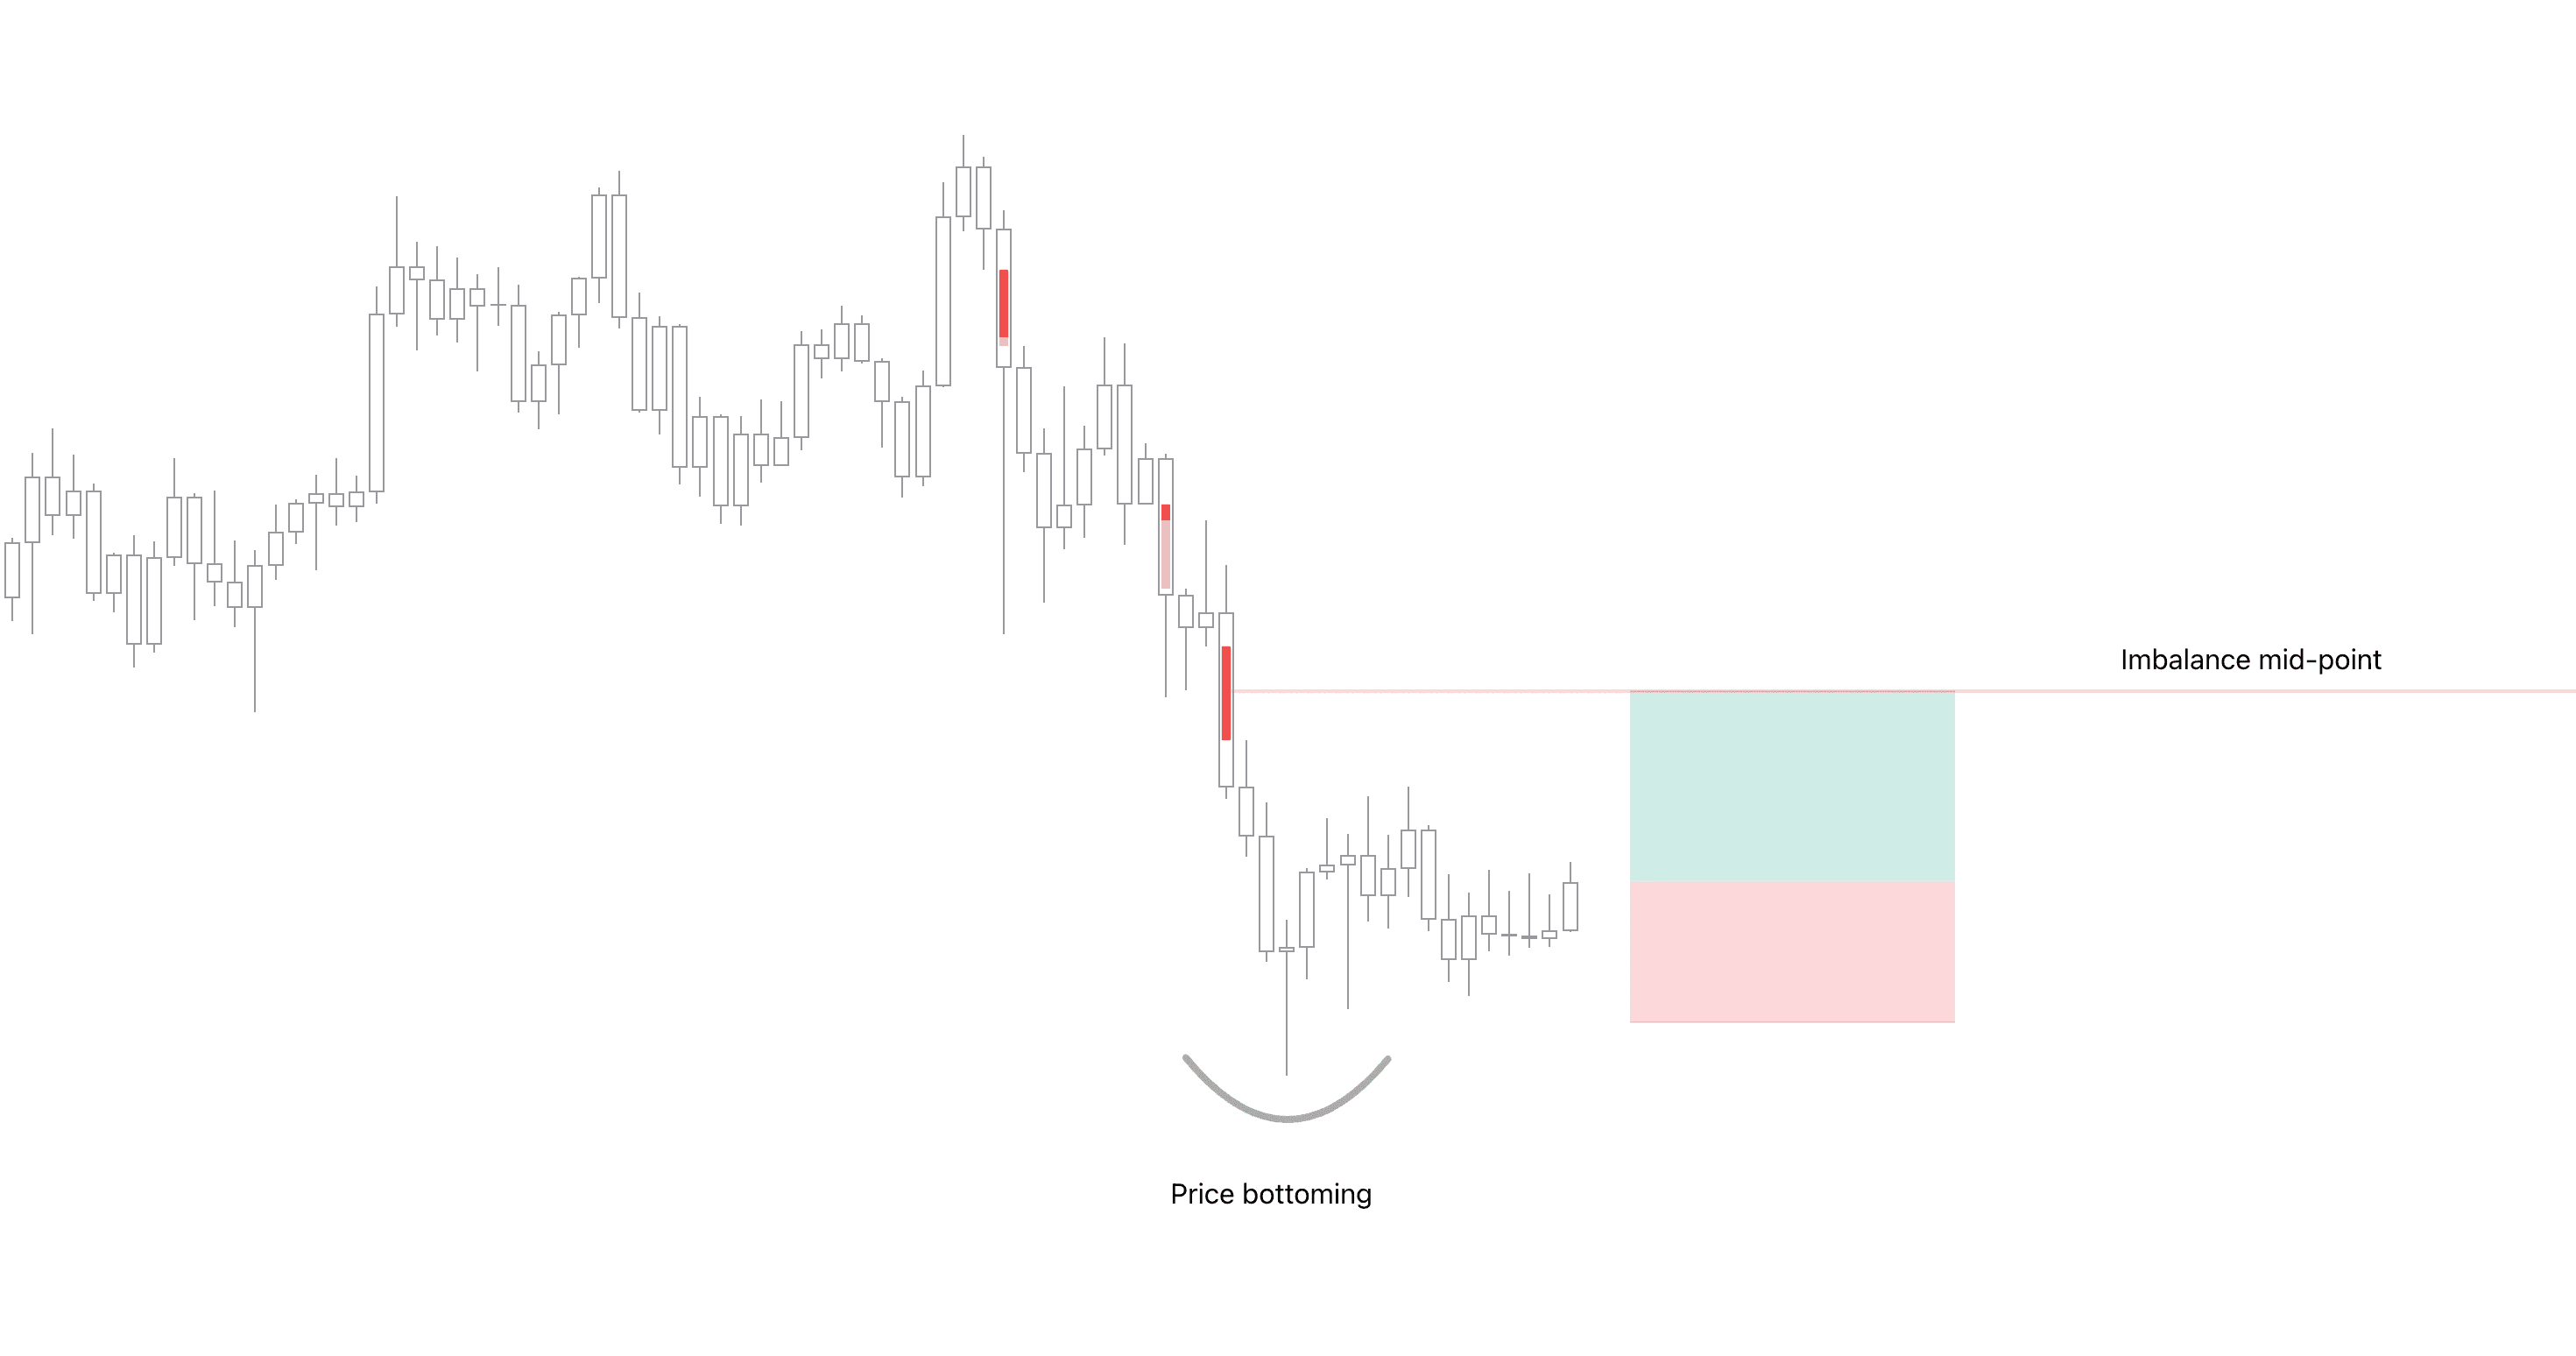
Imbalances as take profit targets
For the same reason, imbalances also make great targets for taking profit. When price can be concluded to be reversing, any open imbalance on the way acts as a magnet.
How to trade imbalances
Efficient markets don't like inefficiency. Sooner or later, the void must be filled with volume. Very rarely they stick without filling.
This makes imbalances particularly great for timing and targeting both trade entries and exits.
Imbalances as trade entry targets
As imbalances pull price like a magnet, inviting the inefficiency to trade out, they can be used to anticipate an optimal entry.
On a well established trend that can be assumed to continue, imbalances serve as low risk points to participate in the trend.
Traders sometimes prefer to use mid-point of imbalances as reference point, in case a full rebalancing does not occur.
Imbalances as take profit targets
For the same reason, imbalances also make great targets for taking profit. When price can be concluded to be reversing, any open imbalance on the way acts as a magnet.
Get Imbalances on TradingView
Imbalances indicator is granted as a welcome gift to all our Newsletter subscribers.
Access to Imbalances is granted immediately once sign-up is confirmed. Expect more goodies to arrive shortly after!
But wait… there's more
We have more volume and orderflow indicators for free to use on TradingView.
If you enjoyed this one, you'll enjoy these too (we promise). Find them here 👇


