

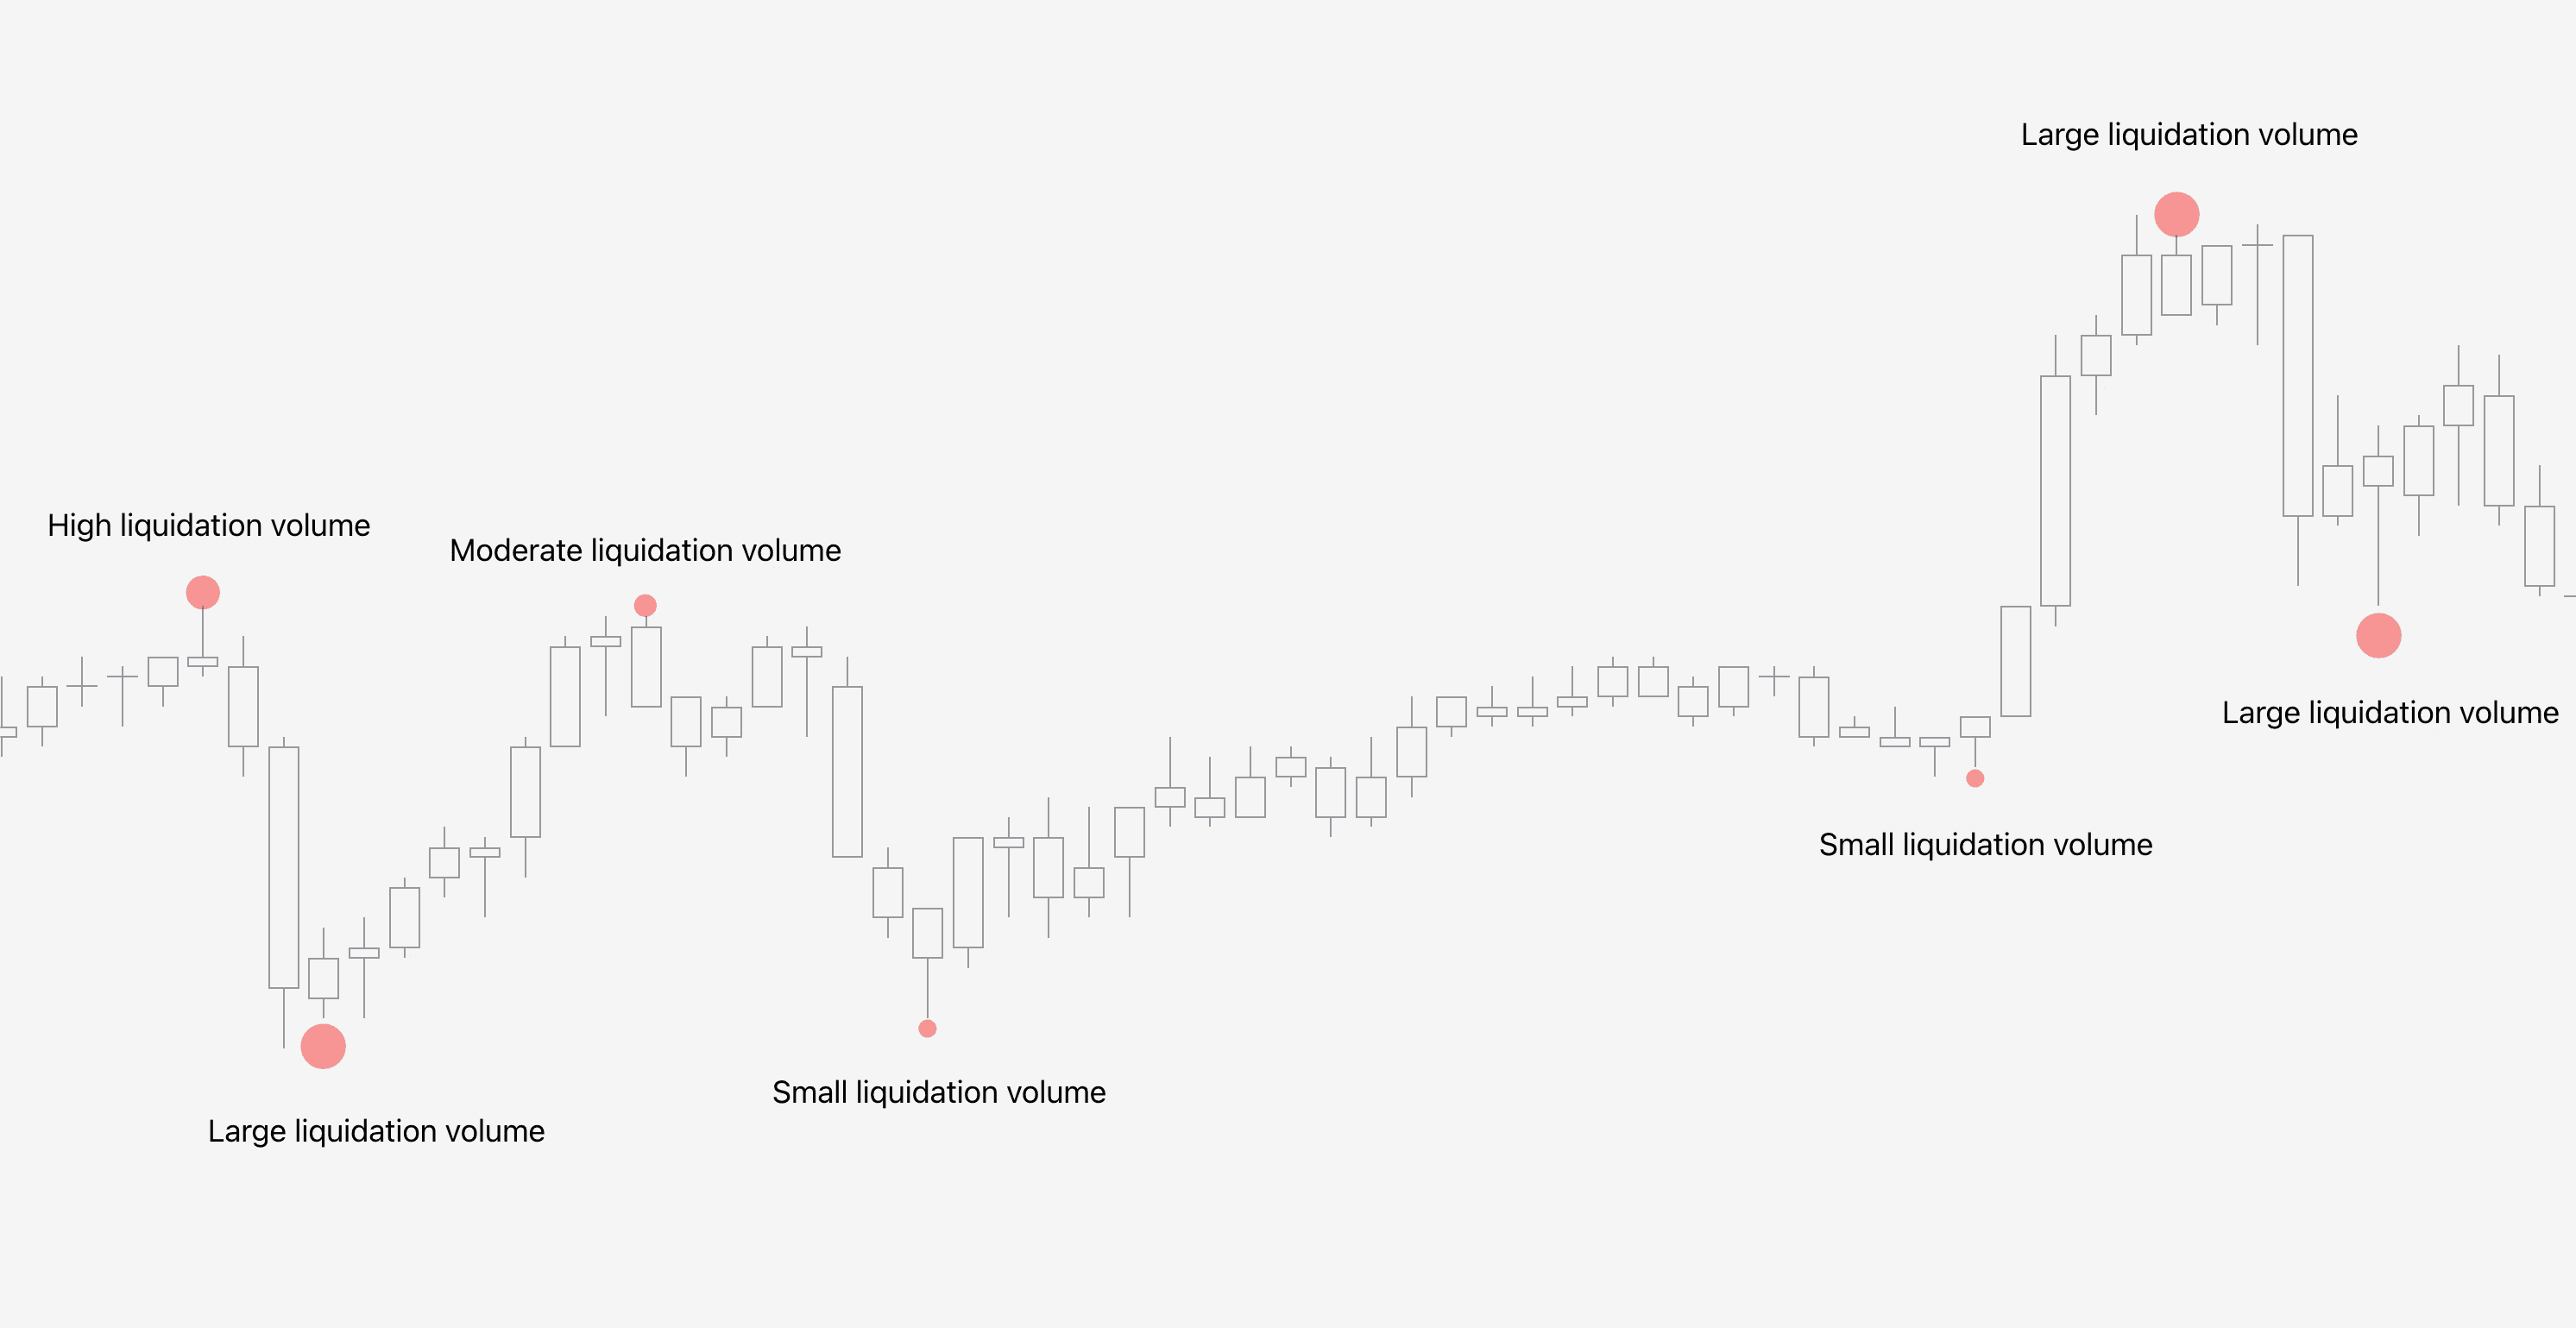
Liquidations in FlowMap
Liquidations in FlowMap are detected by a complex algorithm assessing volume and price anomalies associated with a liquidation event.
Liquidations are visualized using a bubbles of different sizes, indicating estimated amount of liquidation volume. The bigger the bubble, the larger the liquidation.
How to trade liquidations
Traders set stop-losses at a price where they think their trade idea has proven to be false and it's better to cut losses. Ironically this is often when it's best to enter a trade, not exit, as many other traders have set their stop-losses at the same price level too.
As the positions get liquidated en masse, price gets exhausted. When price is exhausted, it becomes increasingly harder to sustain the current trend direction and the opposite becomes more likely.
Think of it in terms of path of hard resistance and path of least resistance. For example, when traders are liquidated on an upside move, further upside becomes the path of hard resistance - the unlikely path.
Price turning to downside, the opposite way, becomes the path of least resistance - the likely path. This creates an apt window of opportunity for a reversal/halt in price.
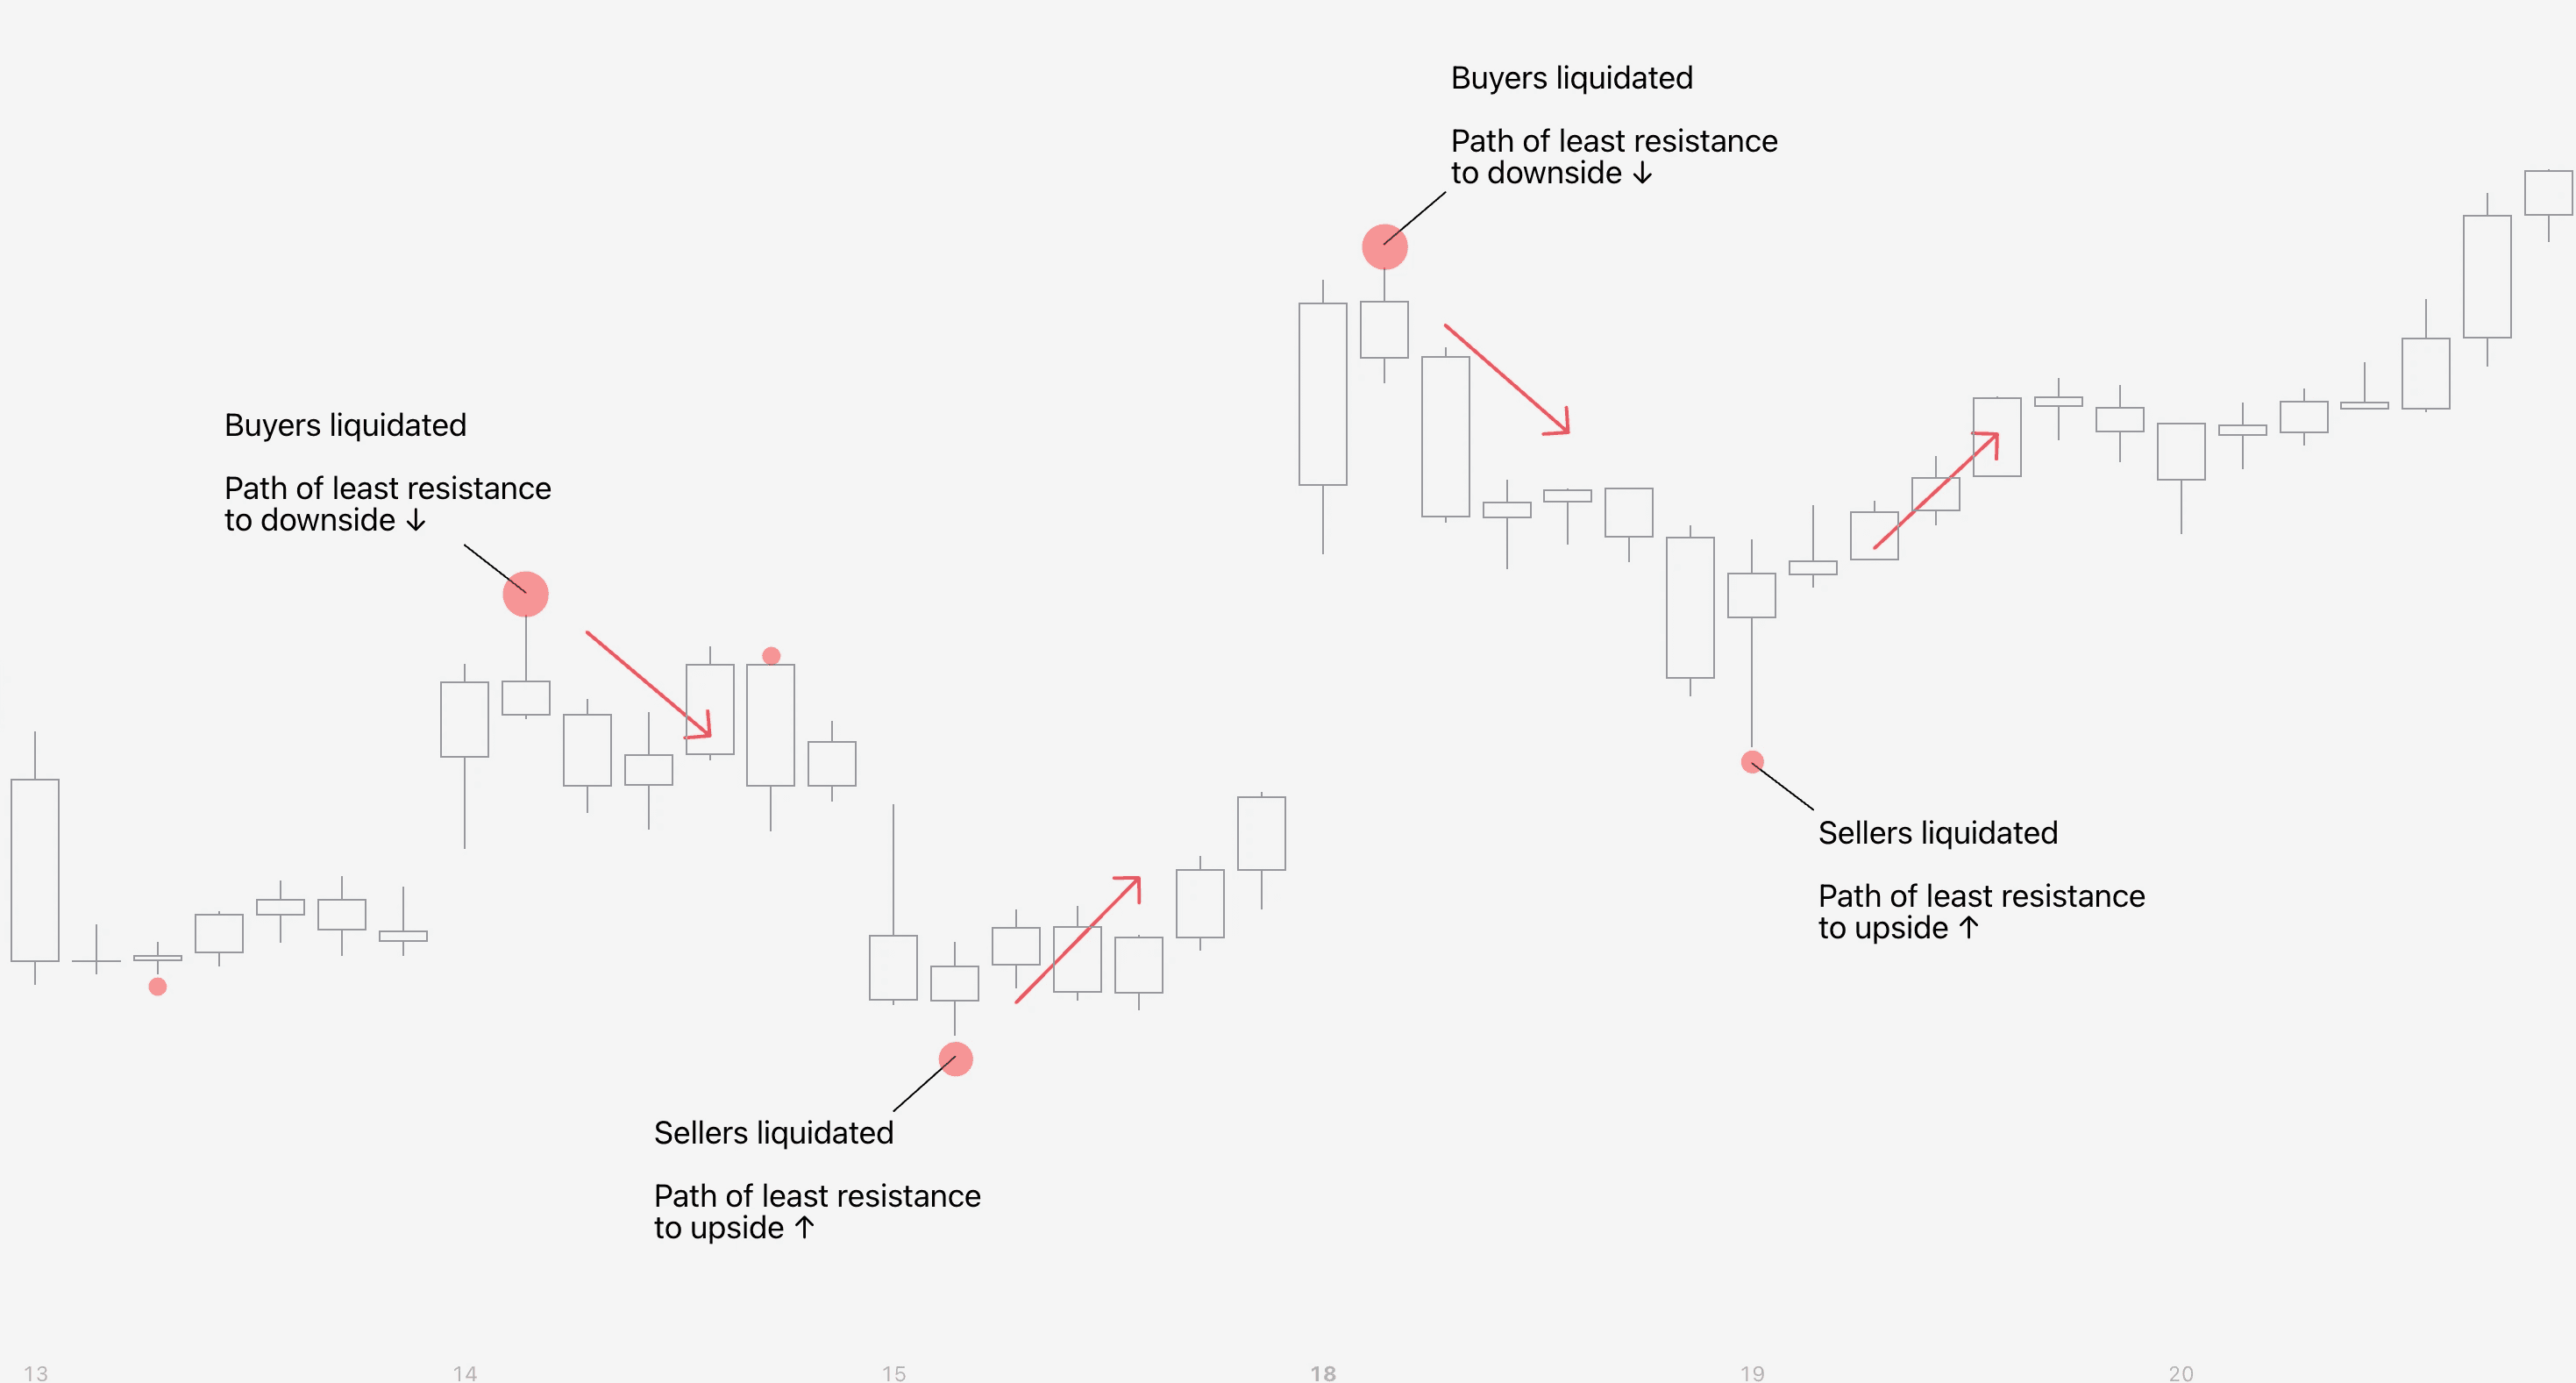
The beauty of liquidations is that they are simple to identify, yet powerful cues for navigating price action. And that's just one example on how to trade liquidations. Find more in these playbooks 👇
How to trade liquidations
Traders set stop-losses at a price where they think their trade idea has proven to be false and it's better to cut losses. Ironically this is often when it's best to enter a trade, not exit, as many other traders have set their stop-losses at the same price level too.
As the positions get liquidated en masse, price gets exhausted. When price is exhausted, it becomes increasingly harder to sustain the current trend direction and the opposite becomes more likely.
Think of it in terms of path of hard resistance and path of least resistance. For example, when traders are liquidated on an upside move, further upside becomes the path of hard resistance - the unlikely path.
Price turning to downside, the opposite way, becomes the path of least resistance - the likely path. This creates an apt window of opportunity for a reversal/halt in price.
The beauty of liquidations is that they are simple to identify, yet powerful cues for navigating price action. And that's just one example on how to trade liquidations. Find more in these playbooks 👇
Mentioned in this section
Dive deeper into topics mentioned
Mentioned in this section
Dive deeper into topics mentioned
Mentioned in this section
Dive deeper into topics mentioned


Learning is path of least resistance 💪
Not learning and guessing your way in the markets is the hard one. That's how liquidations work in FlowMap. They're our favorite indications due to how simple yet effective they are.
Take a look at all the other tools and concepts in FlowMap, it will give you more context in navigating reversal trades in FlowMap 👇


