

📕 Trading absorption
FlowMap can be used to identify active market orders that are absorbed into passive limit orders, signalling deep liquidity where high efforts are yielding little results.
Absorption |
|---|
🧰 Value Area, POC, Internal Flow |
↩️ Reversal setup |
📊 Moderate difficulty |
What is absorption in trading?
Absorption refers to an event where traders are attempting a price move by selling into a downtrend or buying into an uptrend, but are met with overwhelming supply.
These trades are “absorbed” into passive limit orders, often set by smarter players with deeper pockets who know less informed traders will hand over their positions to them at a price level that is likely to reverse.
Absorption is nothing but a simple supply/demand anomaly, where supply is greater than demand, resulting in resistance and potentially a reversal too.
How to identify absorption?
Absorption can be identified by looking for a reversal shaped candle where high amount of volume is traded in the rejected part - the wick.
In FlowMap, we can gauge volume was traded at the wick using both Value Area & POC and Internal Flow. Here’s the criteria.
Bullish absorption | Bearish absorption |
|---|---|
📉 Price trending down | 📈 Price trending up |
🐮 Bullish reversal candle | 🐻 Reversal candle down |
⬇️ High volume at lows | ⬆️ High volume at highs |
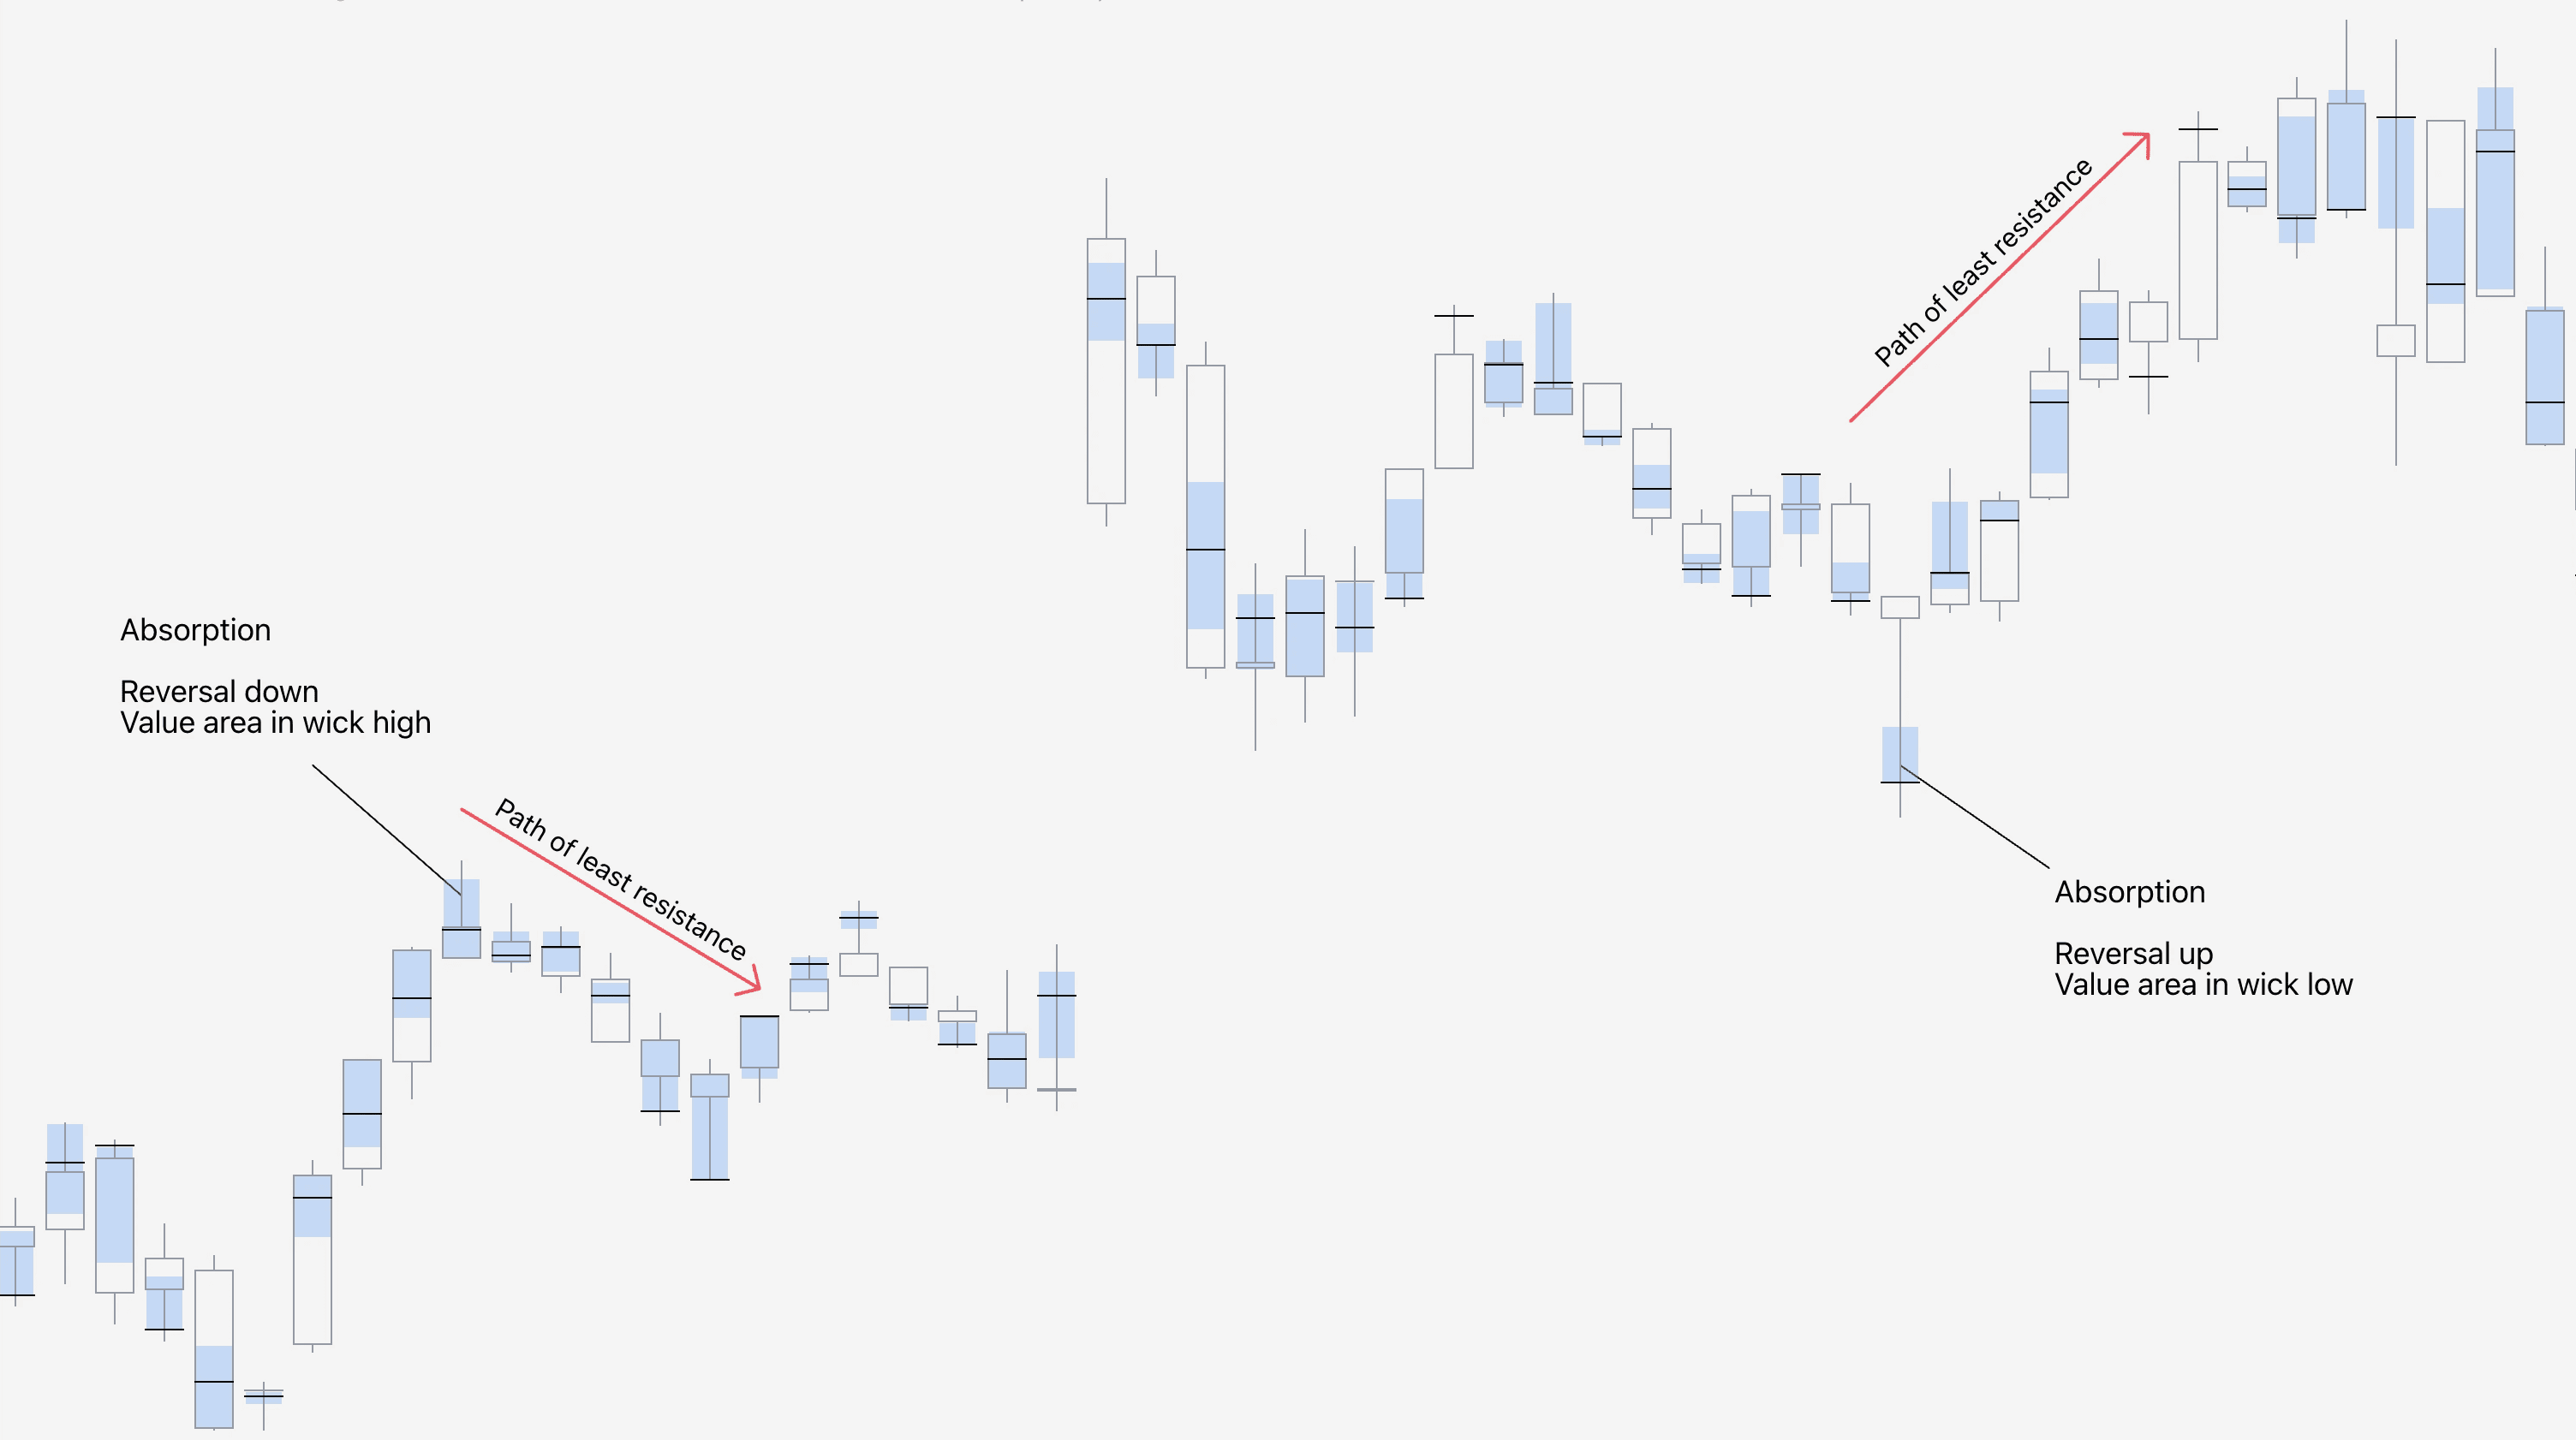
Trading absorption with Value Area & POC
Value Area tells us where majority of volume within the candle was traded (blue box) and POC (point of control, black line) where single highest trading volume was executed.
This creates a simple and effective to see where majority of traders show interest. When that is in the wick of a reversal shaped candle, we have absorption.
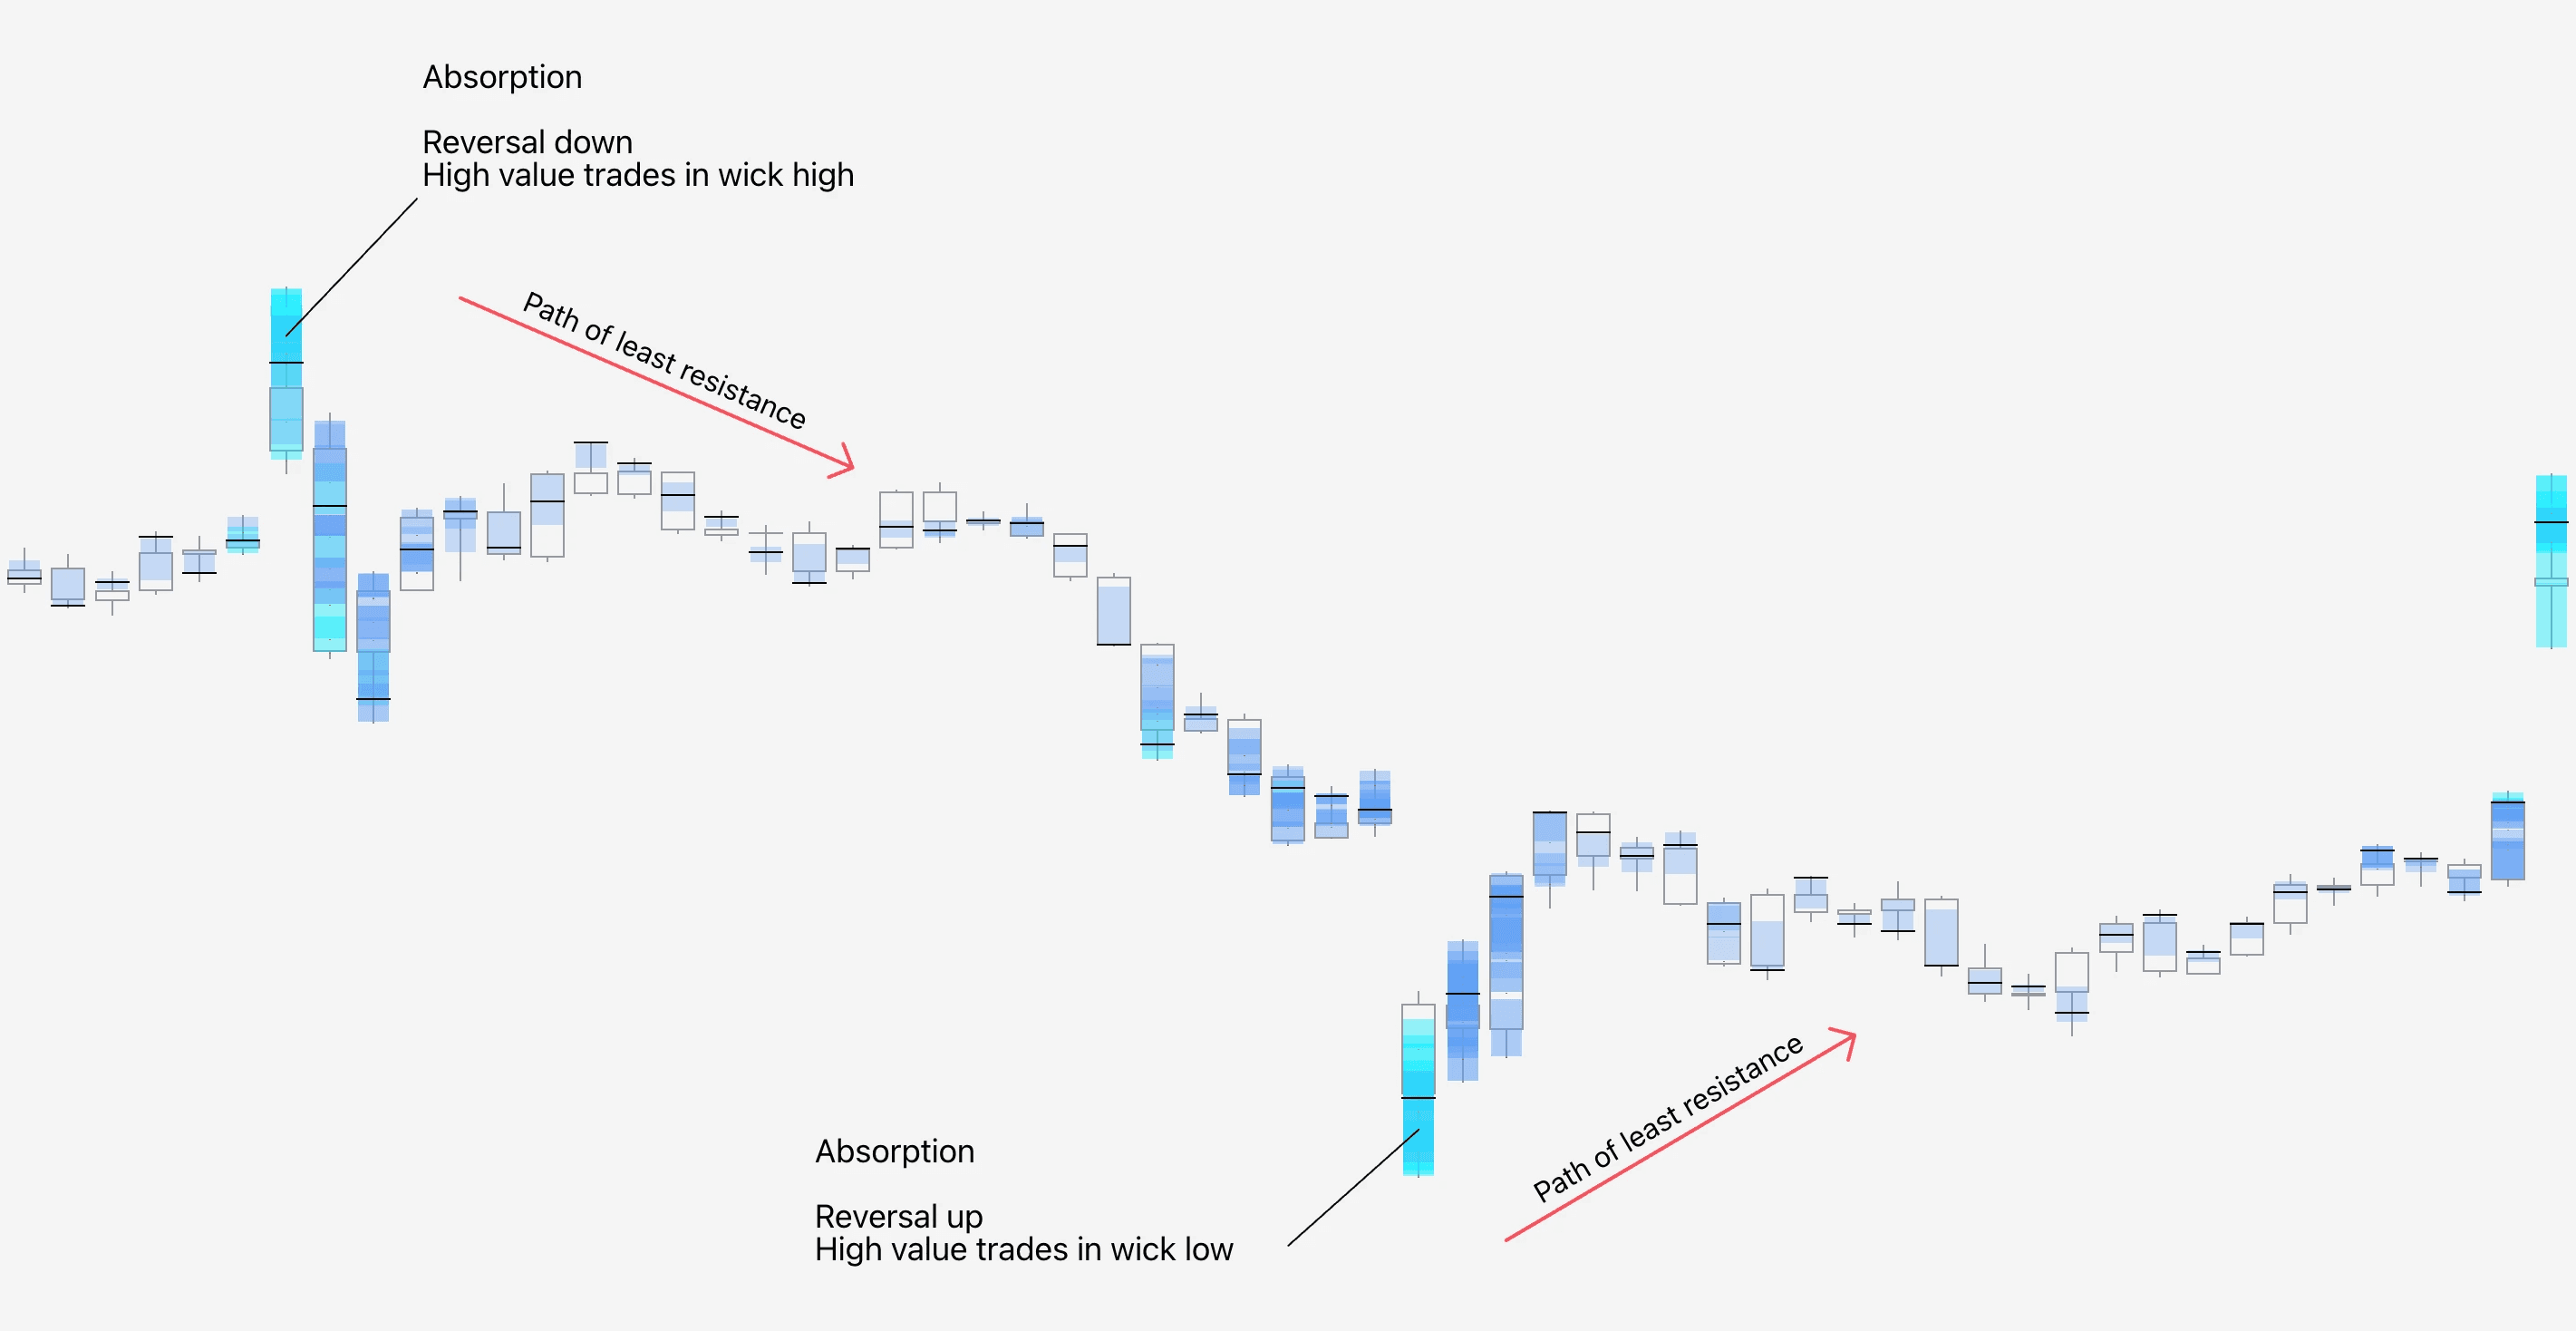
Trading absorption with Internal Flow
Similarly to Value Area and POC, Internal Flow tells us where traders inside the candle are positioning, but Internal Flow tell us about the aggressive trades, not the majority.
In other words, Internal Flow reveals where clusters of aggressive, high value trades are located. This is also suitable for detecting absorption.
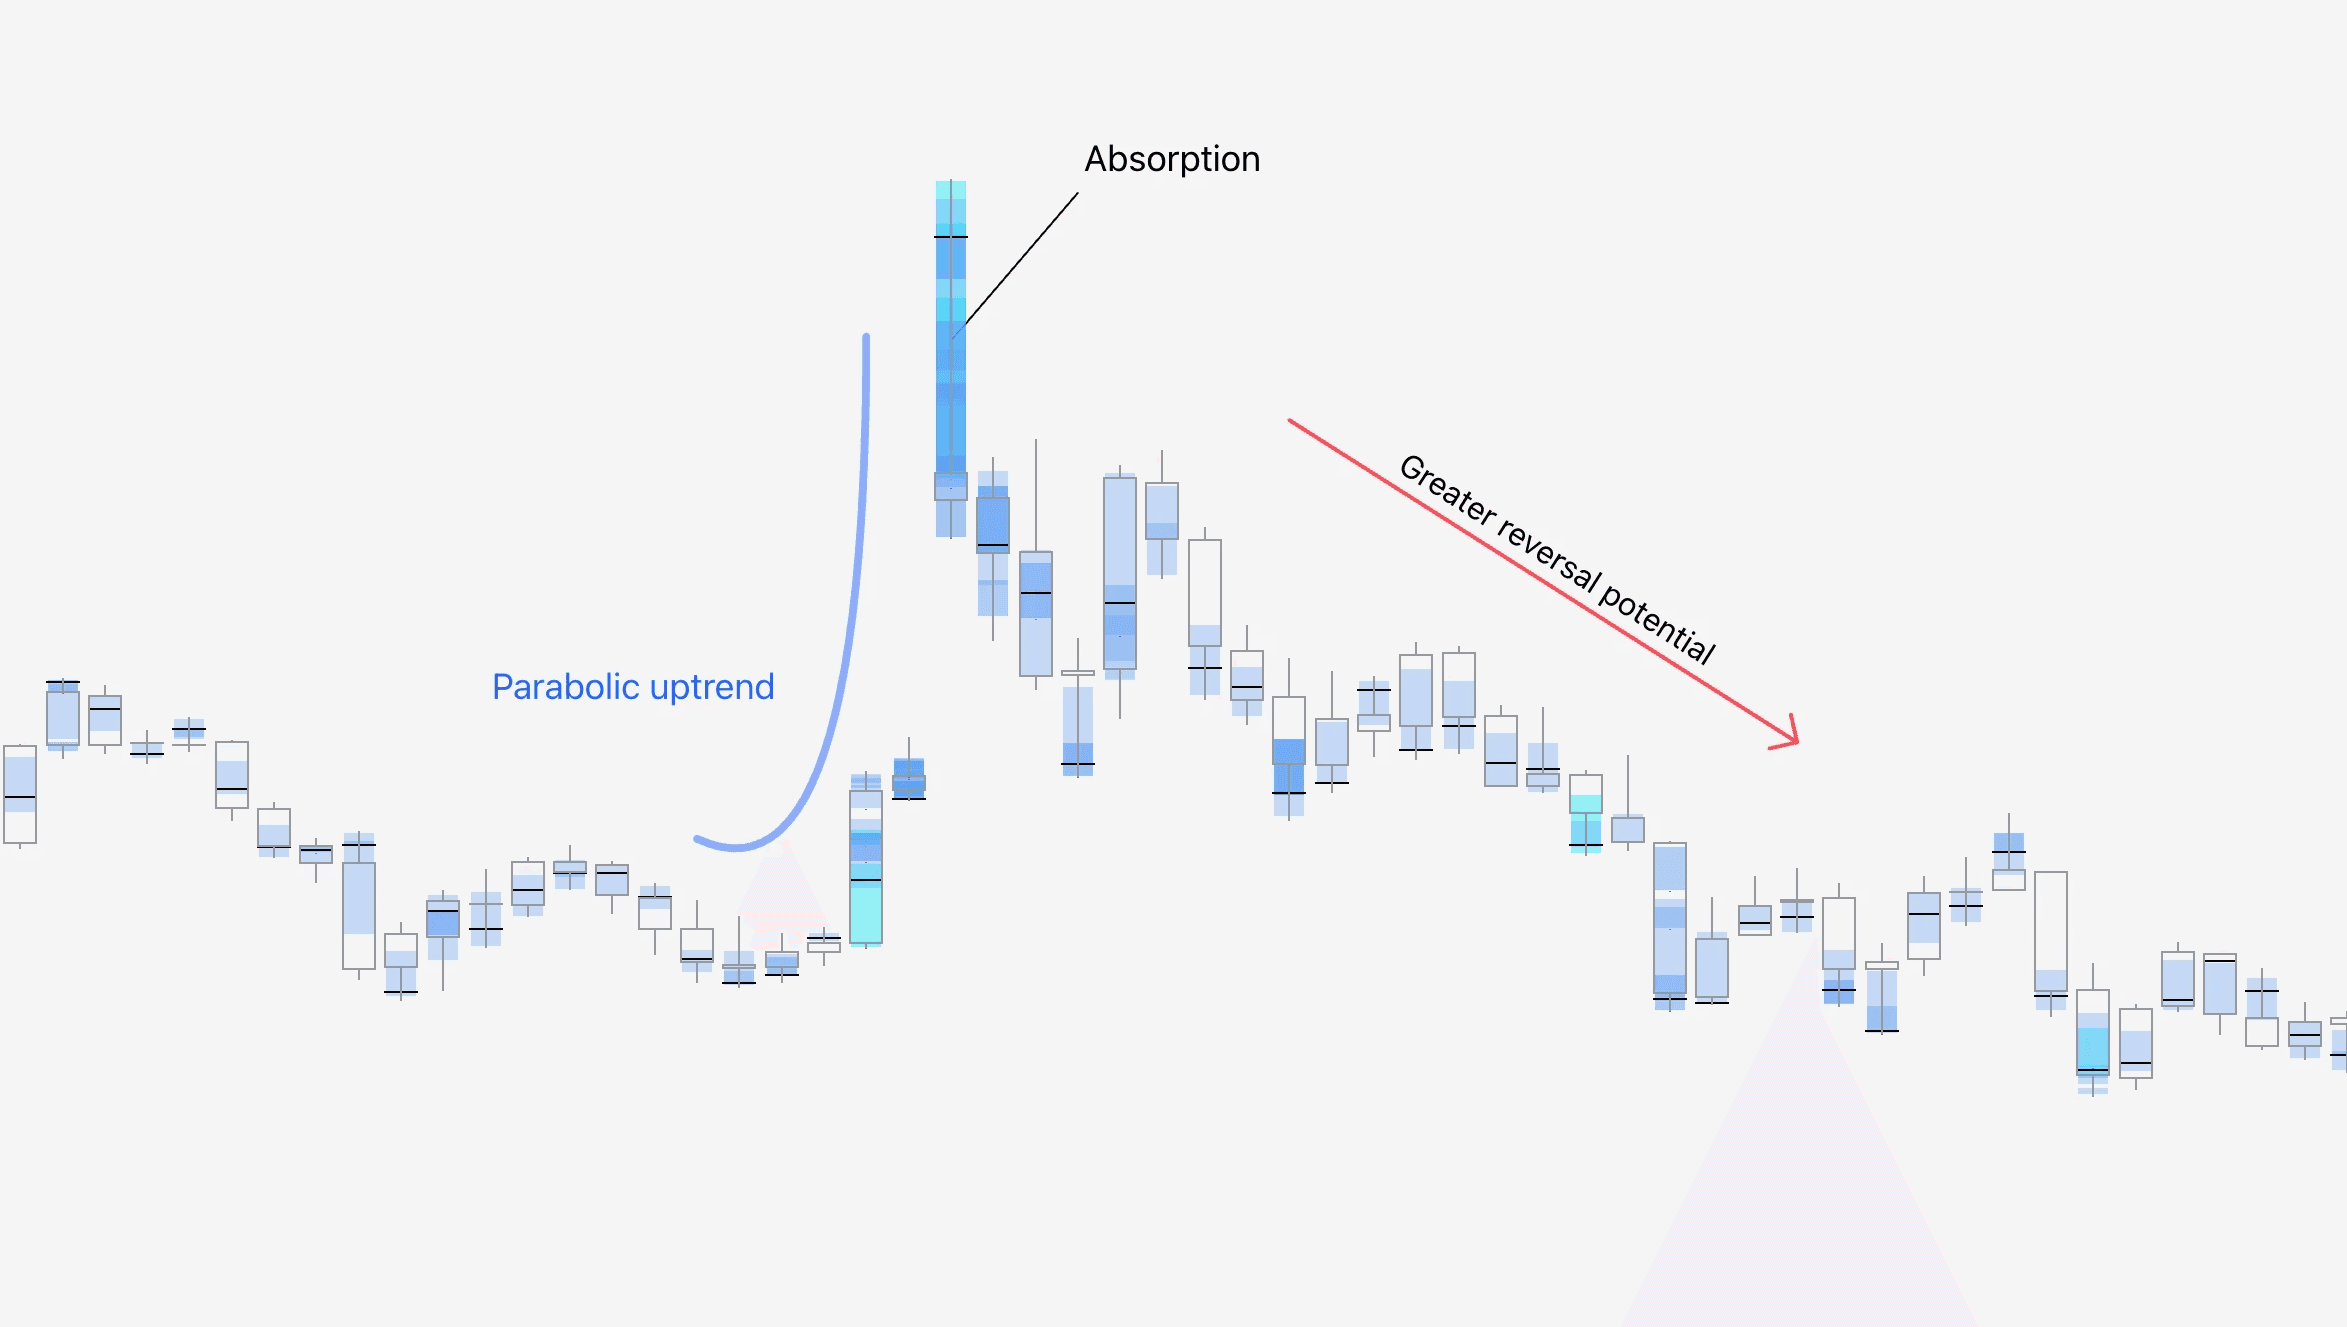
An ideal confluence for absorption is a parabolic price move. Trends that look like an exponentially growing hockey stick.
Parabolas signal price is already exhausted, sustaining that becomes increasingly harder. The more stretched the price, the more likely it is to reverse.
Absorption into parabolas therefore hold more reversal potential, as multiple factors are favoring a reversal instead of just the absorption itself.
📕 Trading absorption
FlowMap can be used to identify active market orders that are absorbed into passive limit orders, signalling deep liquidity where high efforts are yielding little results.
Absorption |
|---|
🧰 Value Area, POC, Internal Flow |
↩️ Reversal setup |
📊 Moderate difficulty |
What is absorption in trading?
Absorption refers to an event where traders are attempting a price move by selling into a downtrend or buying into an uptrend, but are met with overwhelming supply.
These trades are “absorbed” into passive limit orders, often set by smarter players with deeper pockets who know less informed traders will hand over their positions to them at a price level that is likely to reverse.
Absorption is nothing but a simple supply/demand anomaly, where supply is greater than demand, resulting in resistance and potentially a reversal too.
How to identify absorption?
Absorption can be identified by looking for a reversal shaped candle where high amount of volume is traded in the rejected part - the wick.
In FlowMap, we can gauge volume was traded at the wick using both Value Area & POC and Internal Flow. Here’s the criteria.
Bullish absorption | Bearish absorption |
|---|---|
📉 Price trending down | 📈 Price trending up |
🐮 Bullish reversal candle | 🐻 Reversal candle down |
⬇️ High volume at lows | ⬆️ High volume at highs |
Trading absorption with Value Area & POC
Value Area tells us where majority of volume within the candle was traded (blue box) and POC (point of control, black line) where single highest trading volume was executed.
This creates a simple and effective to see where majority of traders show interest. When that is in the wick of a reversal shaped candle, we have absorption.
Trading absorption with Internal Flow
Similarly to Value Area and POC, Internal Flow tells us where traders inside the candle are positioning, but Internal Flow tell us about the aggressive trades, not the majority.
In other words, Internal Flow reveals where clusters of aggressive, high value trades are located. This is also suitable for detecting absorption.
An ideal confluence for absorption is a parabolic price move. Trends that look like an exponentially growing hockey stick.
Parabolas signal price is already exhausted, sustaining that becomes increasingly harder. The more stretched the price, the more likely it is to reverse.
Absorption into parabolas therefore hold more reversal potential, as multiple factors are favoring a reversal instead of just the absorption itself.
Mentioned in this section
Dive deeper into topics mentioned
Mentioned in this section
Dive deeper into topics mentioned
Mentioned in this section
Dive deeper into topics mentioned


📗 Trading liquidations
FlowMap can be used to identify when significant amount of trading positions have capitulated due to fear/greed driven trading and stop-losses, signalling traders in great pain.
Forced liquidations |
|---|
🧰 Liquidations |
↩️ Reversal setup |
📊 Easy difficulty |
What are liquidations?
A forced liquidation occurs when a trading position is forcefully exited at market price due to a stop-loss price triggered.
Liquidations typically occur at price levels that traders deemed to be “safe” for their positions.
Ironically these price levels are much more favorable for entering a trade than exiting as price is having its last final push in exhaustion.
How to identify a liquidation?
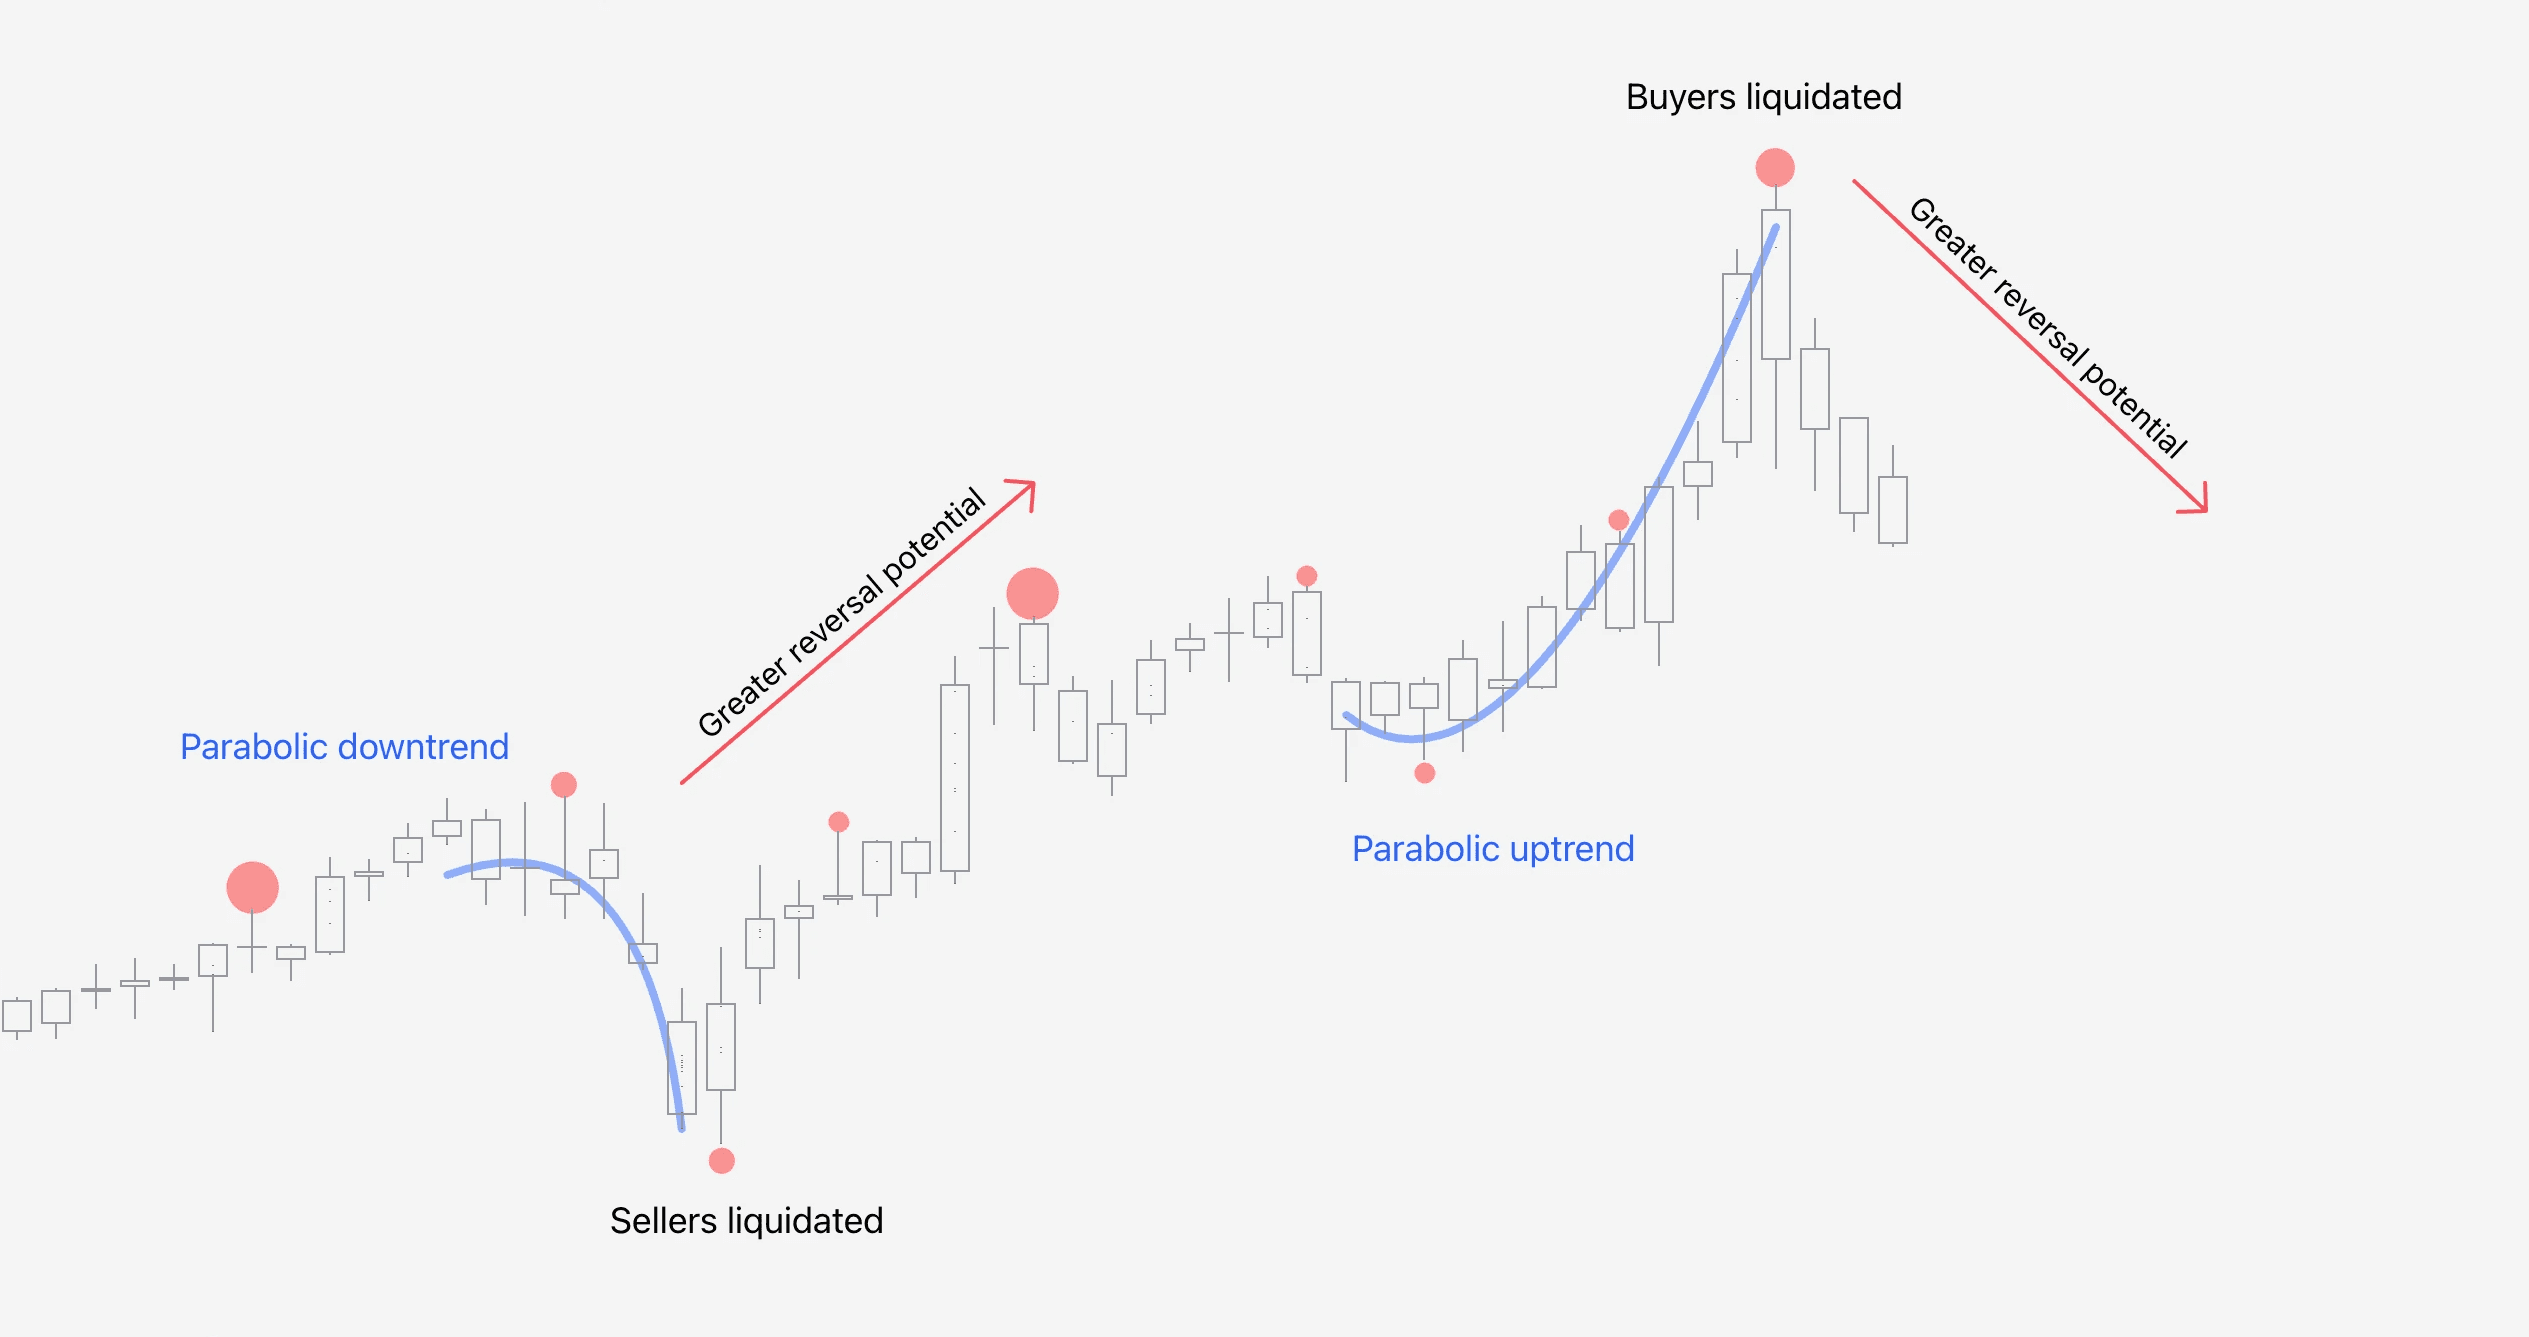
FlowMap makes detecting liquidations a breeze. Liquidations are visualized using bubbles of varying sizes.
The size of the bubble indicates estimated amount of liquidation volume - the bigger the bubble, the larger the liquidation.
Bullish liquidation | Bearish absorption |
|---|---|
📉 Price trending down | 📈 Price trending up |
⬇️ Liquidation bubble at lows | ⬆️ Liquidation bubble at highs |
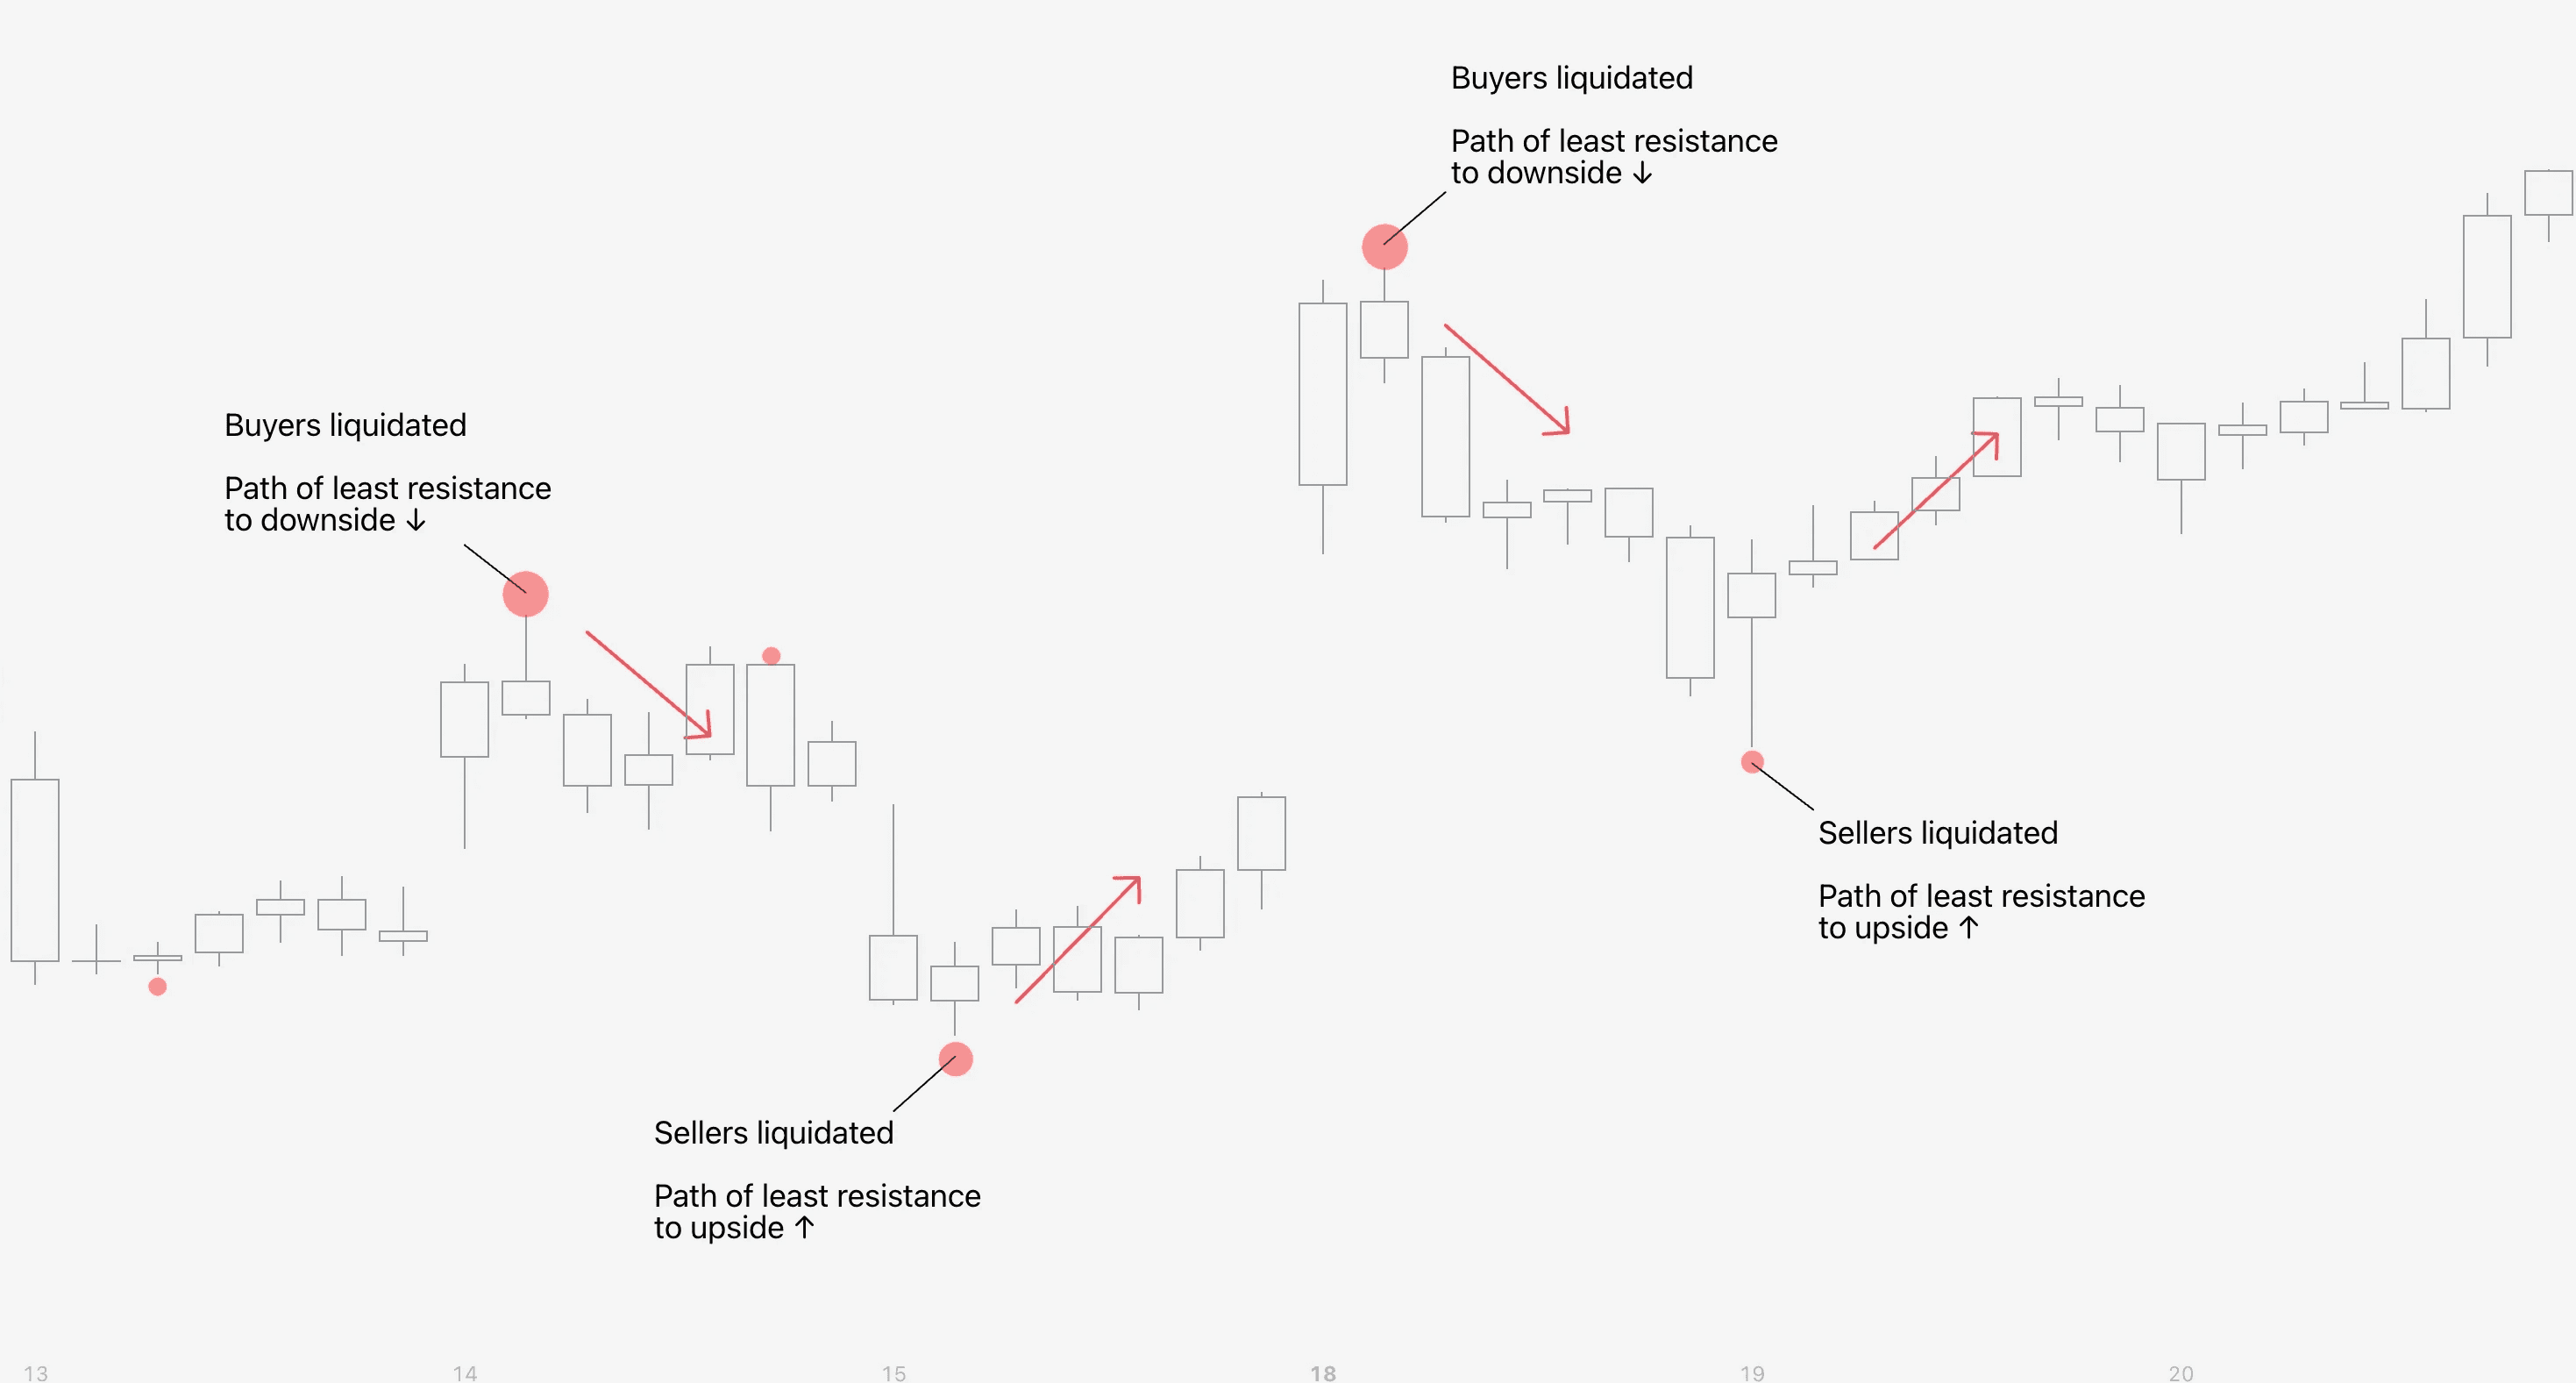
Trading liquidations
With FlowMap, we’d look for liquidations that are ideally large with convincing looking reversals and simply make a bet that price will resolve to the opposite direction.
If a liquidation bubble is at high, we'd expect short term downside. If a liquidation bubble is at low, we'd expect short term upside.
Like with absorption, liquidations also work better when taking place at parabolic price moves.
An exponential, hockey stick like price move exhausts the trend and liquidation often acts as a final nail in the coffin pausing it altogether.
📗 Trading liquidations
FlowMap can be used to identify when significant amount of trading positions have capitulated due to fear/greed driven trading and stop-losses, signalling traders in great pain.
Forced liquidations |
|---|
🧰 Liquidations |
↩️ Reversal setup |
📊 Easy difficulty |
What are liquidations?
A forced liquidation occurs when a trading position is forcefully exited at market price due to a stop-loss price triggered.
Liquidations typically occur at price levels that traders deemed to be “safe” for their positions.
Ironically these price levels are much more favorable for entering a trade than exiting as price is having its last final push in exhaustion.
How to identify a liquidation?
FlowMap makes detecting liquidations a breeze. Liquidations are visualized using bubbles of varying sizes.
The size of the bubble indicates estimated amount of liquidation volume - the bigger the bubble, the larger the liquidation.
Bullish liquidation | Bearish absorption |
|---|---|
📉 Price trending down | 📈 Price trending up |
⬇️ Liquidation bubble at lows | ⬆️ Liquidation bubble at highs |
Trading liquidations
With FlowMap, we’d look for liquidations that are ideally large with convincing looking reversals and simply make a bet that price will resolve to the opposite direction.
If a liquidation bubble is at high, we'd expect short term downside. If a liquidation bubble is at low, we'd expect short term upside.
Like with absorption, liquidations also work better when taking place at parabolic price moves.
An exponential, hockey stick like price move exhausts the trend and liquidation often acts as a final nail in the coffin pausing it altogether.
Mentioned in this section
Dive deeper into topics mentioned
Mentioned in this section
Dive deeper into topics mentioned
Mentioned in this section
Dive deeper into topics mentioned

📘 Trade long/short squeezes
FlowMap can be used to identify traders who are trapped in a losing position and under a threat of having to cover their losses by buying into a rally or selling into a dip.
The more price runs away from the trapped traders, the more they are compelled to cover their losses and add further fuel to the reversal move.
Long/short squeeze |
|---|
🧰 Liquidity Heatmap |
↩️ Reversal setup |
📊 Easy difficulty |
What is long/short squeeze in trading?
The idea behind long and short squeeze is to identify extremes where traders have sold (shorted) or bought (longed) into large limit orders with price reversing imminently.
This kind of pattern reveals traders have ended as exit liquidity, giving their positions away at a favorable price to someone else.
When market psychology starts to play out, these traders are forced to cover their longs/shorts, buying into rallies and selling into dips. Squeezed.
How to identify long/short squeezes?
Trapped traders susceptible to getting squeezed can be identified in FlowMap by looking for manipulation patterns.
Manipulation patterns are indicated by red boxes, showing the “deviated” part of the liquidity pool. This is where the traders are trapped.
Short squeeze | Long squeeze |
|---|---|
📉 Price trending down | 📈 Price trending up |
⬇️ Manipulation at downside liquidity | ⬆️ Manipulation at upside liquidity |
Trading long/short squeezes
Trading long/short squeezes too follows the same basic principle as any pain, take the opposite side of the pain.
When longs are getting squeezed, sell. When shorts are getting squeezed, buy.
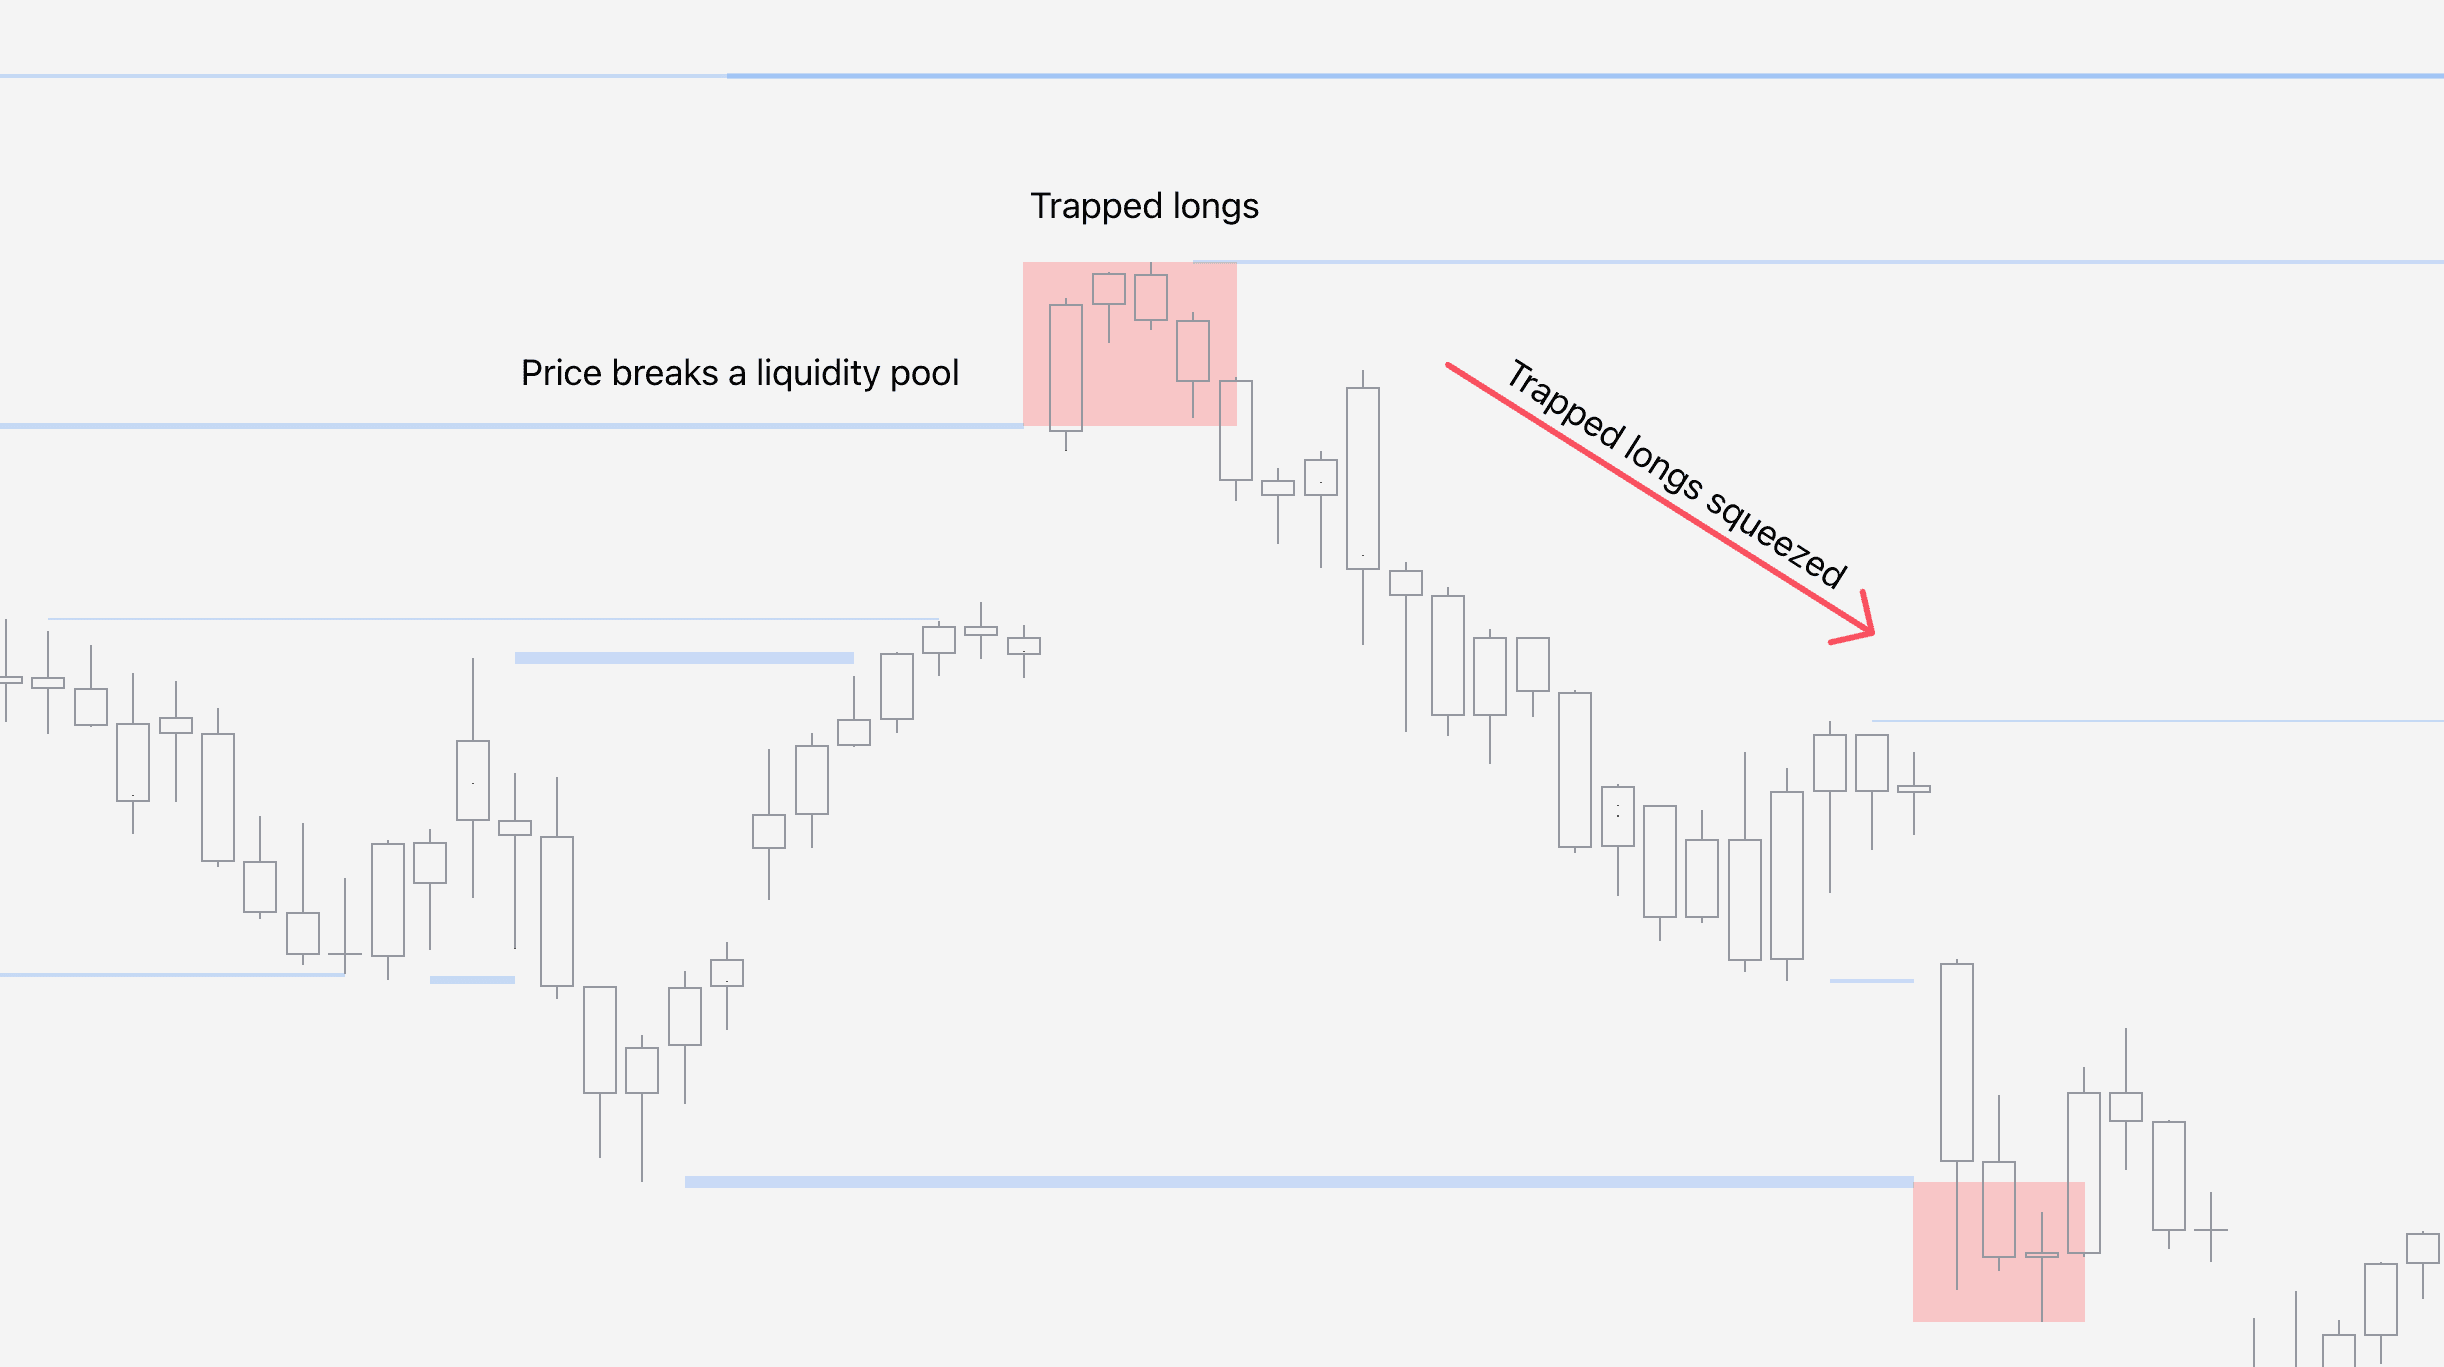
When price breaks a liquidity pool and shortly closes back in, a manipulation pattern is in place, indicating potential for a squeeze is high.
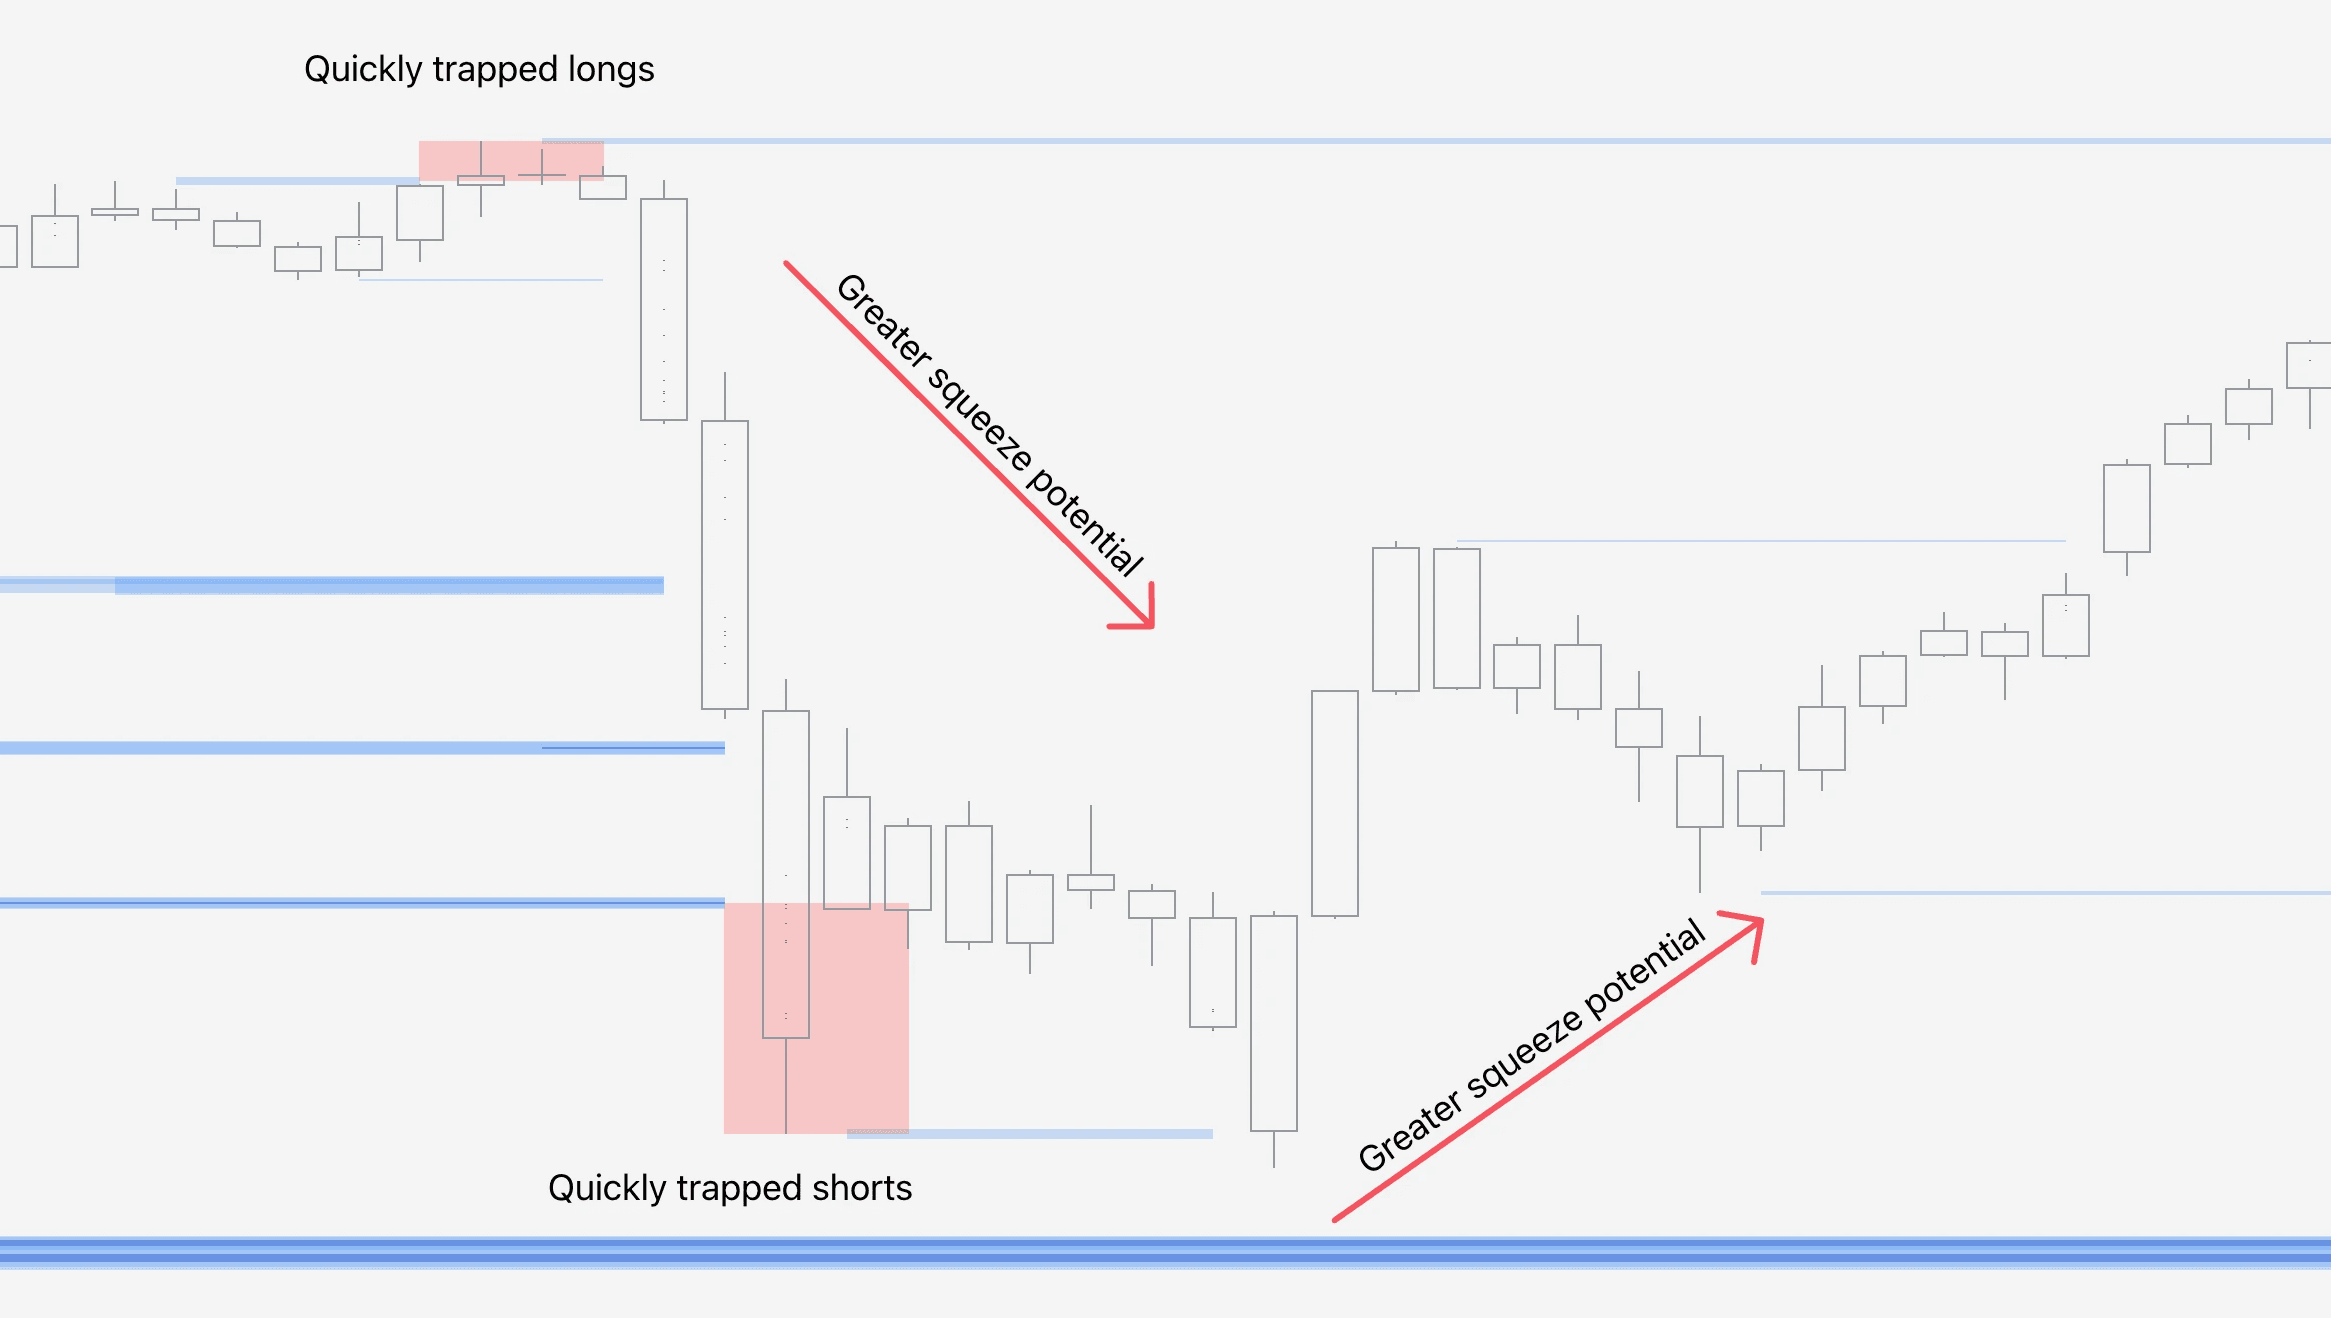
Traders should also consider the amount of time manipulation pattern forms.
The quicker the pattern, the more urgency and aggression in the loss covering.
Patterns that last 2-3 candles are ideal for more pronounced squeezes that last longer.
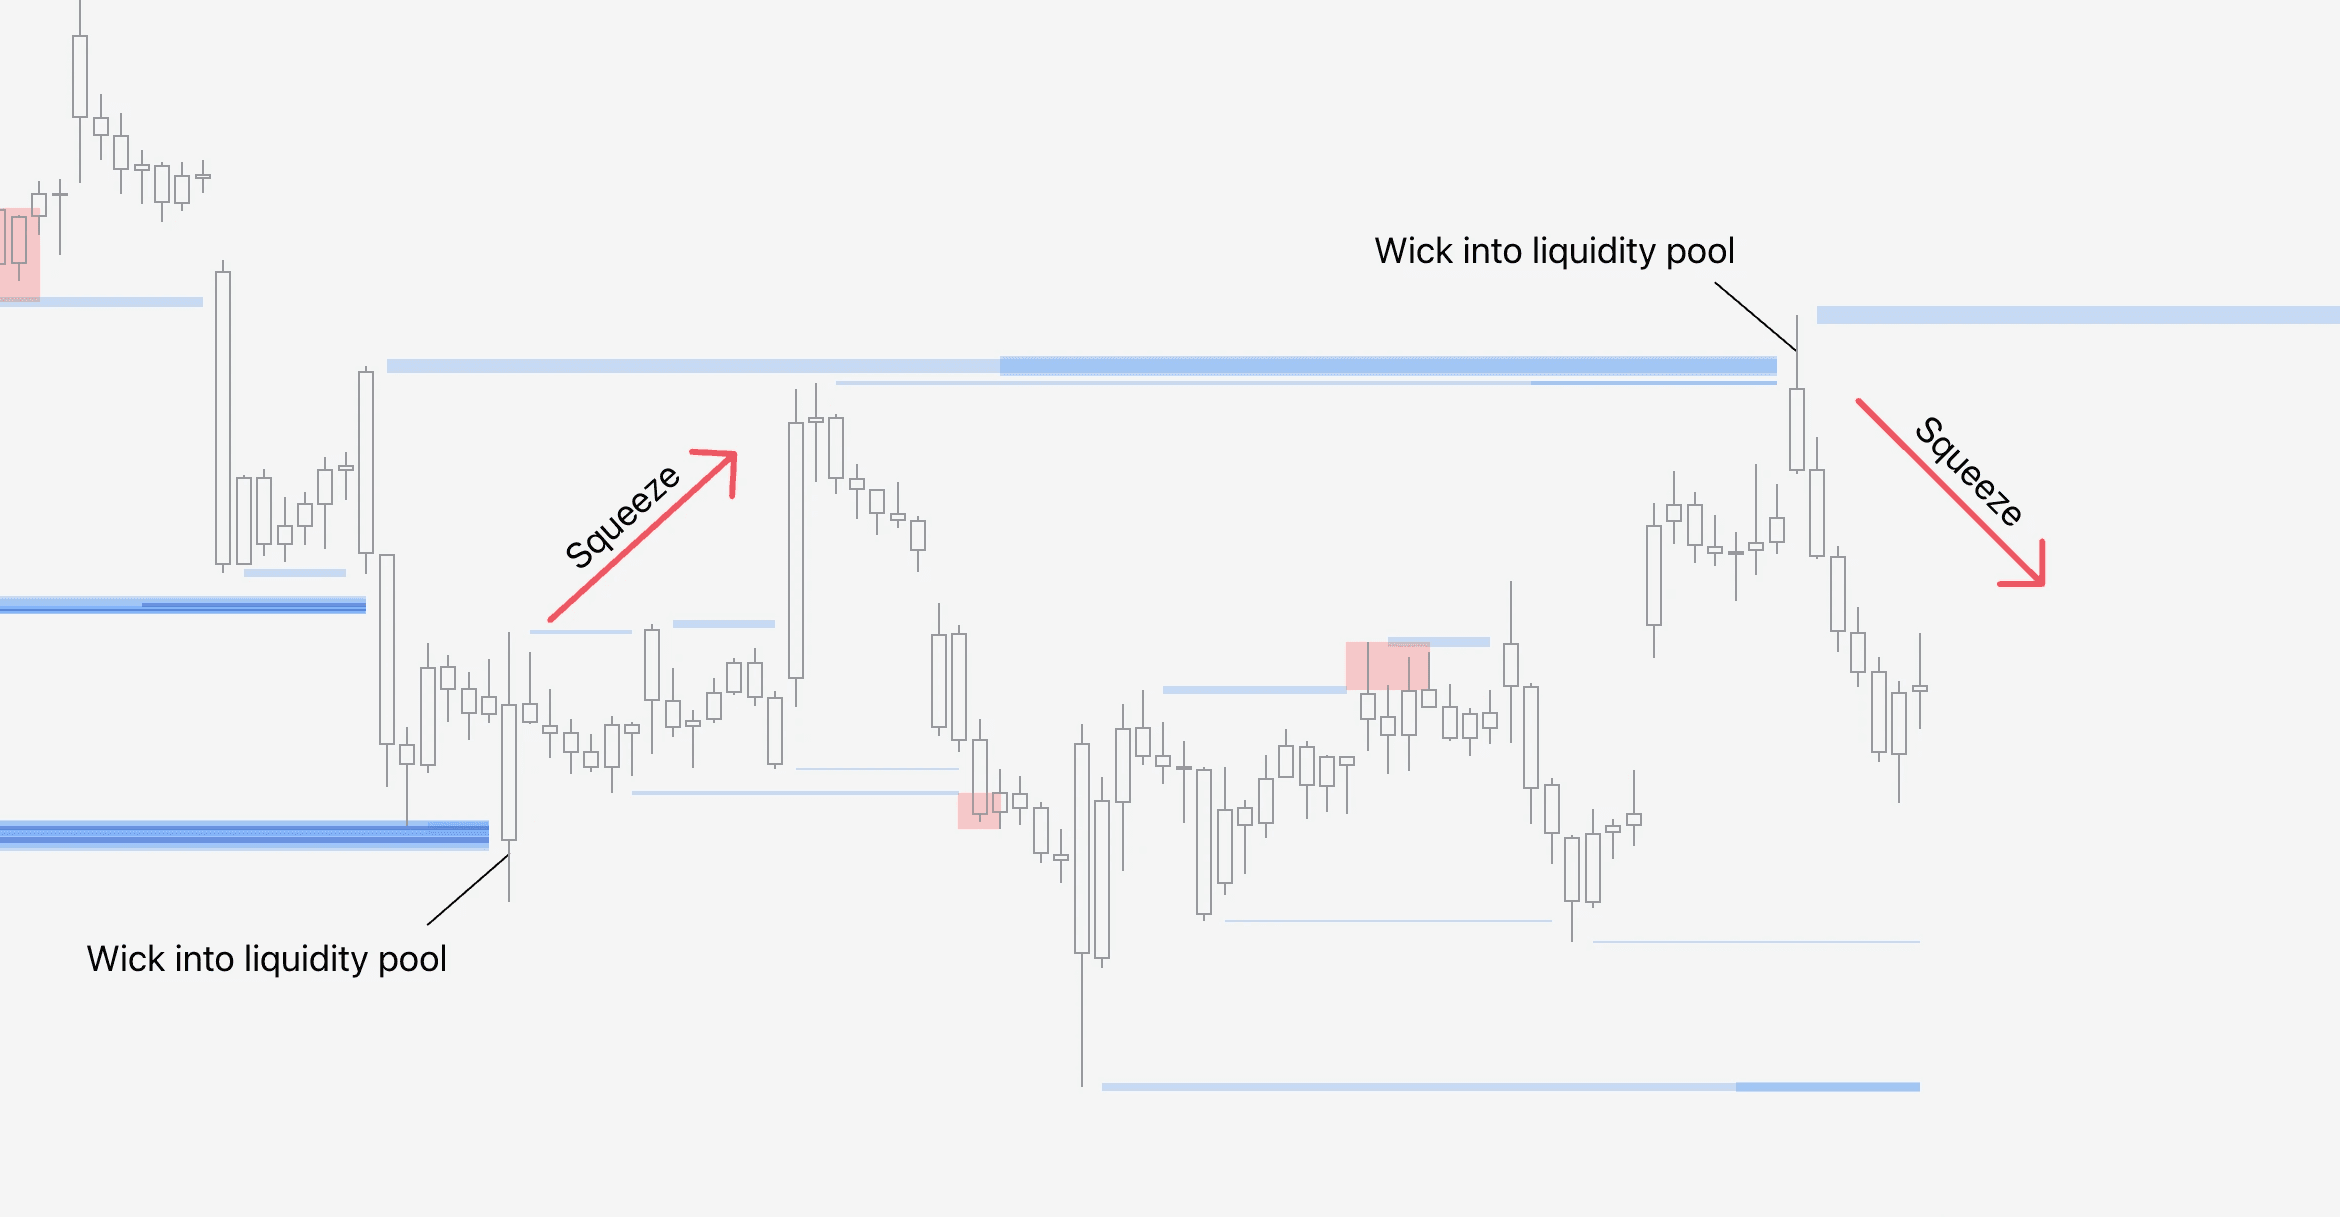
Whereas manipulation pattern is a clear cut sign of a squeeze, price simply trading at liquidity pool can also indicate that.
Price wicking into a liquidity pool signals trapped traders, as price traded at the pool area and was then rejected, as shown by the wick.
📘 Trade long/short squeezes
FlowMap can be used to identify traders who are trapped in a losing position and under a threat of having to cover their losses by buying into a rally or selling into a dip.
The more price runs away from the trapped traders, the more they are compelled to cover their losses and add further fuel to the reversal move.
Long/short squeeze |
|---|
🧰 Liquidity Heatmap |
↩️ Reversal setup |
📊 Easy difficulty |
What is long/short squeeze in trading?
The idea behind long and short squeeze is to identify extremes where traders have sold (shorted) or bought (longed) into large limit orders with price reversing imminently.
This kind of pattern reveals traders have ended as exit liquidity, giving their positions away at a favorable price to someone else.
When market psychology starts to play out, these traders are forced to cover their longs/shorts, buying into rallies and selling into dips. Squeezed.
How to identify long/short squeezes?
Trapped traders susceptible to getting squeezed can be identified in FlowMap by looking for manipulation patterns.
Manipulation patterns are indicated by red boxes, showing the “deviated” part of the liquidity pool. This is where the traders are trapped.
Short squeeze | Long squeeze |
|---|---|
📉 Price trending down | 📈 Price trending up |
⬇️ Manipulation at downside liquidity | ⬆️ Manipulation at upside liquidity |
Trading long/short squeezes
Trading long/short squeezes too follows the same basic principle as any pain, take the opposite side of the pain.
When longs are getting squeezed, sell. When shorts are getting squeezed, buy.
When price breaks a liquidity pool and shortly closes back in, a manipulation pattern is in place, indicating potential for a squeeze is high.
Traders should also consider the amount of time manipulation pattern forms.
The quicker the pattern, the more urgency and aggression in the loss covering.
Patterns that last 2-3 candles are ideal for more pronounced squeezes that last longer.
Whereas manipulation pattern is a clear cut sign of a squeeze, price simply trading at liquidity pool can also indicate that.
Price wicking into a liquidity pool signals trapped traders, as price traded at the pool area and was then rejected, as shown by the wick.
Mentioned in this section
Dive deeper into topics mentioned
Mentioned in this section
Dive deeper into topics mentioned
Mentioned in this section
Dive deeper into topics mentioned

Don't reverse yet, you're almost there 💪
Counter-trading rekt traders is one of our favorite ways to use FlowMap, as the setups are easy to spot and very effective.
Take also a look at how to trade continuations using FlowMap and how all the parts of FlowMap work under the hood. Find more lessons here 👇


