

What is volume profile in trading?
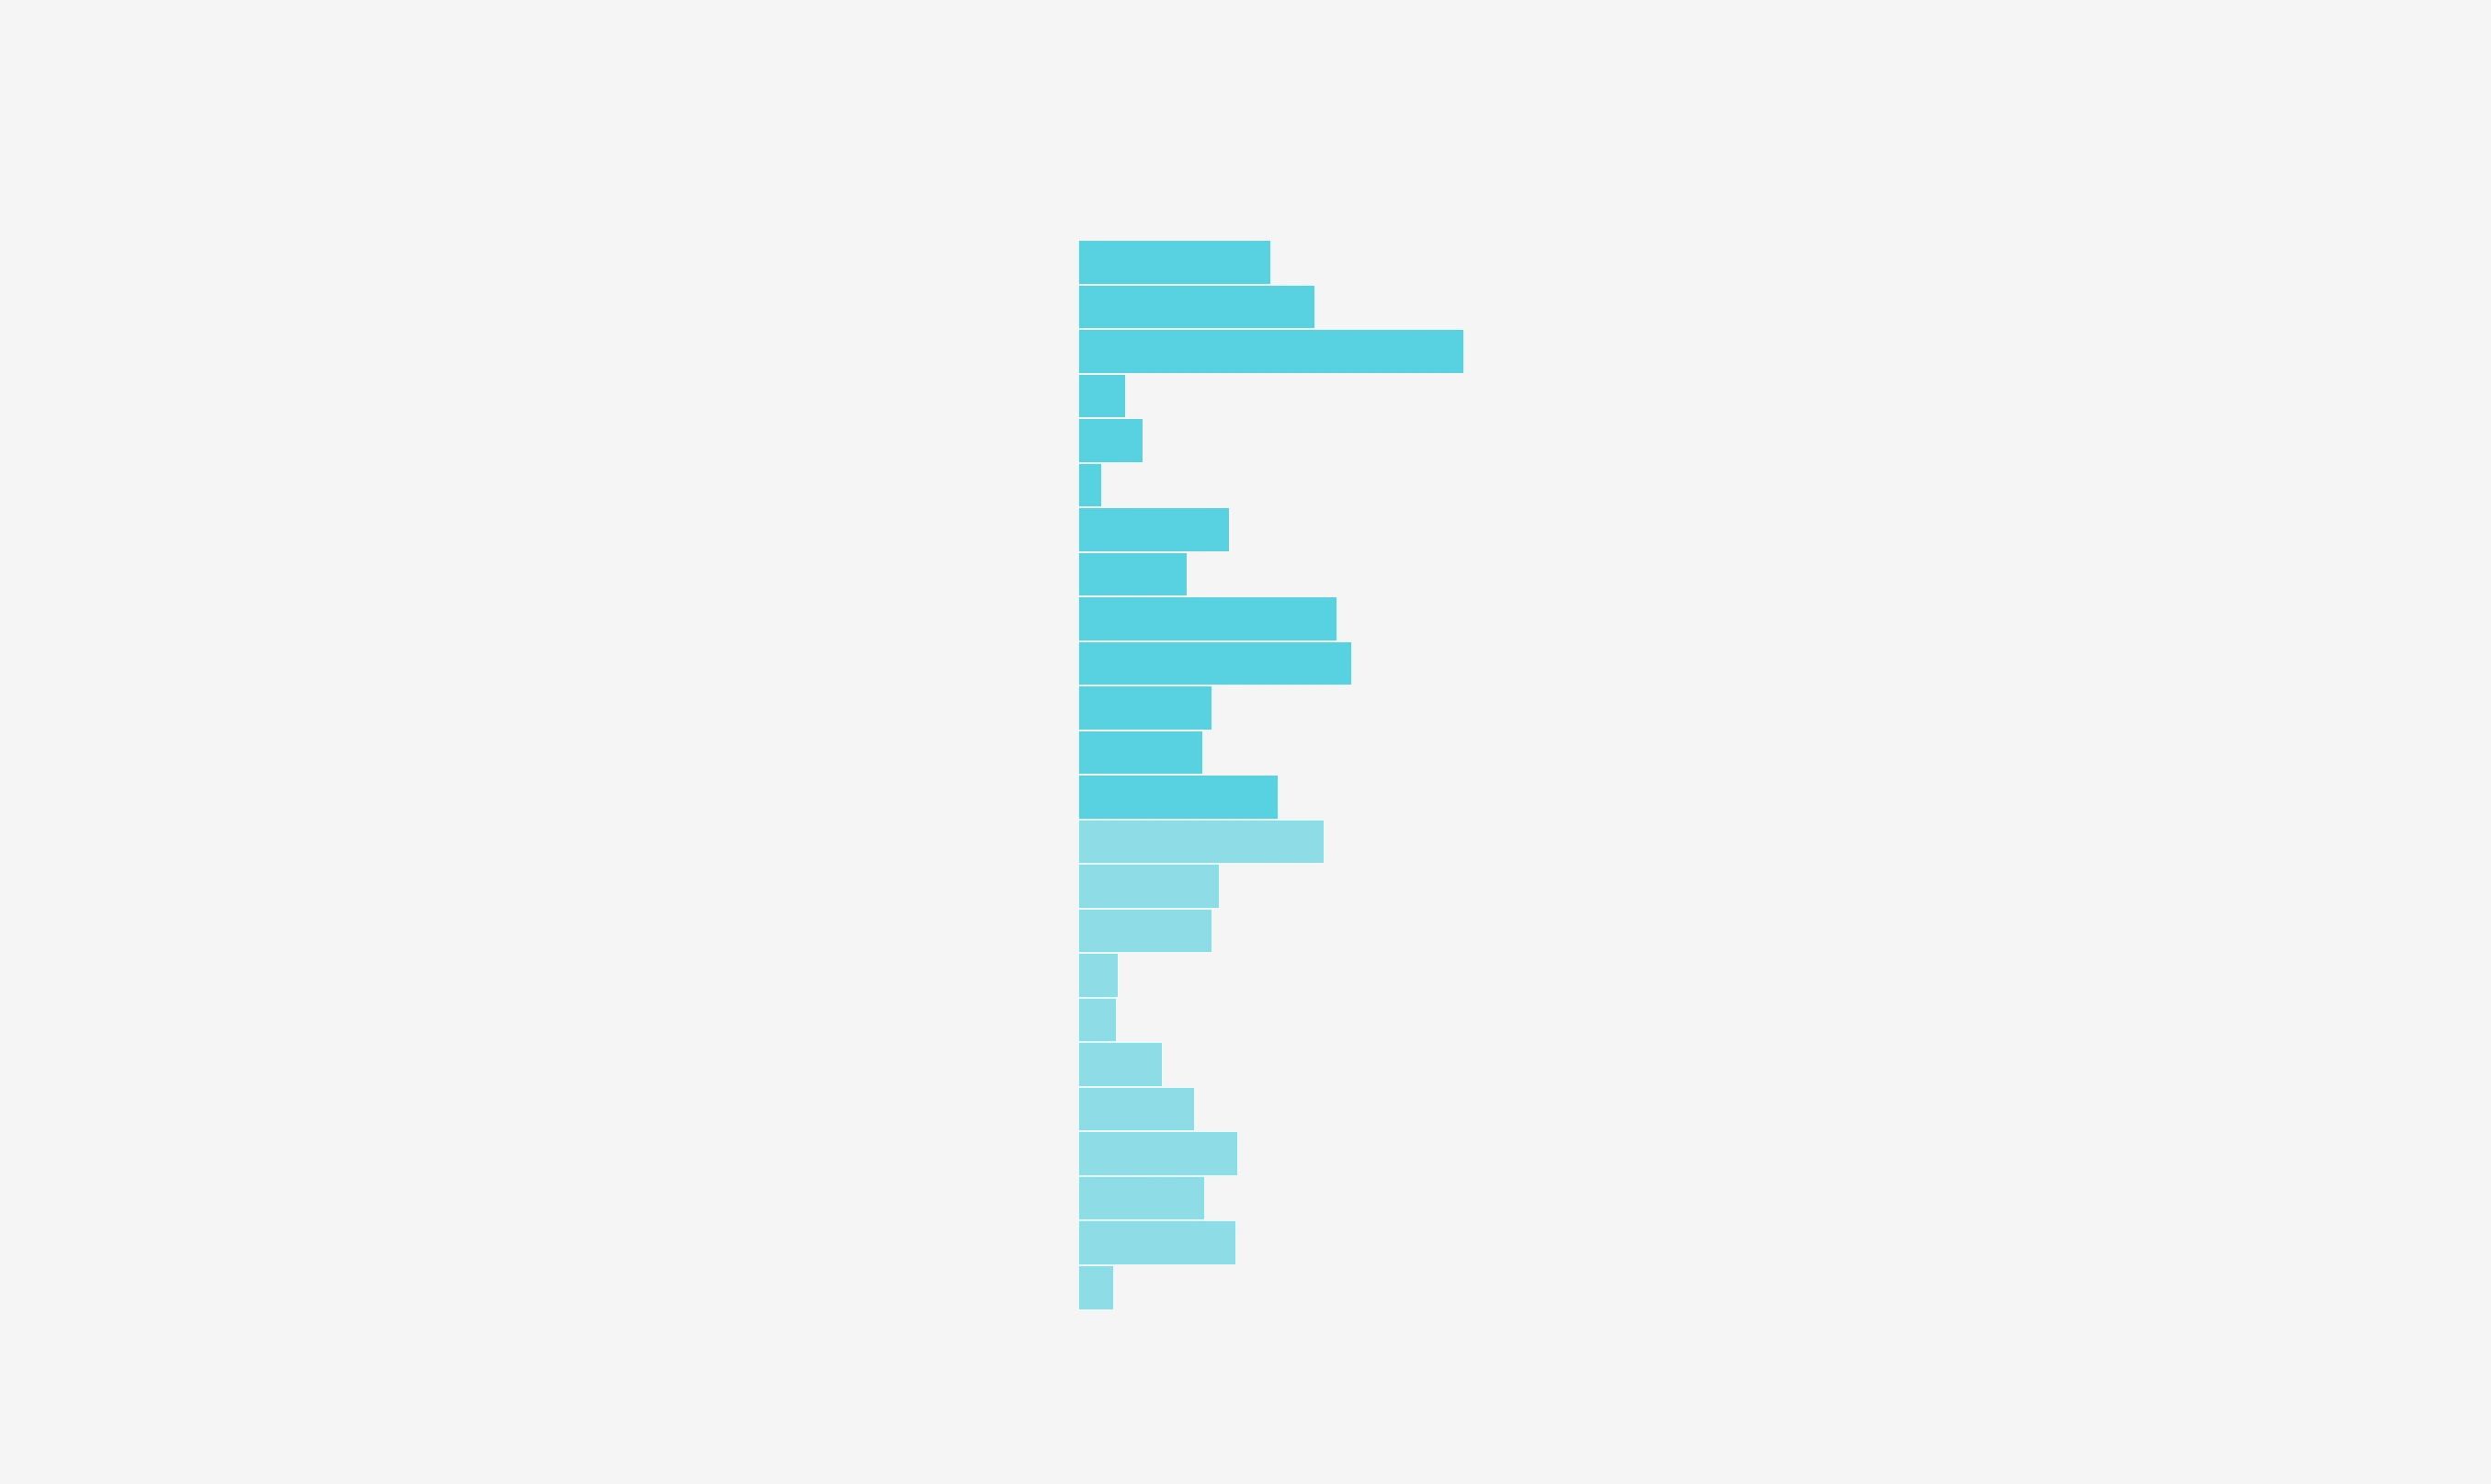
Volume profile is a classic orderflow tool visualizing how volume is built over time with horizontal bars.
Whereas normal volume is the total sum of all trading volume within a candle, volume profile tells us where the volume is distributed within candle.
This is what a volume profile looks like. The bigger the bar, the larger the volume traded.
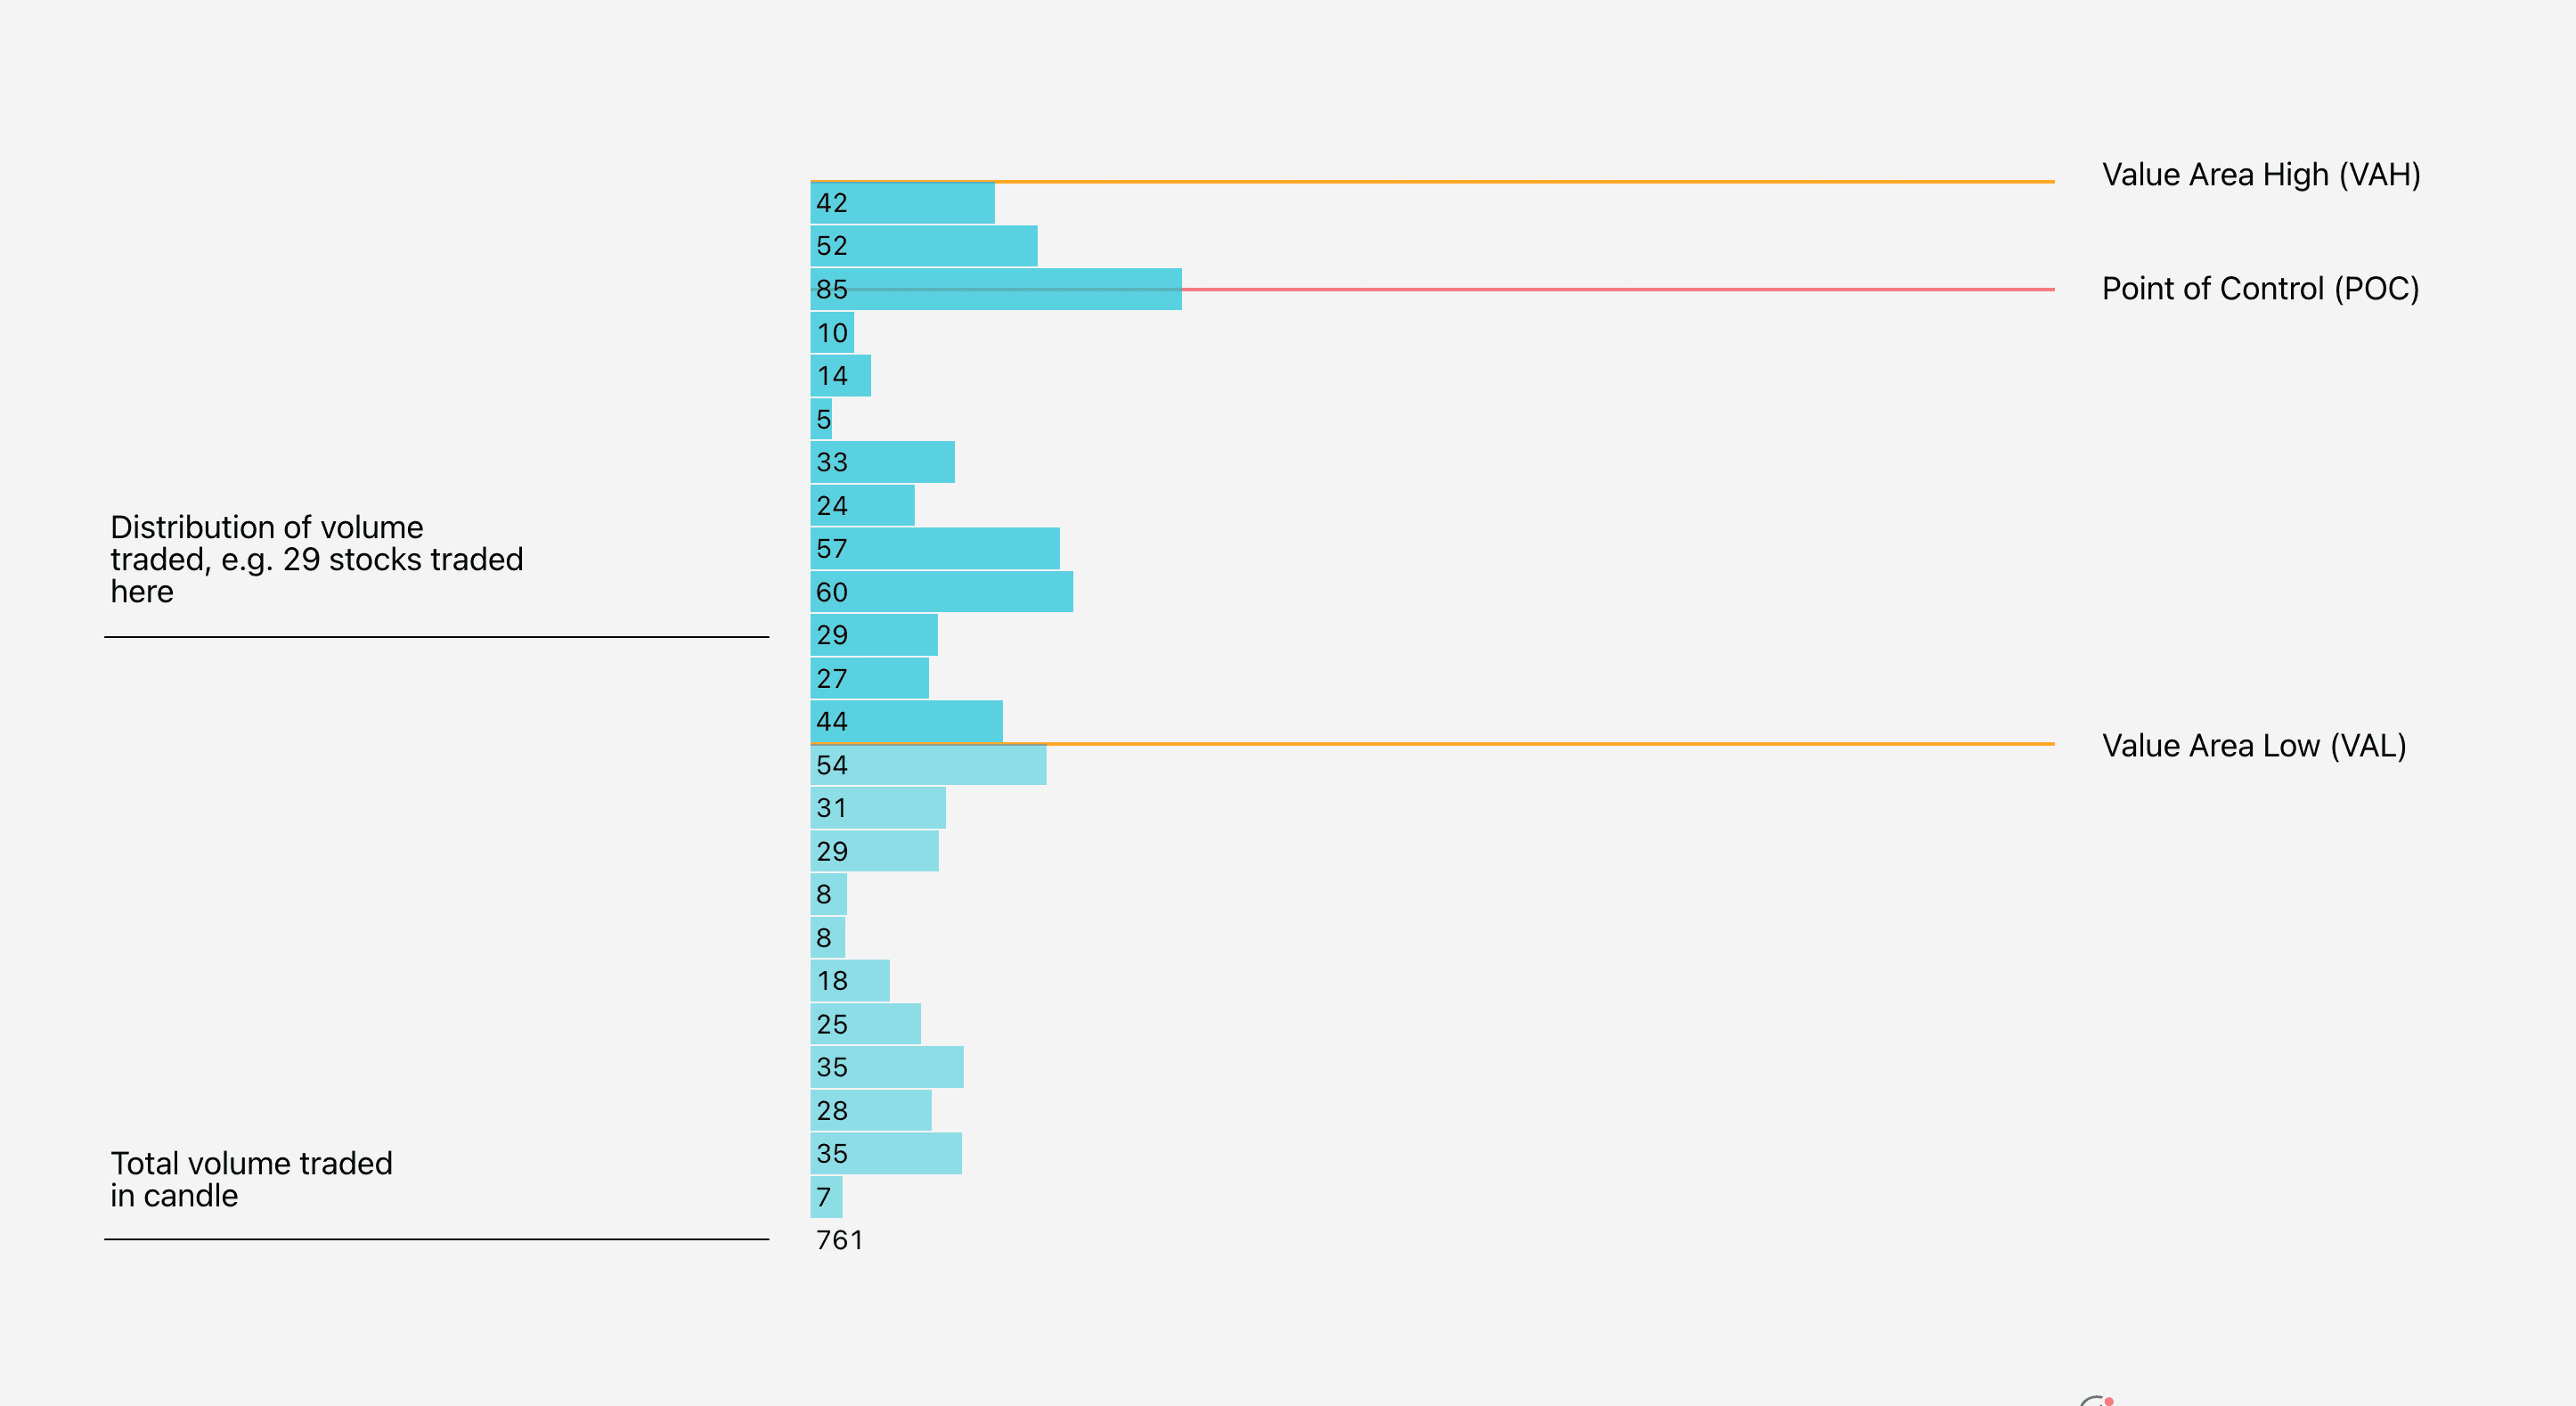
A volume profile can be condensed into two key pieces of information: value area and point of control.
What is Value Area?
Value area represents a range where most (by default 70%) volume within the candle is traded, The upper end of the range is called value area high (VAH) and lower end value area low (VAL).
This is the price range where most traders executed their trades, telling us where the majority of interest is.
What is Point of Control?
Point of control on the other hand is the single highest volume cumulation, the largest bar in a volume profile. This is the pinnacle of traders interest, falling somewhere within value area.
Let’s revisit the image of a volume profile with value area and point of control illustrated.
What is volume profile in trading?
Volume profile is a classic orderflow tool visualizing how volume is built over time with horizontal bars.
Whereas normal volume is the total sum of all trading volume within a candle, volume profile tells us where the volume is distributed within candle.
This is what a volume profile looks like. The bigger the bar, the larger the volume traded.
A volume profile can be condensed into two key pieces of information: value area and point of control.
What is Value Area?
Value area represents a range where most (by default 70%) volume within the candle is traded, The upper end of the range is called value area high (VAH) and lower end value area low (VAL).
This is the price range where most traders executed their trades, telling us where the majority of interest is.
What is Point of Control?
Point of control on the other hand is the single highest volume cumulation, the largest bar in a volume profile. This is the pinnacle of traders interest, falling somewhere within value area.
Let’s revisit the image of a volume profile with value area and point of control illustrated.
Value Area and Point of Control in FlowMap
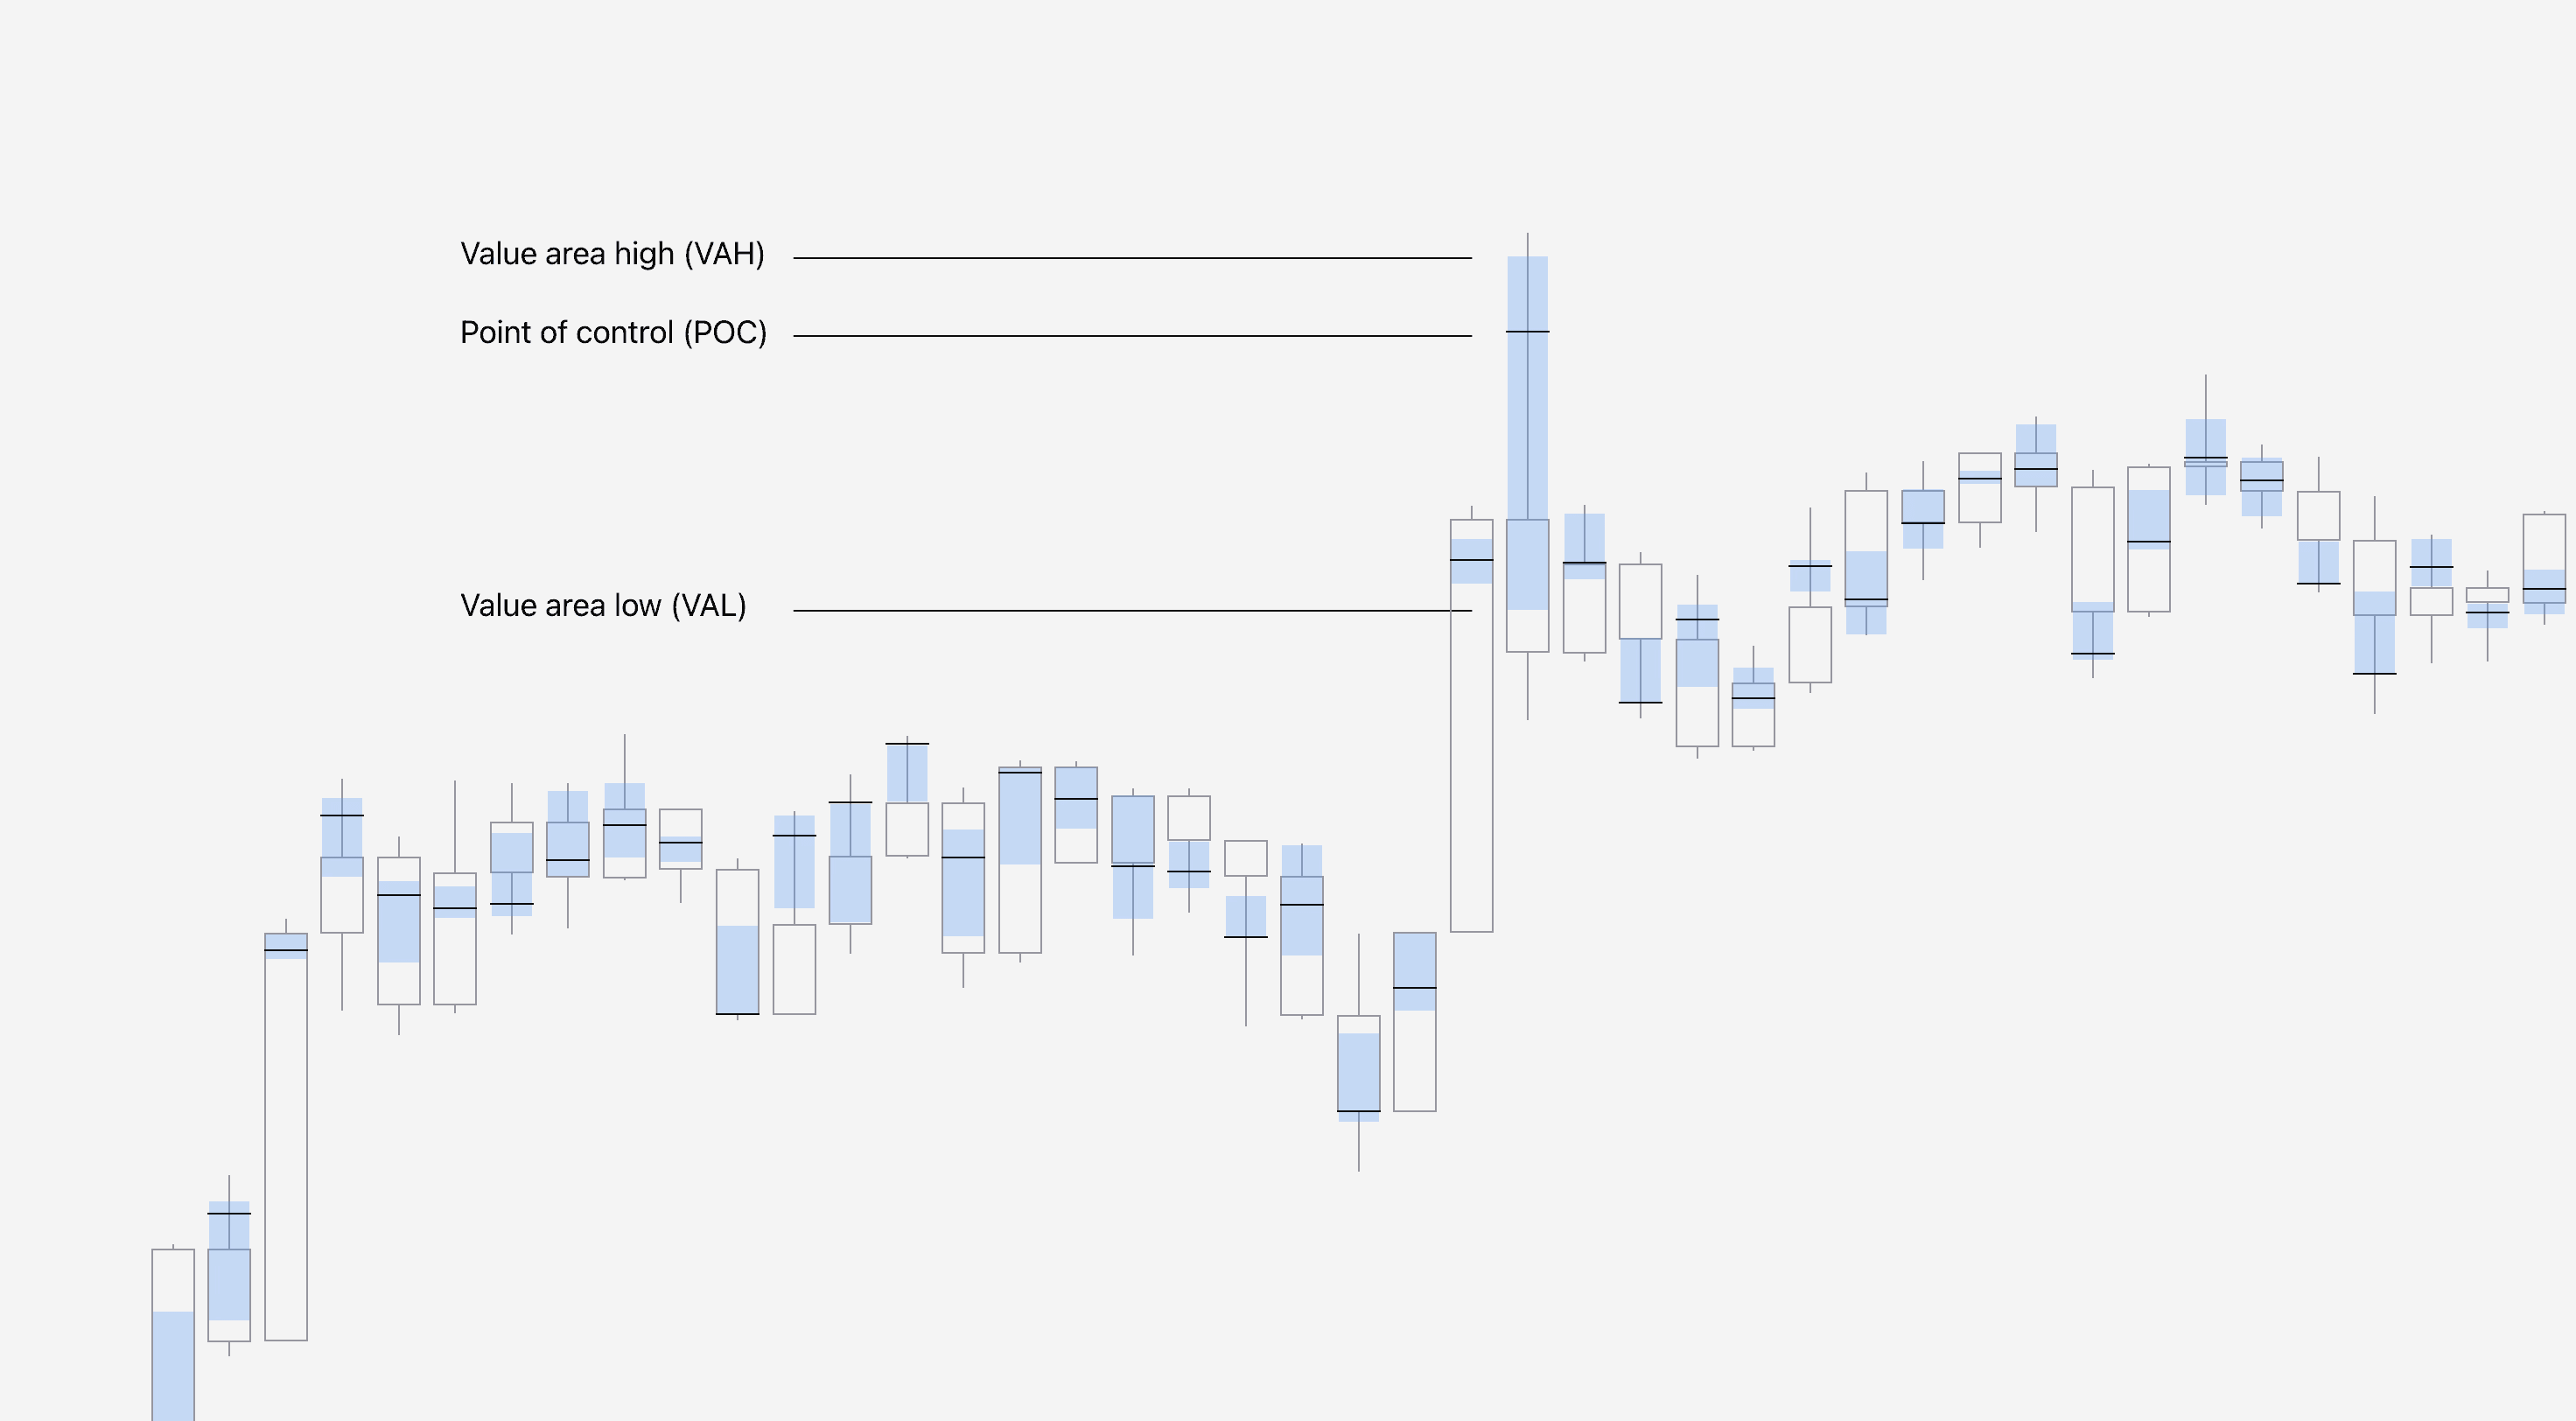
Instead of a full fledged volume profile, FlowMap displays the key information, value area and point of control.
This gives an easy read into the essentials, telling where vast and highest majority of traders showed interest.
In FlowMap, value area is visualized using a blue box, overlayed on top of candles. The black line within the value area is where the point of control is situated.
Value Area and Point of Control in FlowMap
Instead of a full fledged volume profile, FlowMap displays the key information, value area and point of control.
This gives an easy read into the essentials, telling where vast and highest majority of traders showed interest.
In FlowMap, value area is visualized using a blue box, overlayed on top of candles. The black line within the value area is where the point of control is situated.
How to trade Value Area and Point of Control
Value area and point of control are simple but powerful as they give us visual view of how majority of traders are positioned.
When we evaluate this information with the context of price action, we can detect insights that by default we would miss completely.
For example, we can conclude with high accuracy what the intention behind a price move might be and if majority of traders are in profit or at loss.
Identify absorption using Value Area and Point of Control
A simple reversal play using value area and point of control is absorption.
Absorption refers to an event where most trading volume is located at a wick in a reversal shape candle.
In absorption, the wick tells us price moved one way and then swiftly rejected.
Since the value area and therefore most of the volume is sitting in the wick, we can conclude this area in price has large buy/sell orders that “absorbed” the incoming trades.
Psychologically speaking, the traders who executed their trades in the wick are also immediately at loss and compelled to close their trades, adding further pressure to any forming reversal.
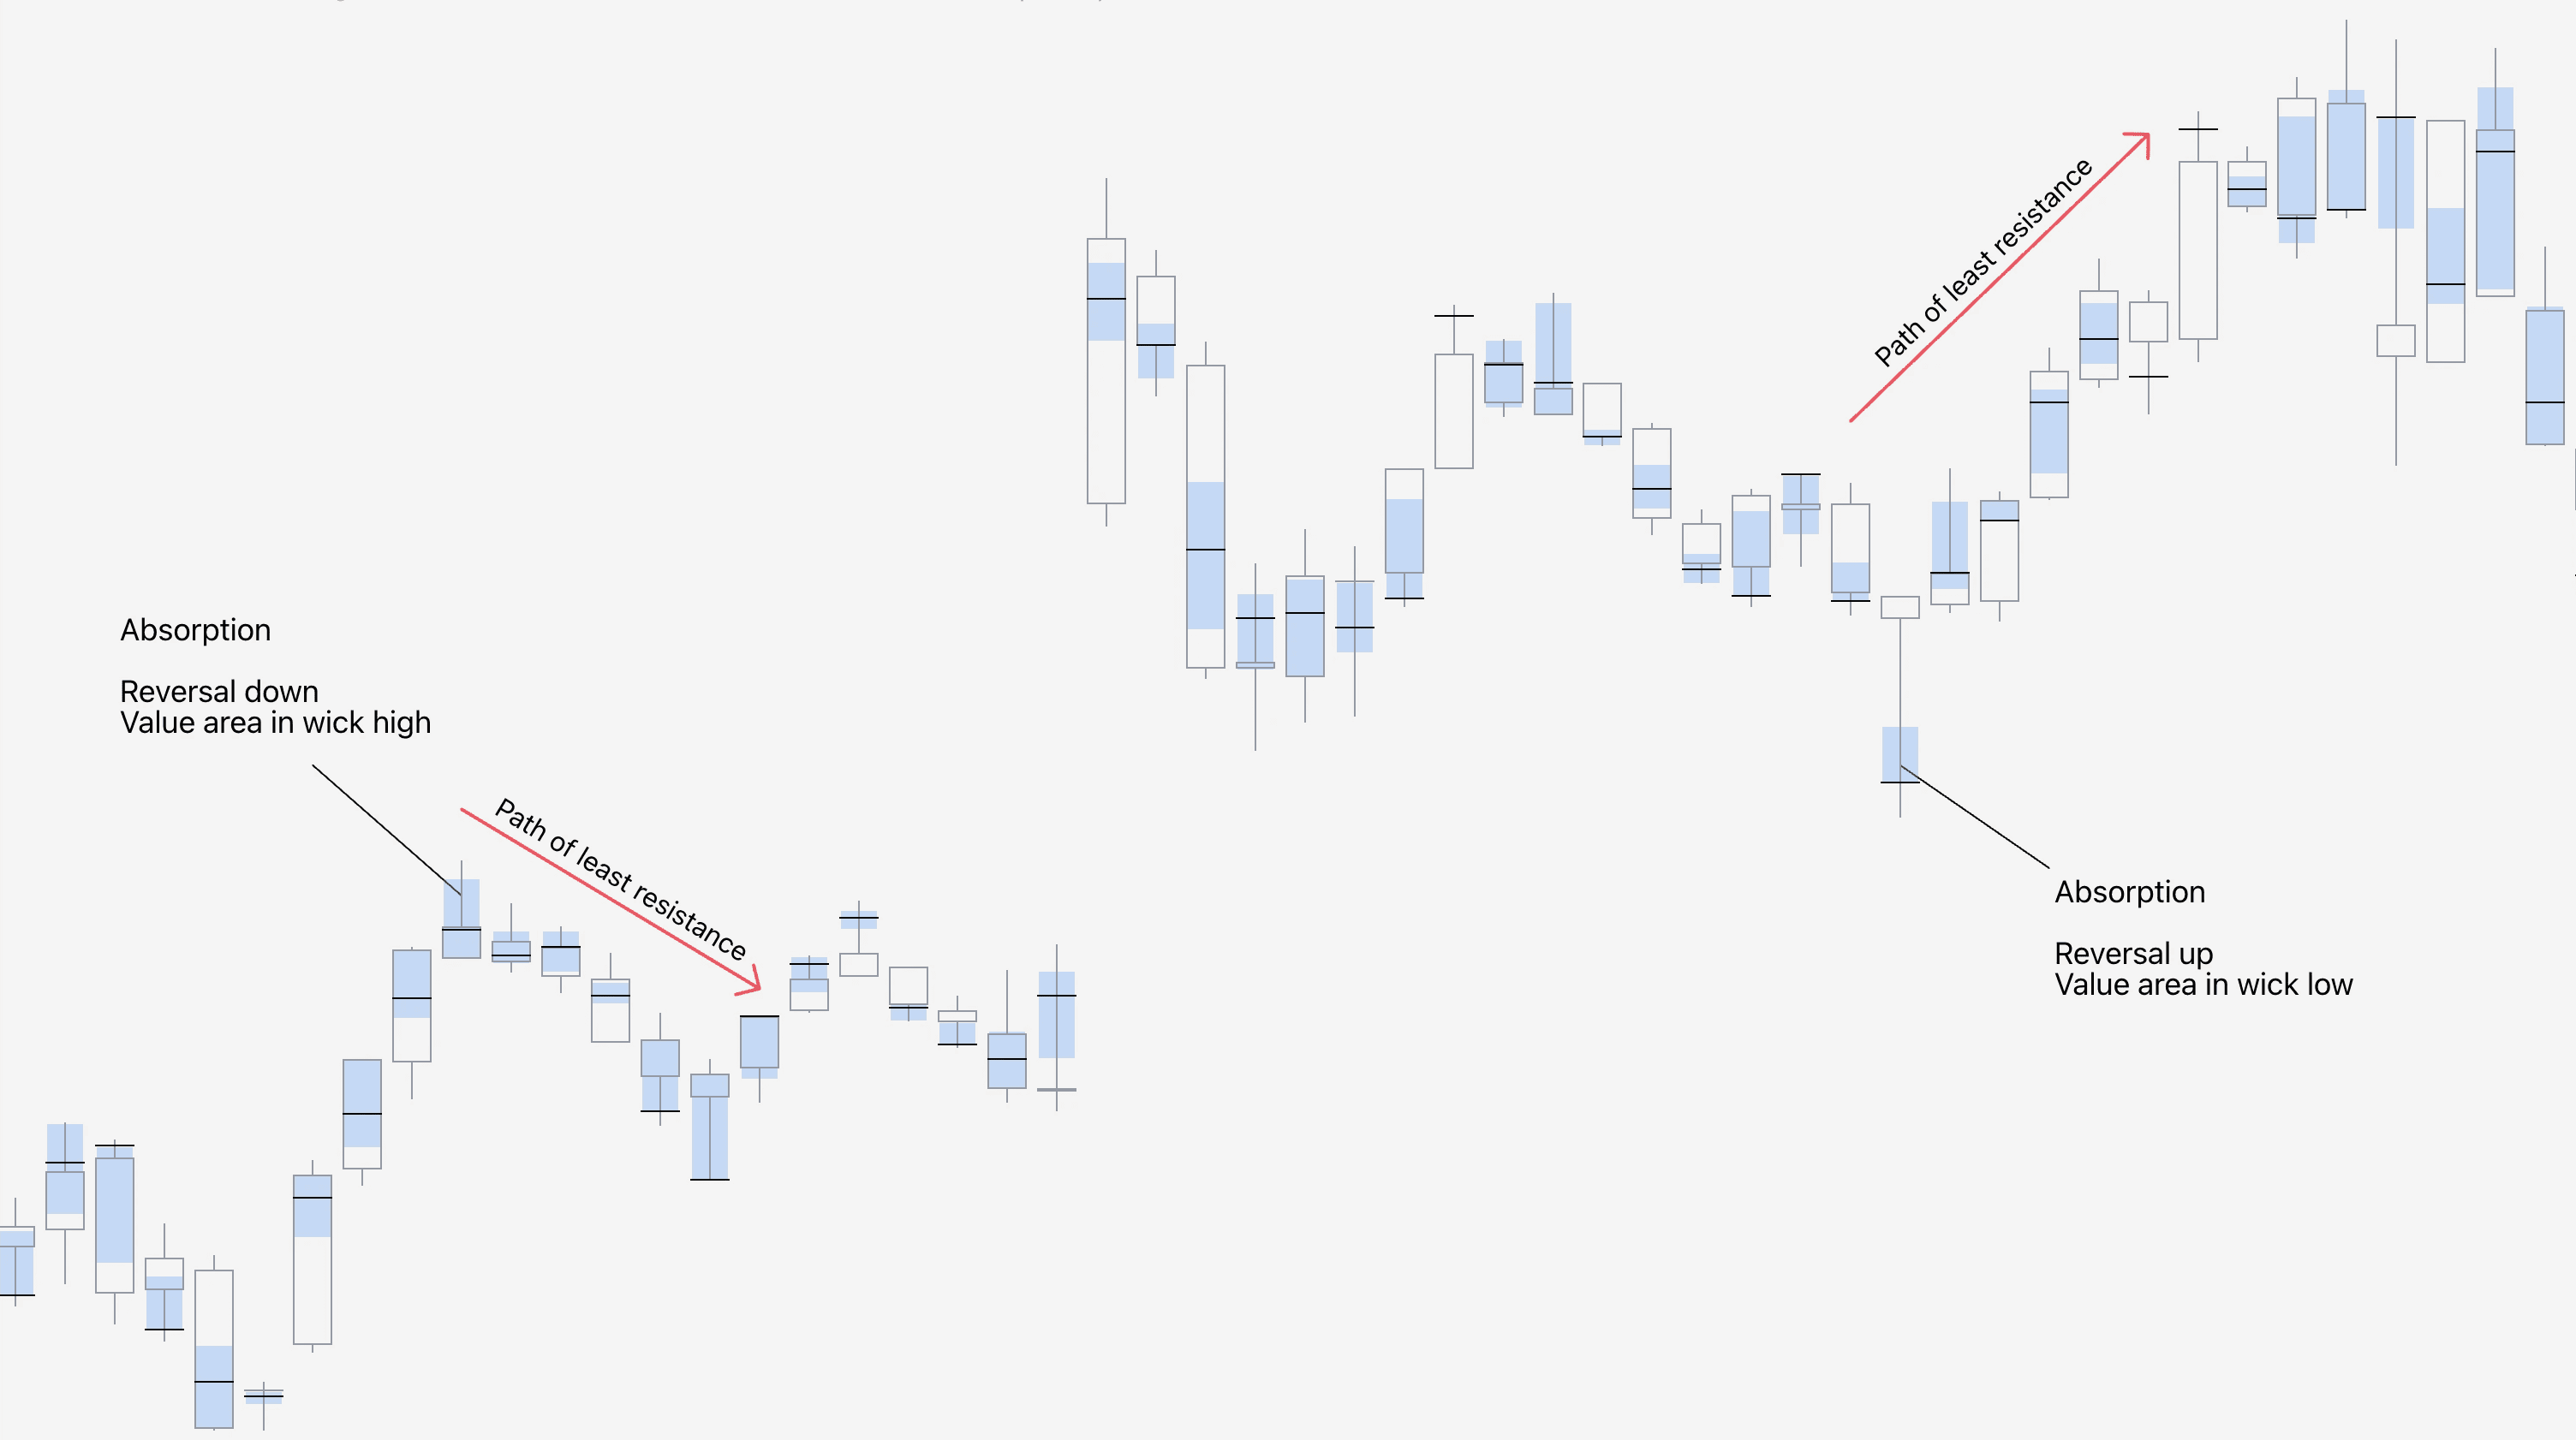
Absorption is best thought of in terms of path of hard resistance and path of least resistance.
When traders are absorbed into an upside price move, the path of hard resistance is further upside. Path of least resistance or the easy way is to the opposite direction, downside.
That’s just one example for taking advantage of value area and point of control. Find more examples in these playbooks👇
How to trade Value Area and Point of Control
Value area and point of control are simple but powerful as they give us visual view of how majority of traders are positioned.
When we evaluate this information with the context of price action, we can detect insights that by default we would miss completely.
For example, we can conclude with high accuracy what the intention behind a price move might be and if majority of traders are in profit or at loss.
Identify absorption using Value Area and Point of Control
A simple reversal play using value area and point of control is absorption.
Absorption refers to an event where most trading volume is located at a wick in a reversal shape candle.
In absorption, the wick tells us price moved one way and then swiftly rejected.
Since the value area and therefore most of the volume is sitting in the wick, we can conclude this area in price has large buy/sell orders that “absorbed” the incoming trades.
Psychologically speaking, the traders who executed their trades in the wick are also immediately at loss and compelled to close their trades, adding further pressure to any forming reversal.
Absorption is best thought of in terms of path of hard resistance and path of least resistance.
When traders are absorbed into an upside price move, the path of hard resistance is further upside. Path of least resistance or the easy way is to the opposite direction, downside.
That’s just one example for taking advantage of value area and point of control. Find more examples in these playbooks👇
Mentioned in this section
Dive deeper into topics mentioned
Mentioned in this section
Dive deeper into topics mentioned
Mentioned in this section
Dive deeper into topics mentioned


You’re gaining value by learning 💪
That’s how value area and point of control work in FlowMap. They’re quick and easy way to gauge where most trading activity is going on.
We can use this information to detect when price has found supply as well as when traders are being subject to market psychology like loss covering.
There’s more value on the table, keep going! Here’s all the other lessons for mastering FlowMap 👇


