

What is PineScreener?
PineScreener is TradingView's screener tool that allows scanning watchlists of charts at once using any indicator available on TradingView.
As of writing this article, PineScreener is still in beta with the following timeframes supported for scanning.
Lower timeframes | Mid-timeframes | High timeframes |
|---|---|---|
1 minute | 1 hour | 1 day |
5 minute | 2 hour | 1 week |
15 minute | 4 hour | 1 month |
30 minute | - | - |
Users should note that PineScreener is a paid TradingView feature, requiring a Premium plan on TradingView.
Preparing a market scan
To find FlowMap on PineScreener, make sure to add it to your favorites. Do this by opening any chart on TradingView and clicking Indicators tab on top menu.
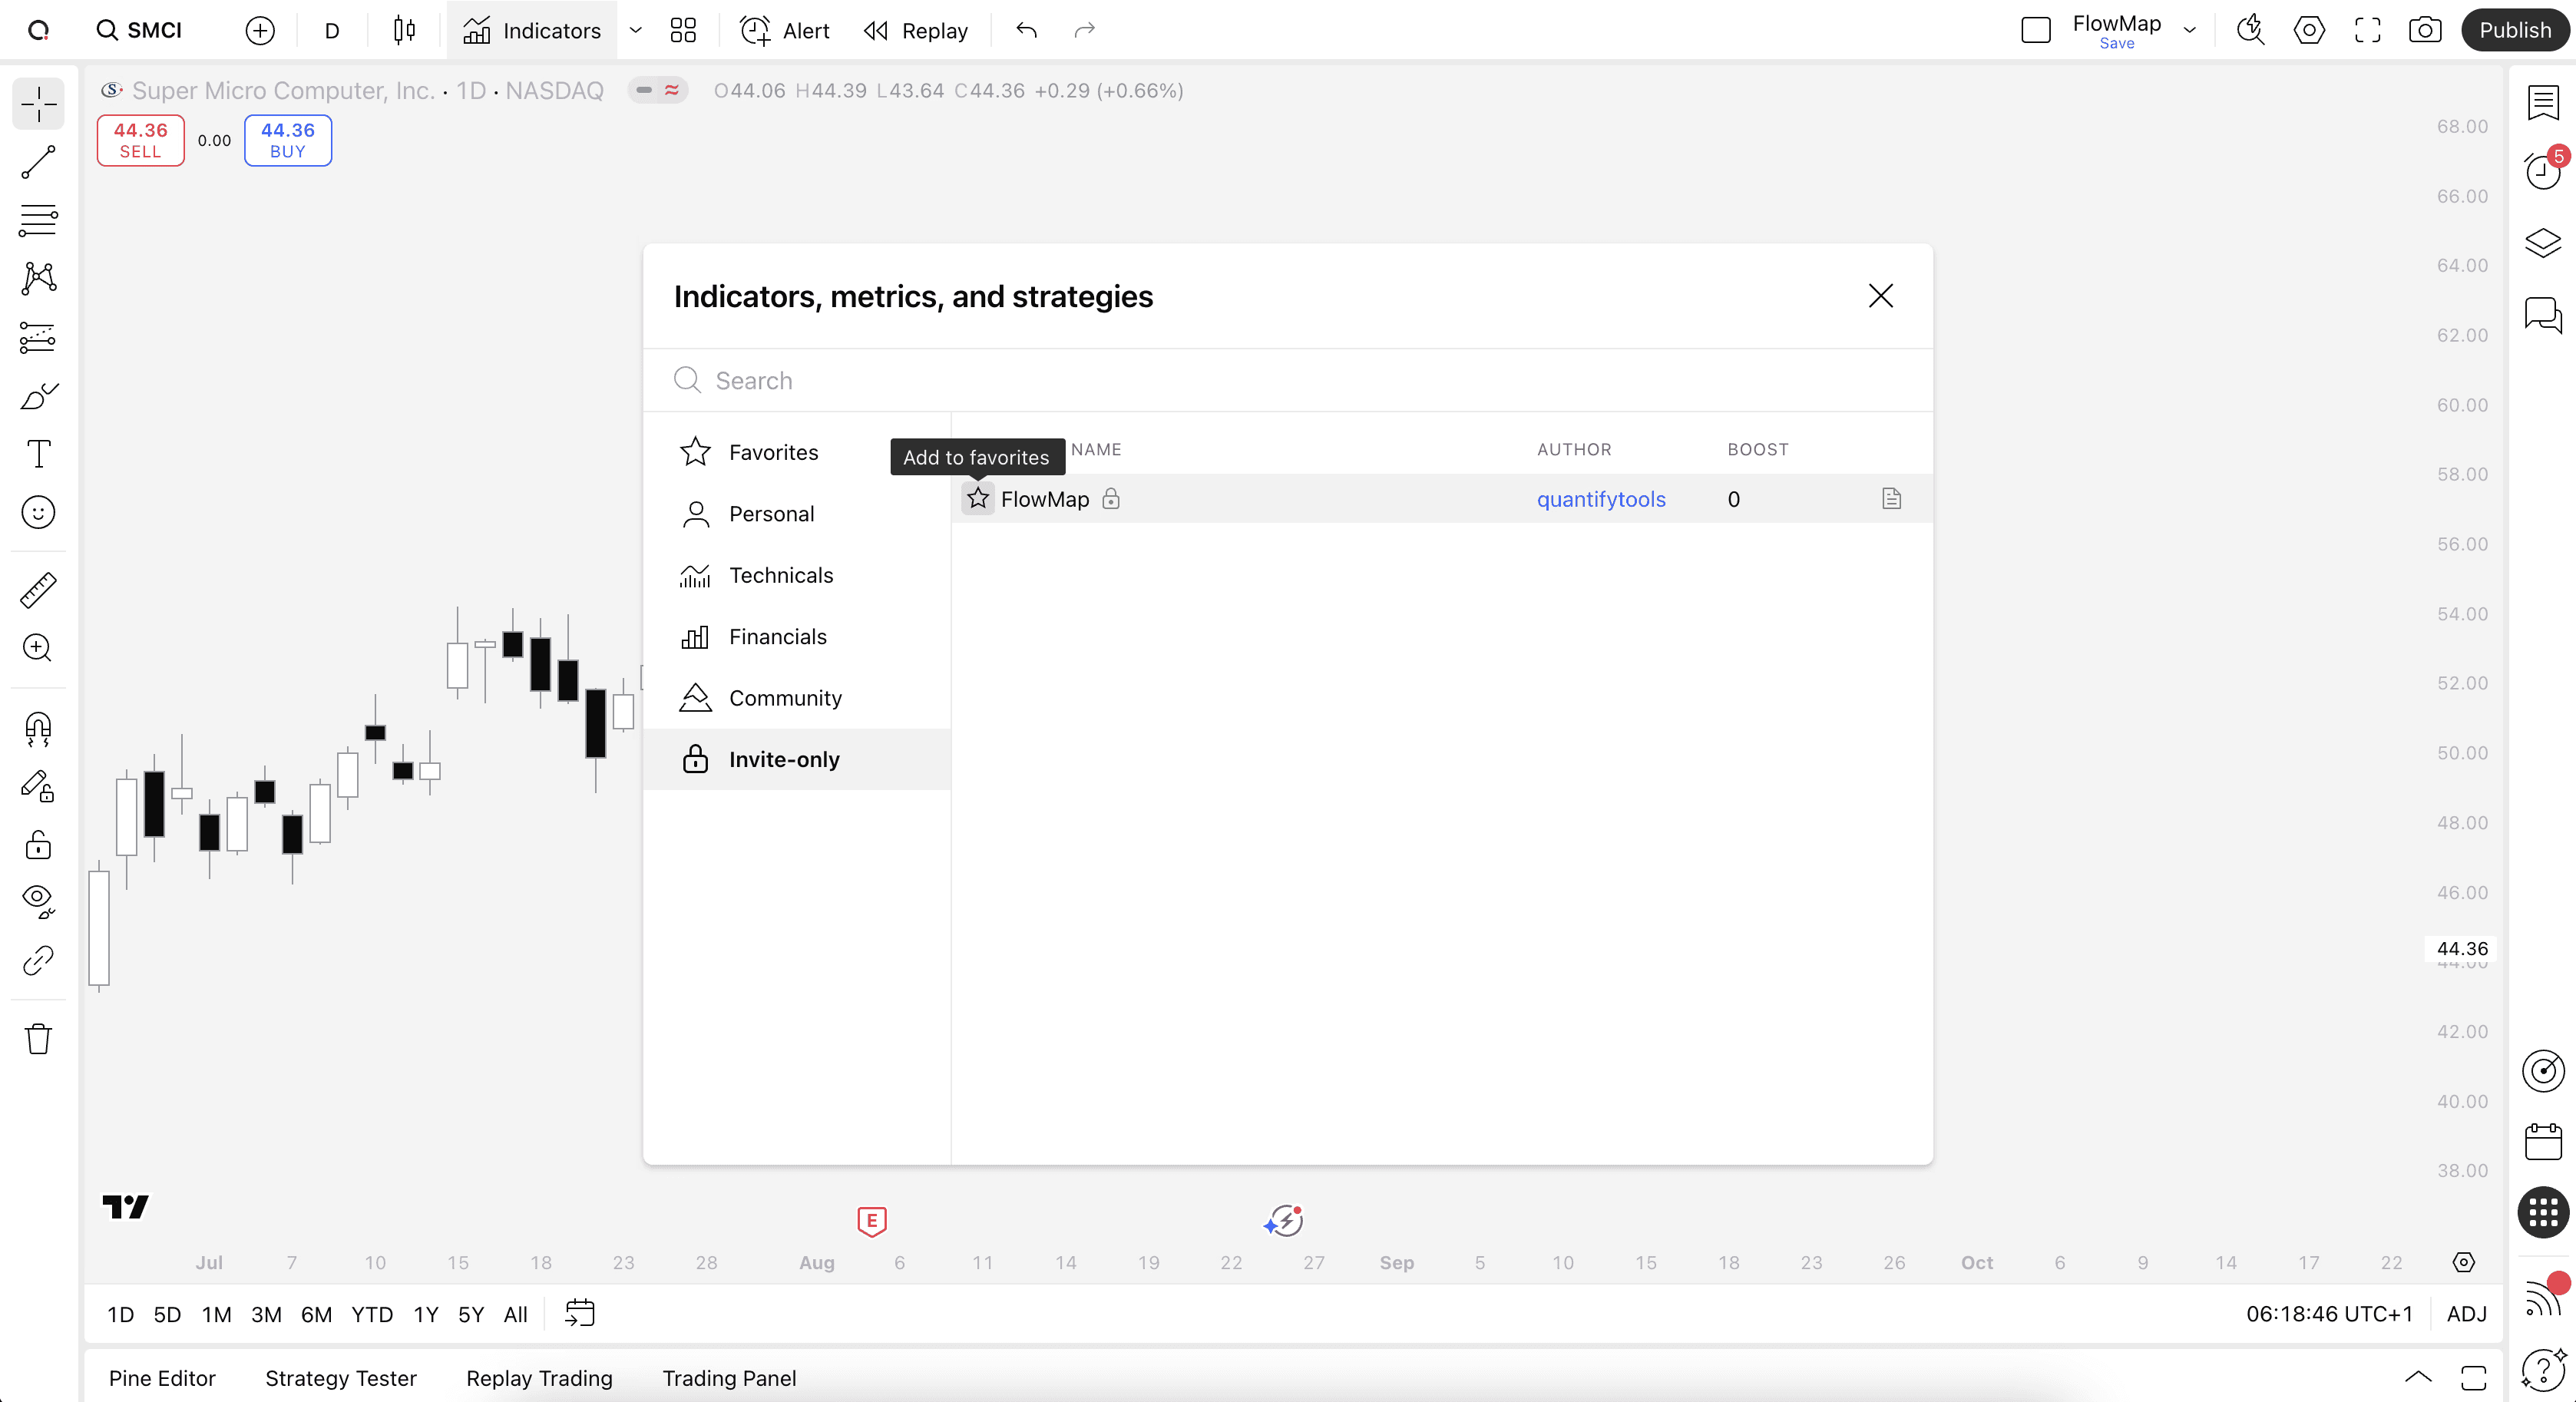
Start by opening any chart on TradingView and clicking "Indicators" on top menu.
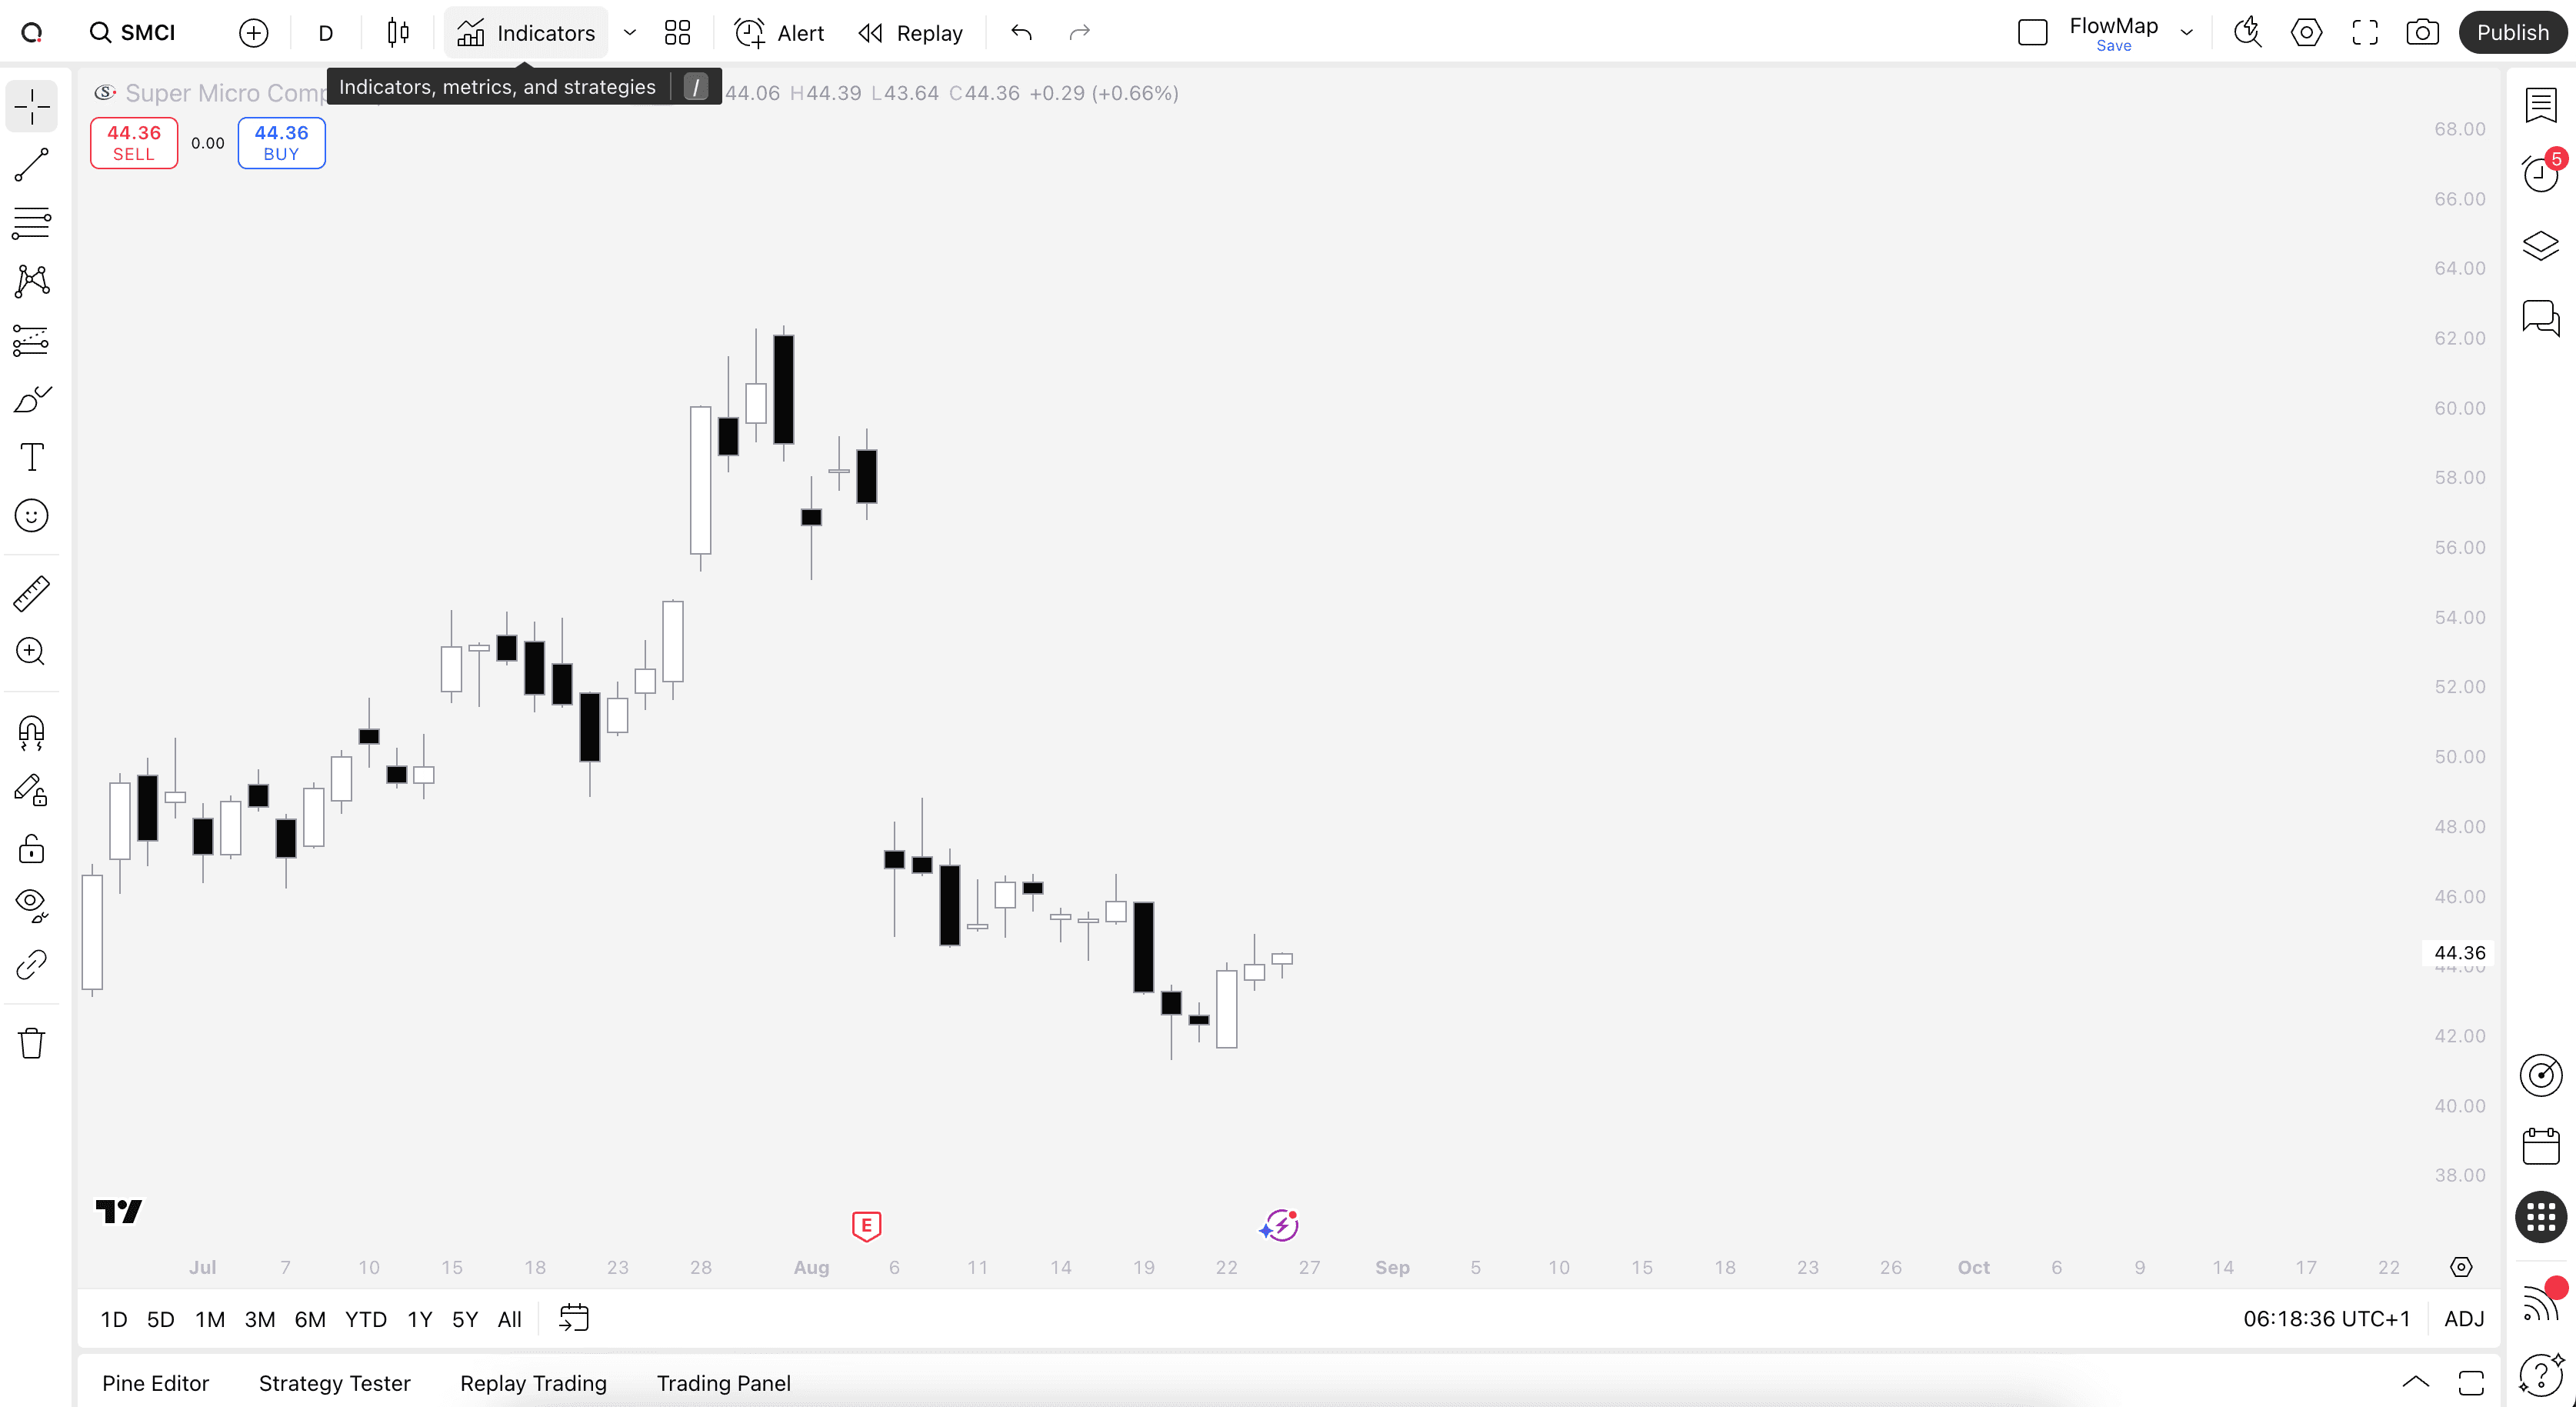
With the menu open, click the star icon next to FlowMap to favorite it. FlowMap can now be found on PineScreener.
Finding PineScreener
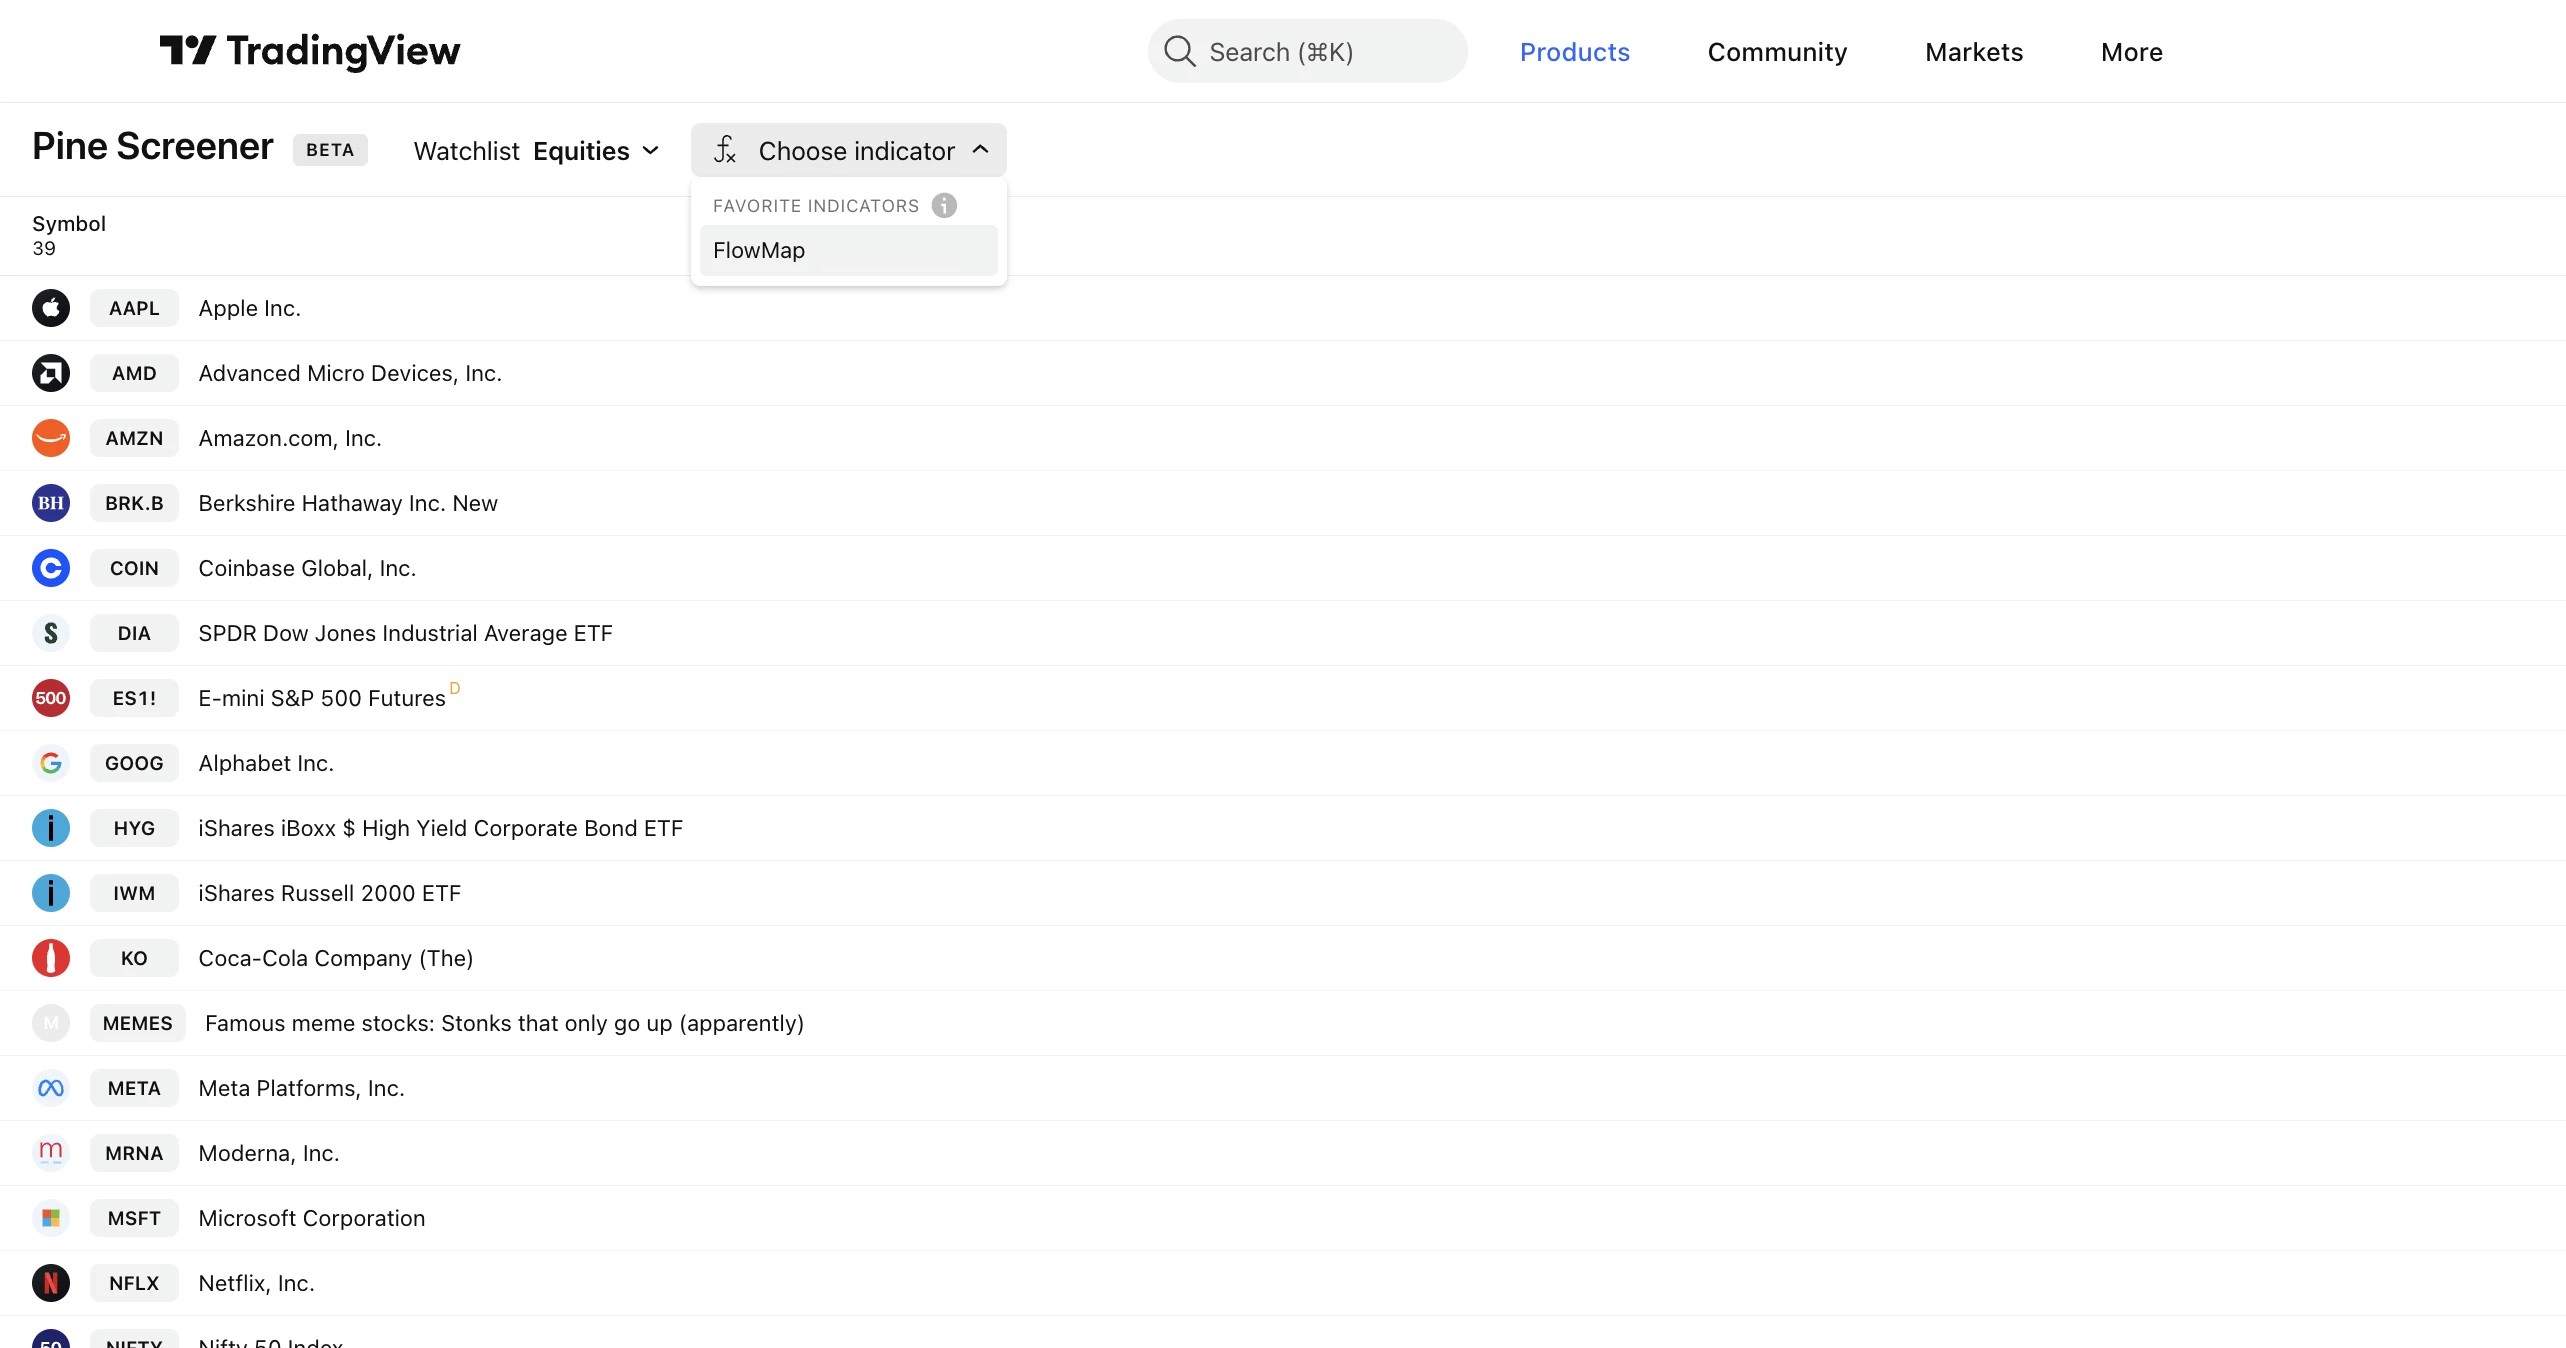
PineScreener is currently available on TradingView's website, found at: www.tradingview.com/pine-screener.
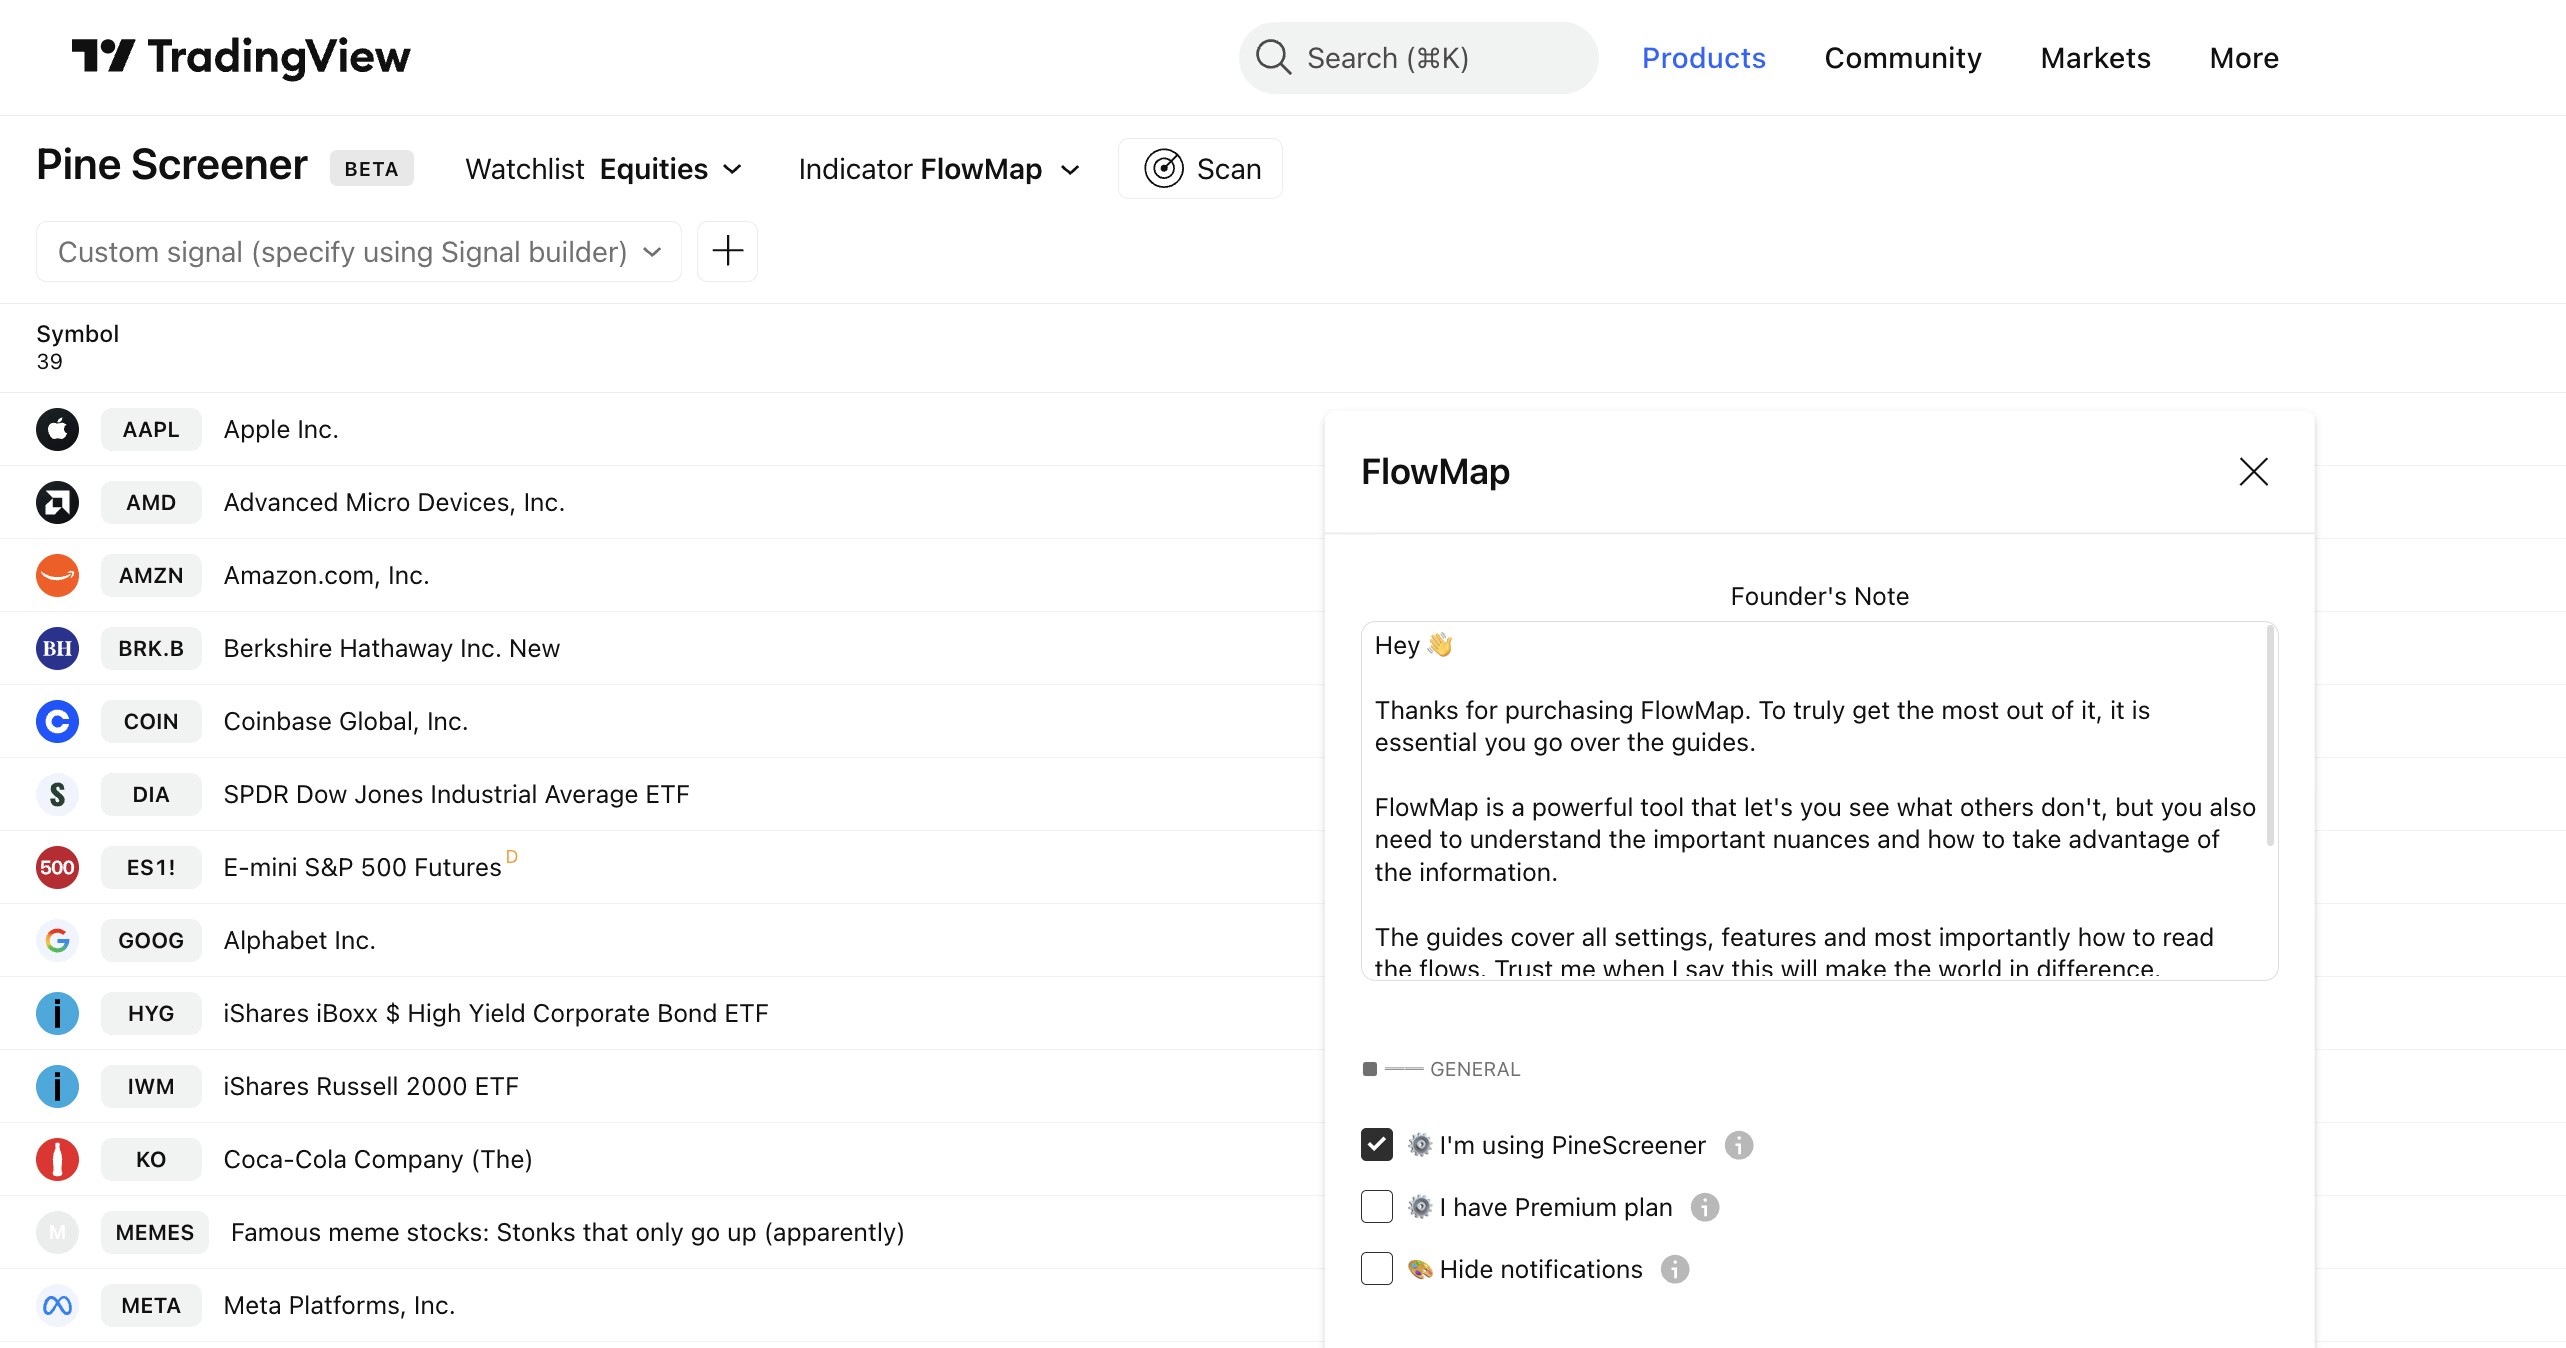
Login to your TradingView account and select FlowMap from favorited indicators to begin.
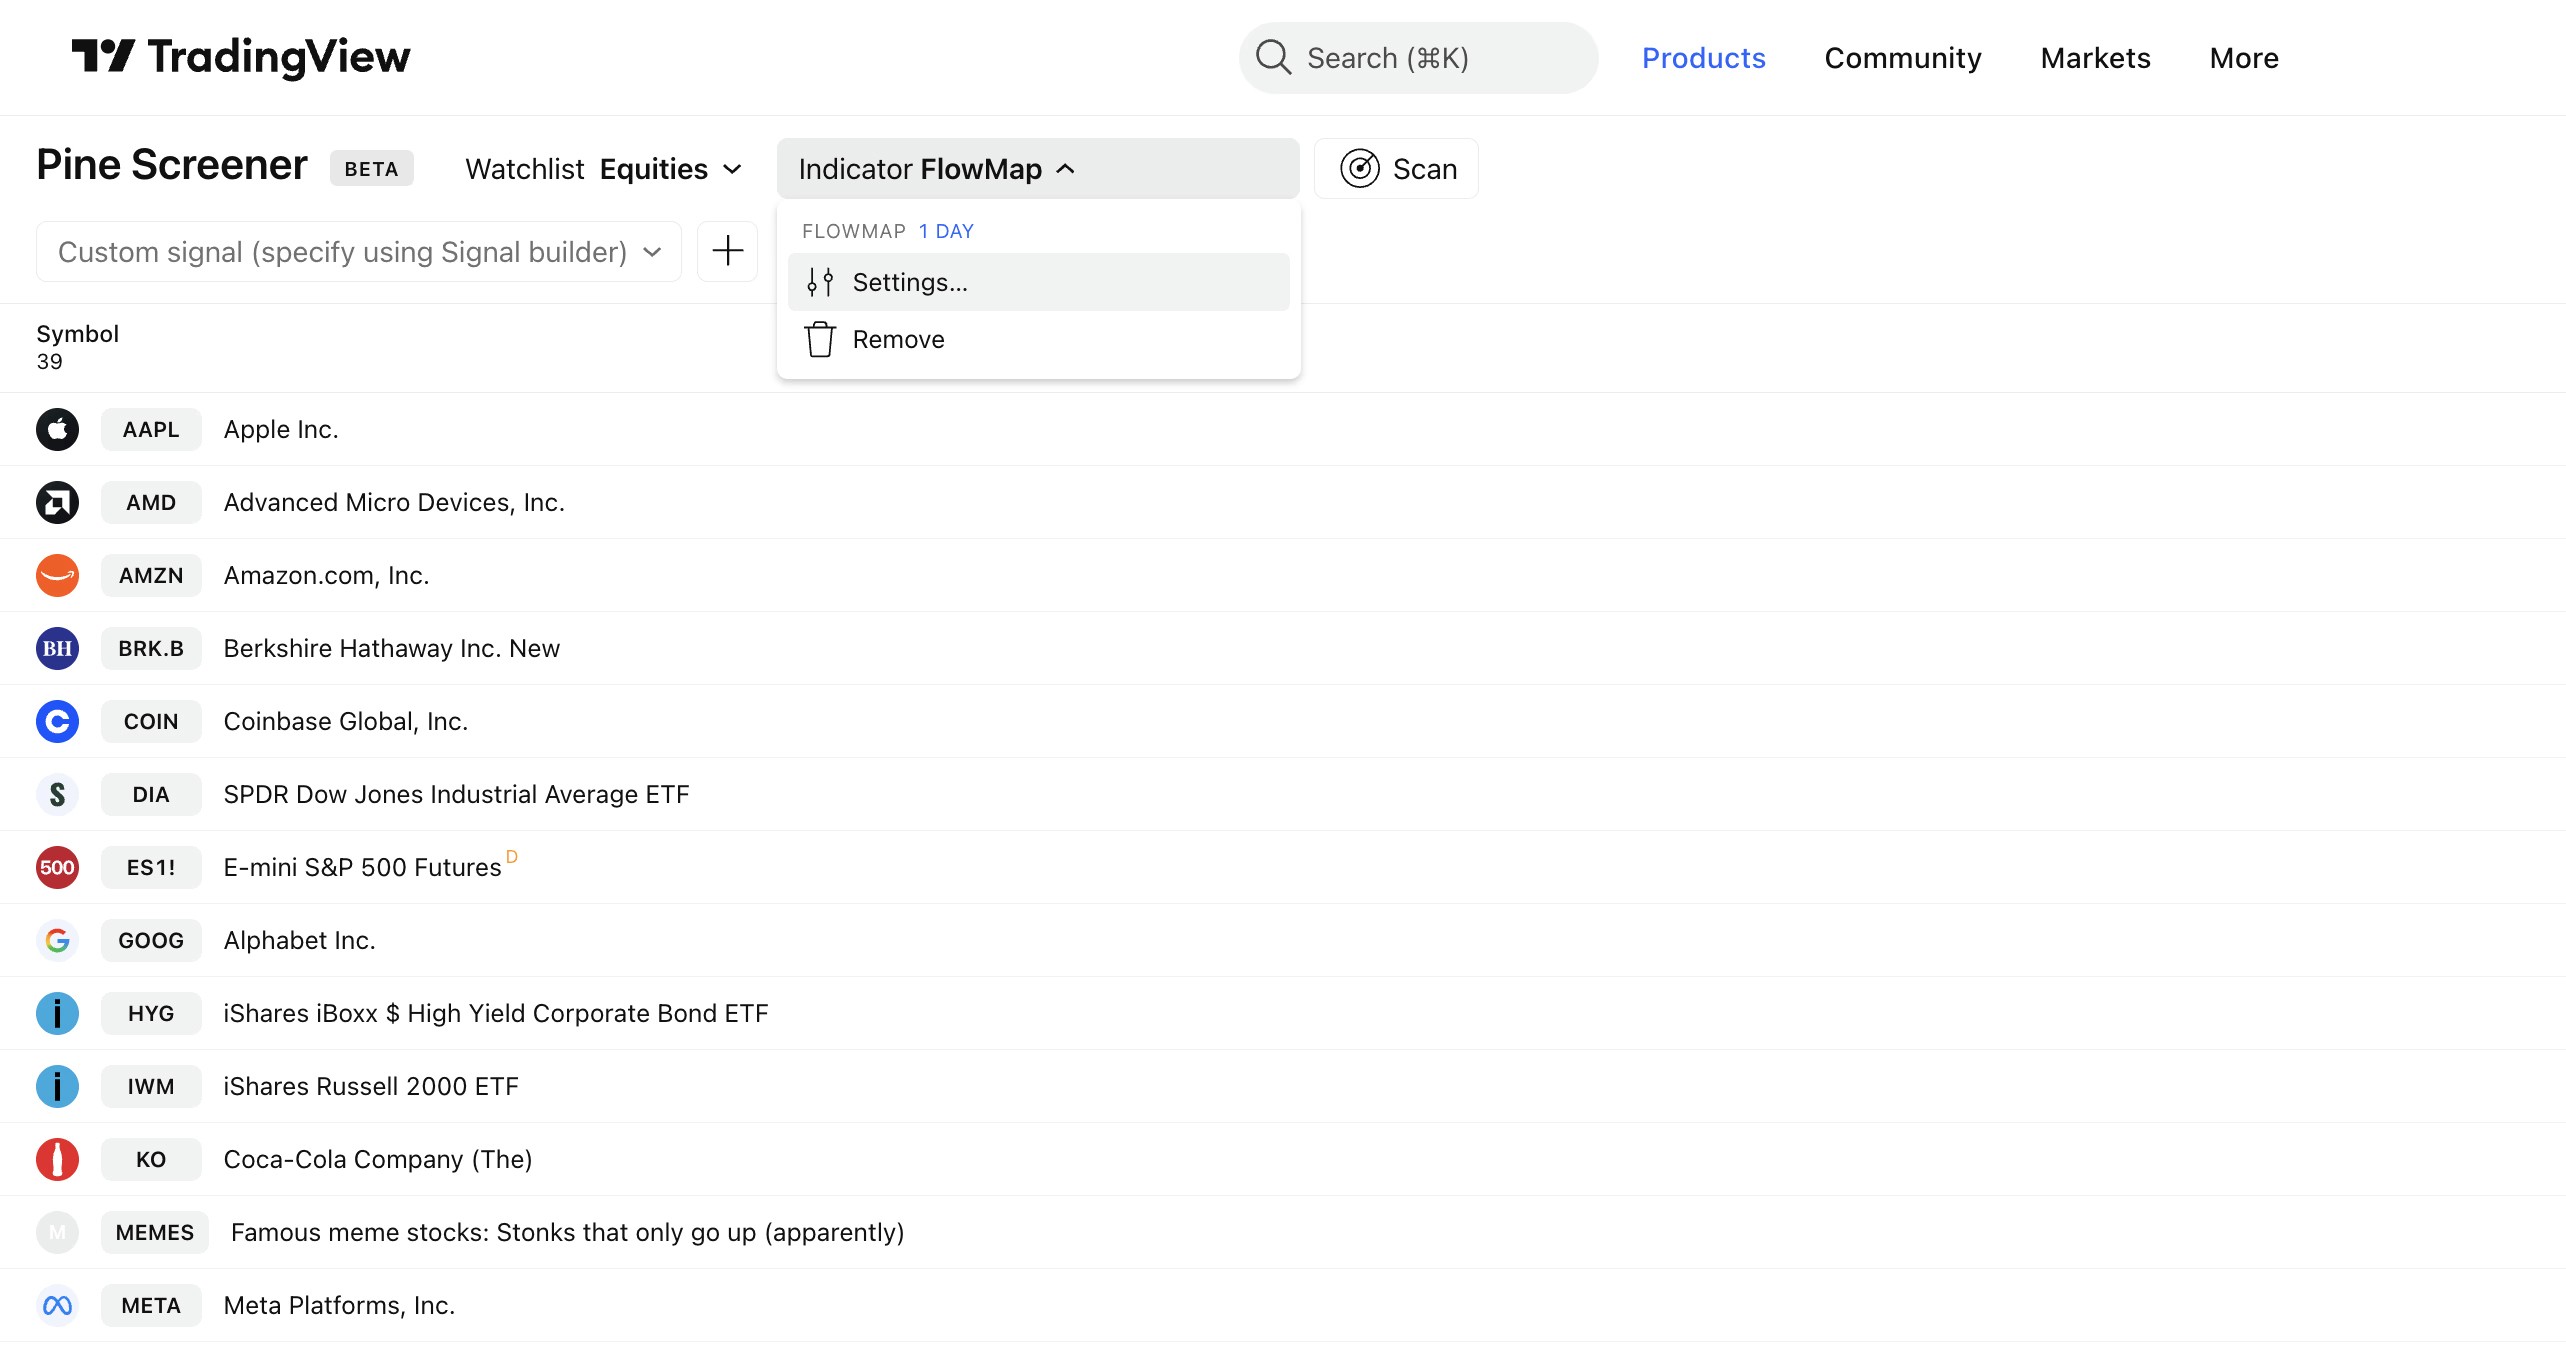
Once FlowMap is selected, make sure the timeframe used for scanning is correct by clicking FlowMap in the menu. Then click on "Settings".
Toggle on “I’m using PineScreener” to let FlowMap know we're about the create a market scan.
Preparing a market scan
To find FlowMap on PineScreener, make sure to add it to your favorites. Do this by opening any chart on TradingView and clicking Indicators tab on top menu.
Start by opening any chart on TradingView and clicking "Indicators" on top menu.
With the menu open, click the star icon next to FlowMap to favorite it. FlowMap can now be found on PineScreener.
Finding PineScreener
PineScreener is currently available on TradingView's website, found at: www.tradingview.com/pine-screener.
Login to your TradingView account and select FlowMap from favorited indicators to begin.
Once FlowMap is selected, make sure the timeframe used for scanning is correct by clicking FlowMap in the menu. Then click on "Settings".
Toggle on “I’m using PineScreener” to let FlowMap know we're about the create a market scan.
Creating a market scan with PineScreener
FlowMap let’s us build a custom signal using any single volume event available or combining multiple into one, which can be used for market scans.
Currently available events are liquidations, liquidity pool sweeps, liquidity pool detected and manipulation.
Building a signal
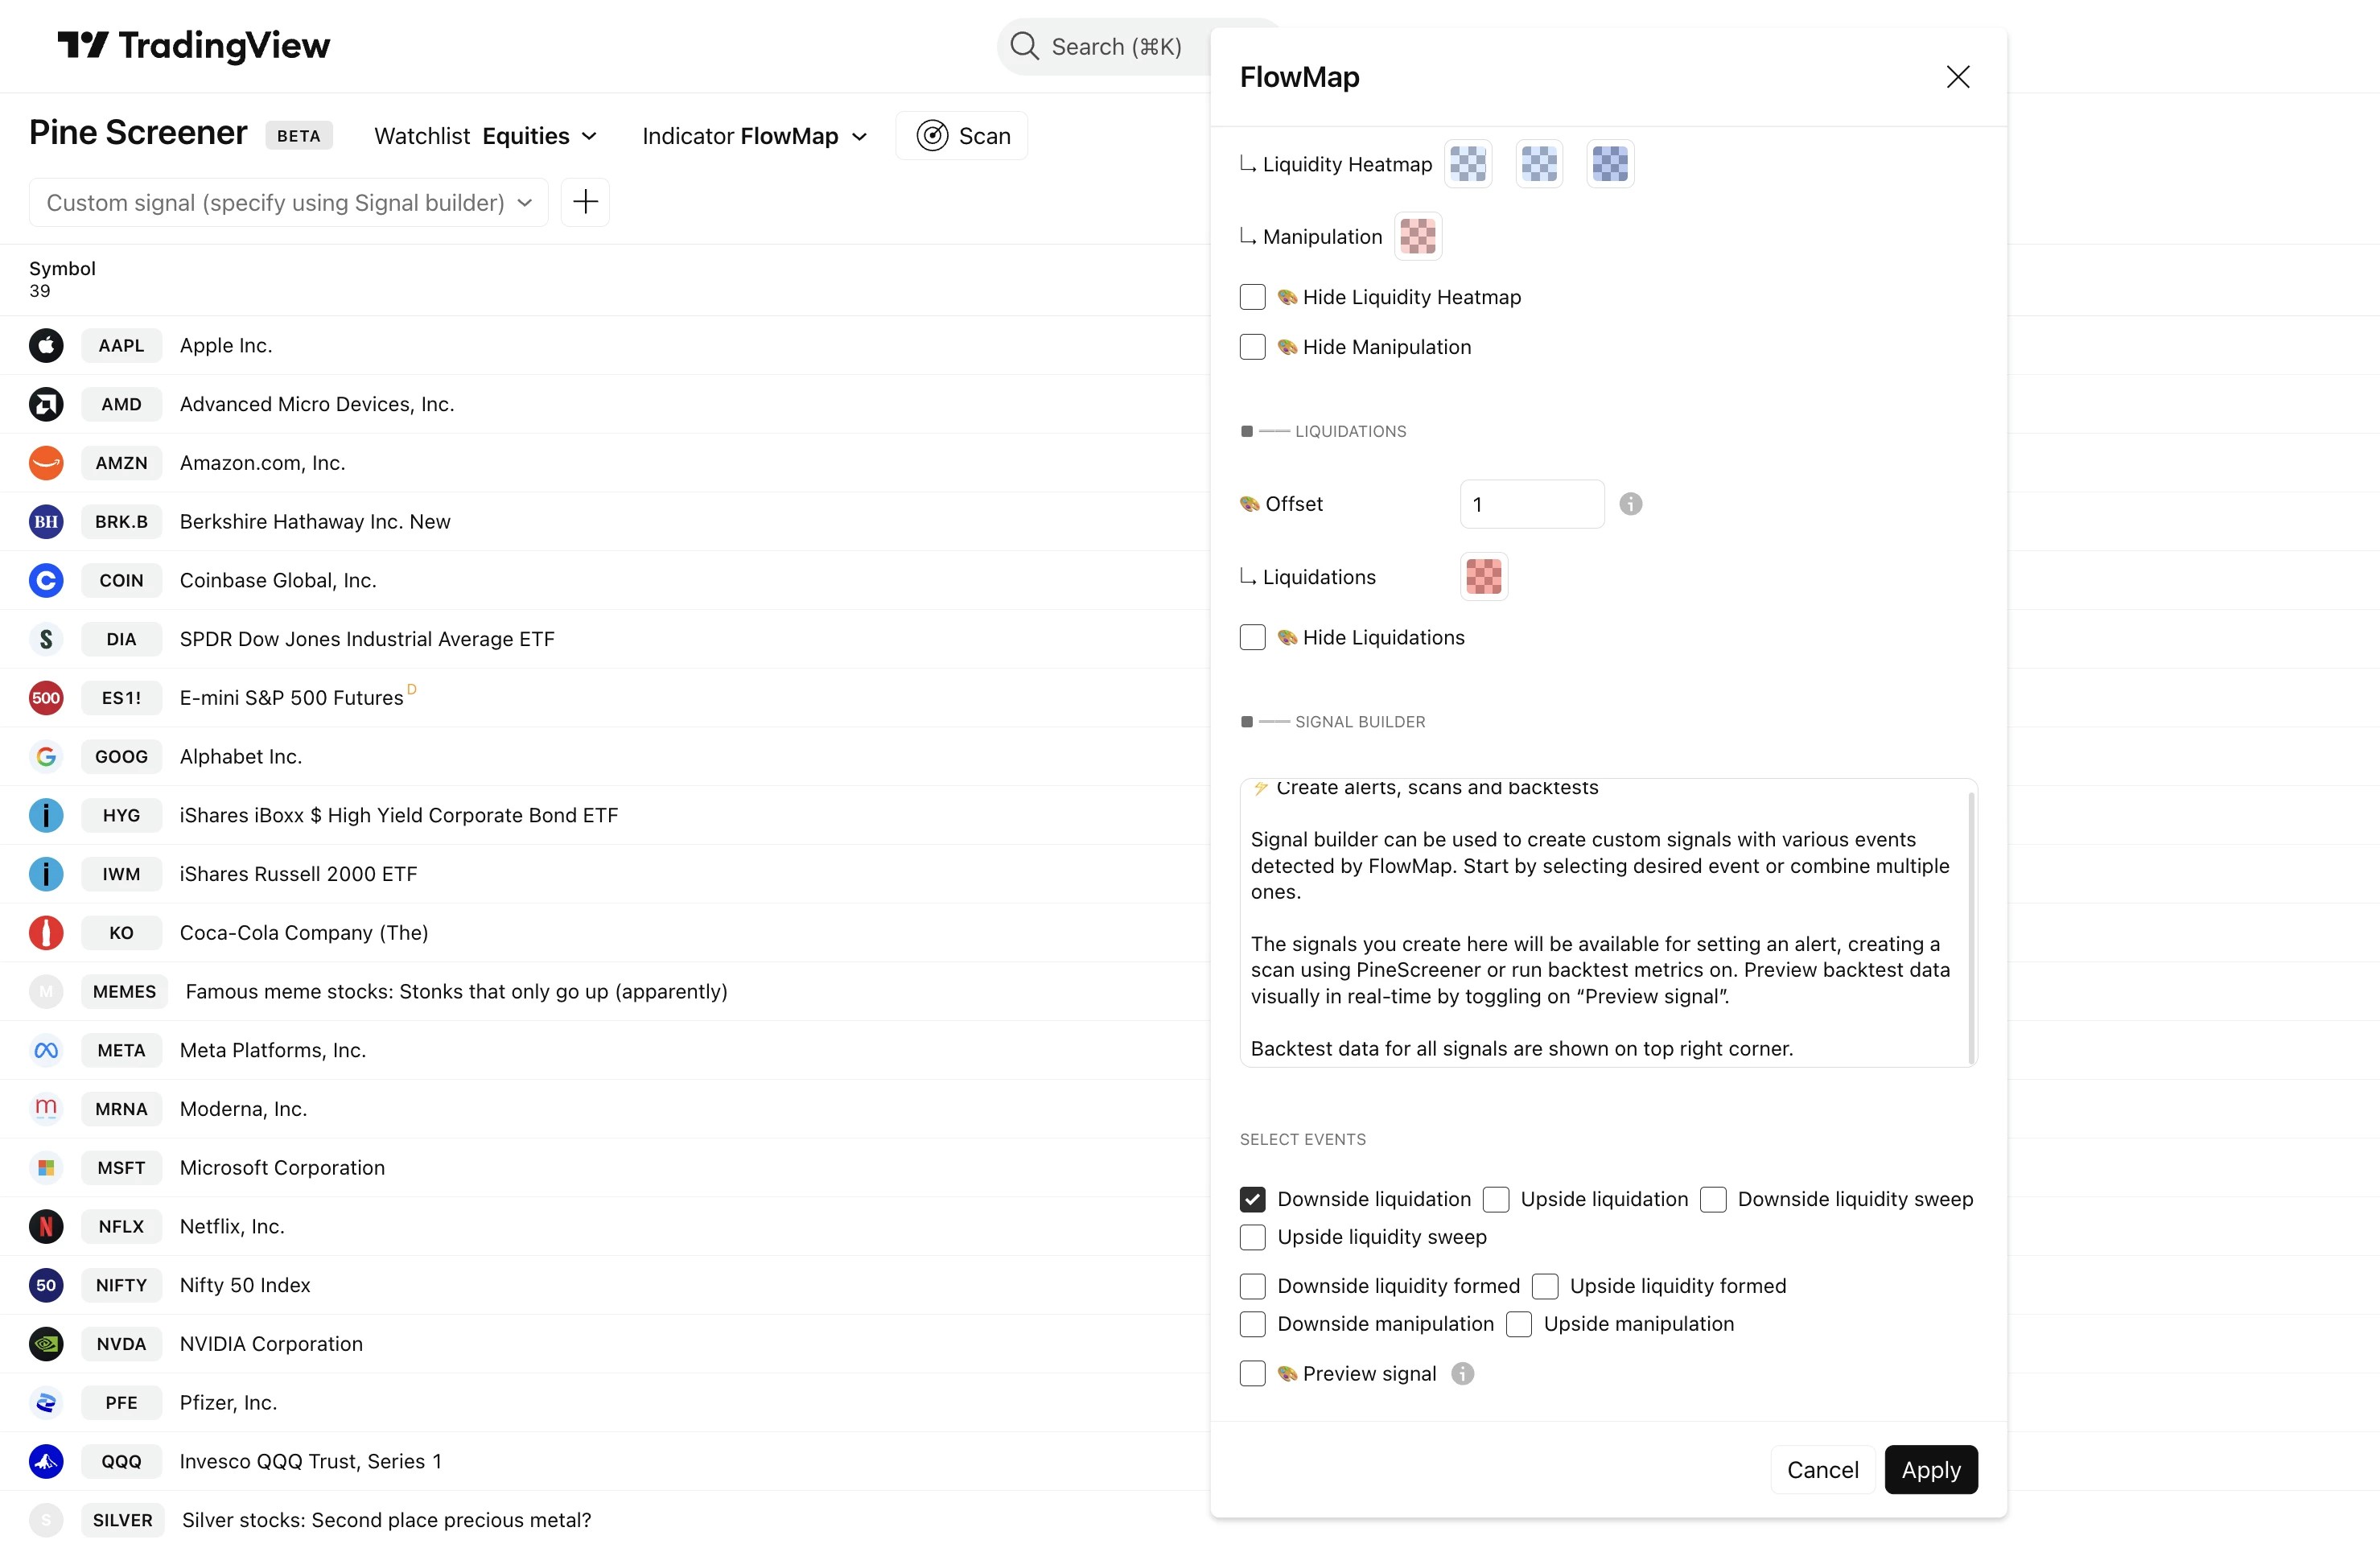
Let's build our signal. Scroll down in FlowMap's settings menu to find all available events. In this example, we're scanning for downside liquidations.
Once we have selected downside liquidation from the events, let's click "Apply" to save the changes.
Scanning the watchlist
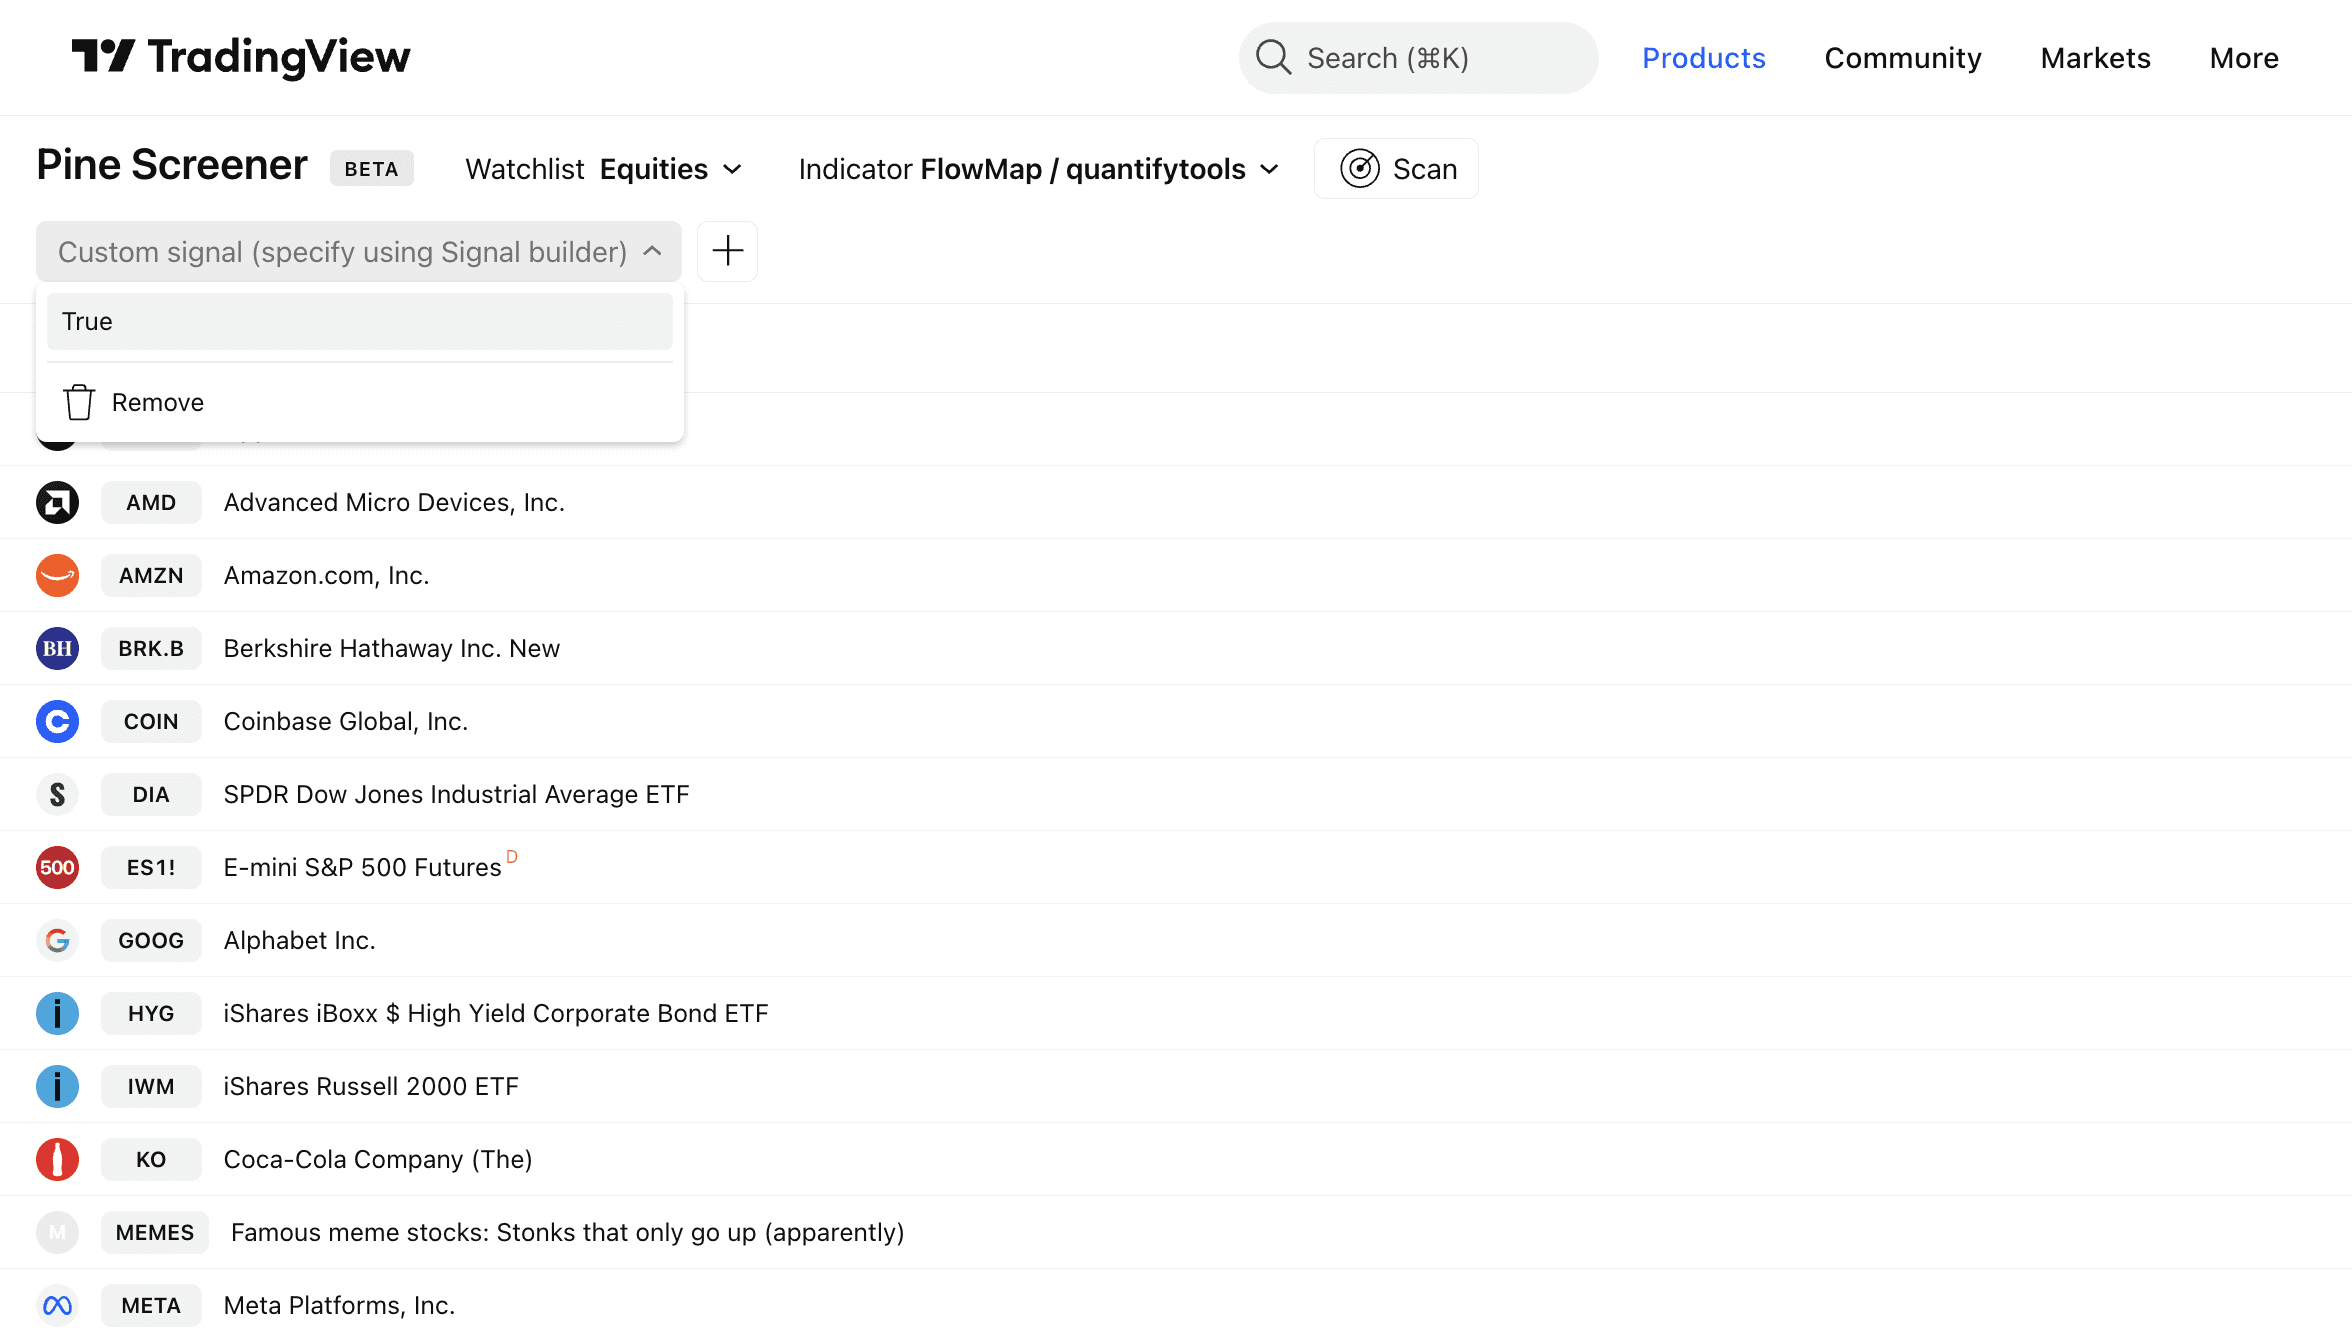
To scan the selected watchlist of charts, set “Custom signal” to “True”. Then just click “Scan”.
PineScreener will begin to look for charts where downside liquidation has recently occurred.
Reviewing the results
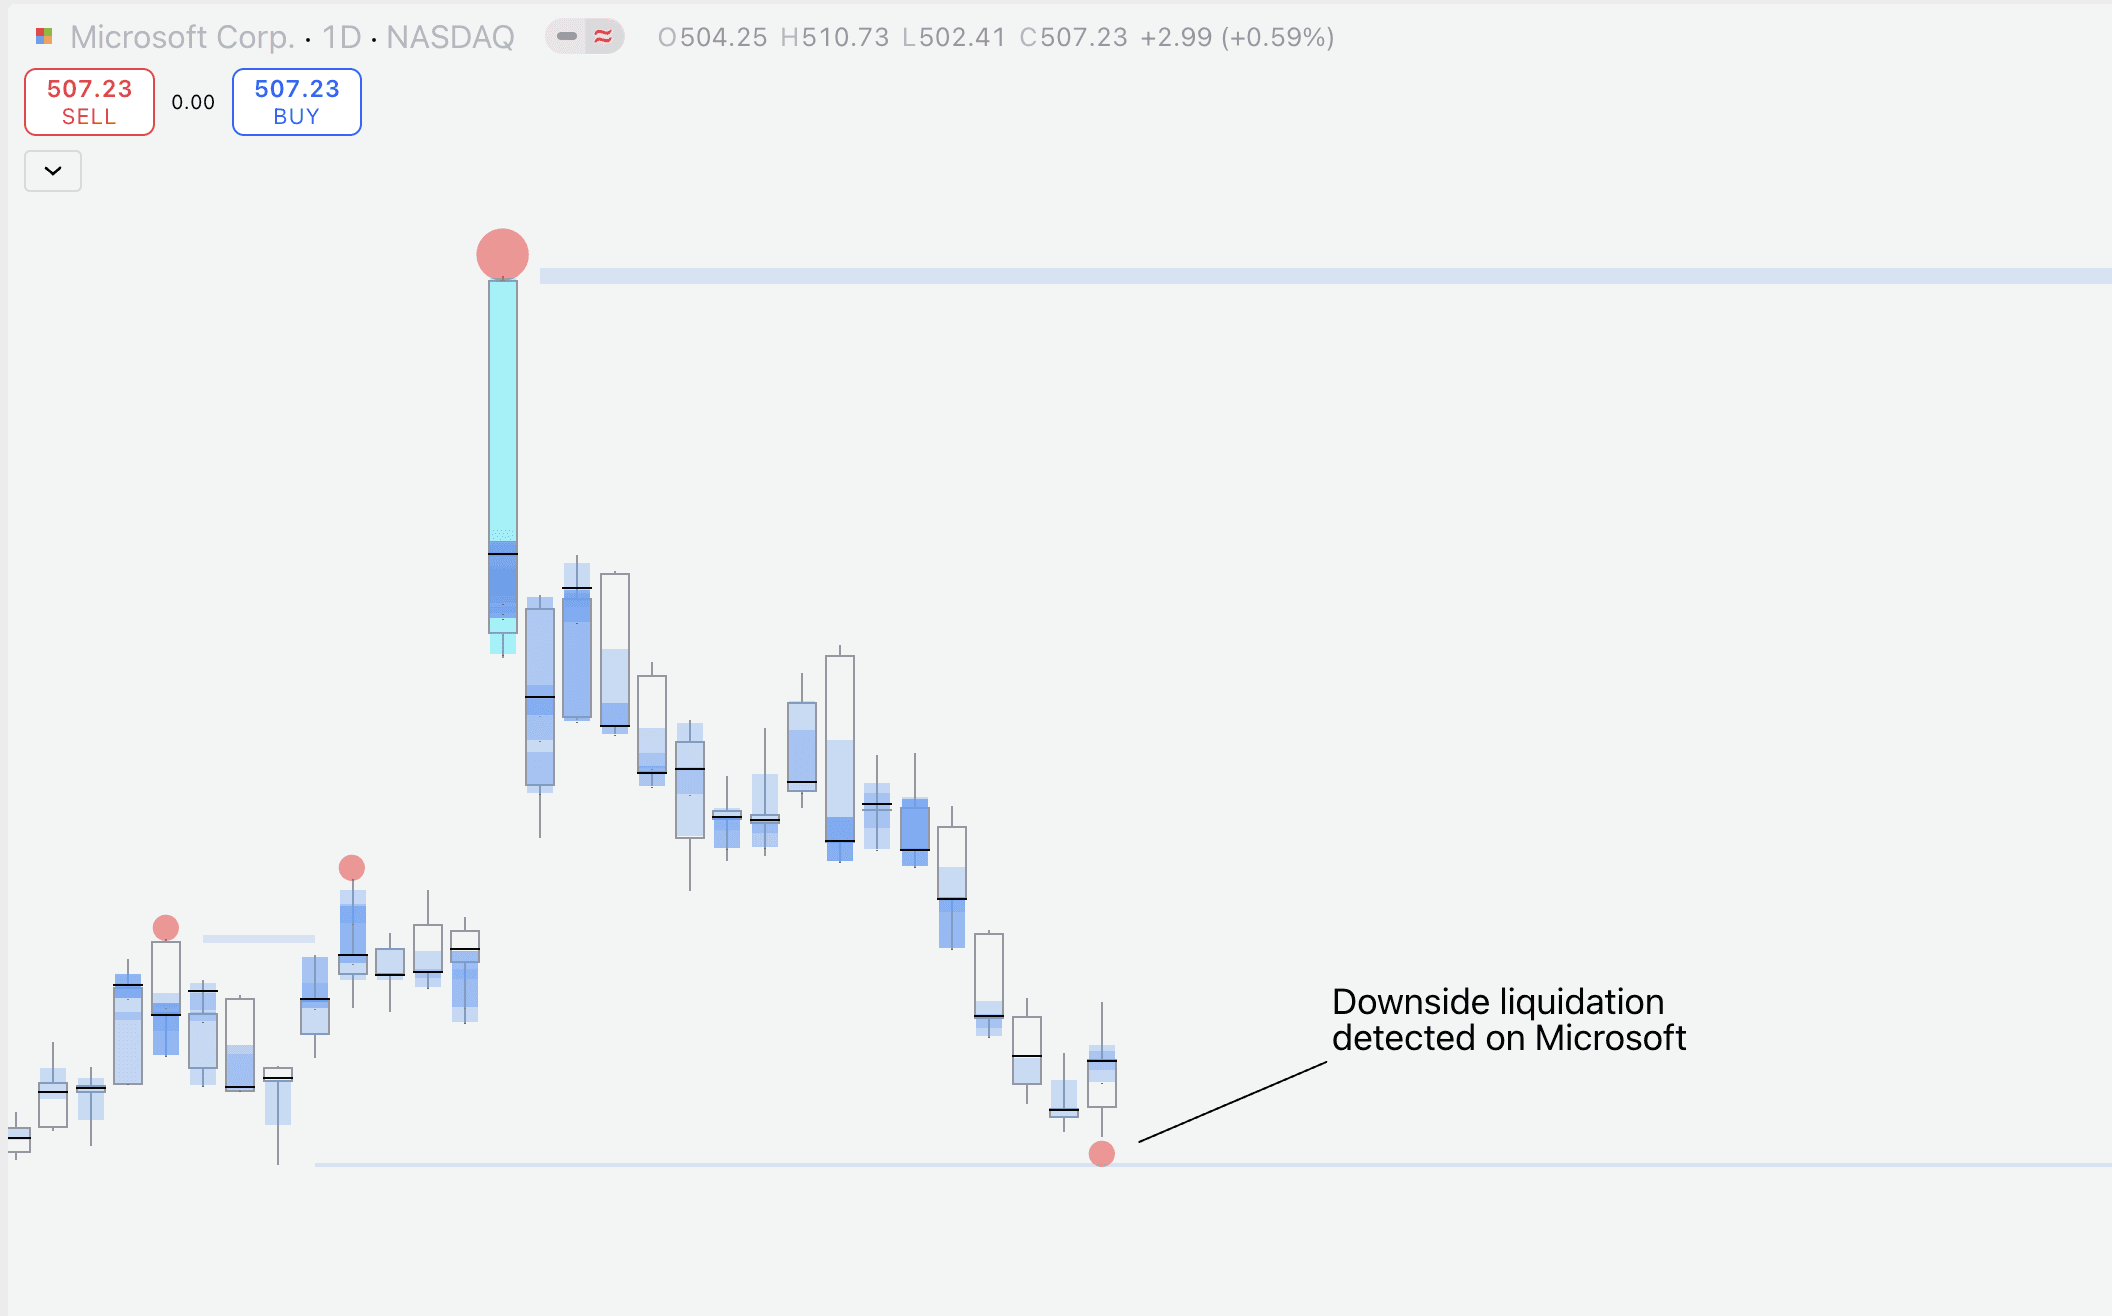
In this example, we can see that PineScreener found a downside liquidation on MSFT (Microsoft).
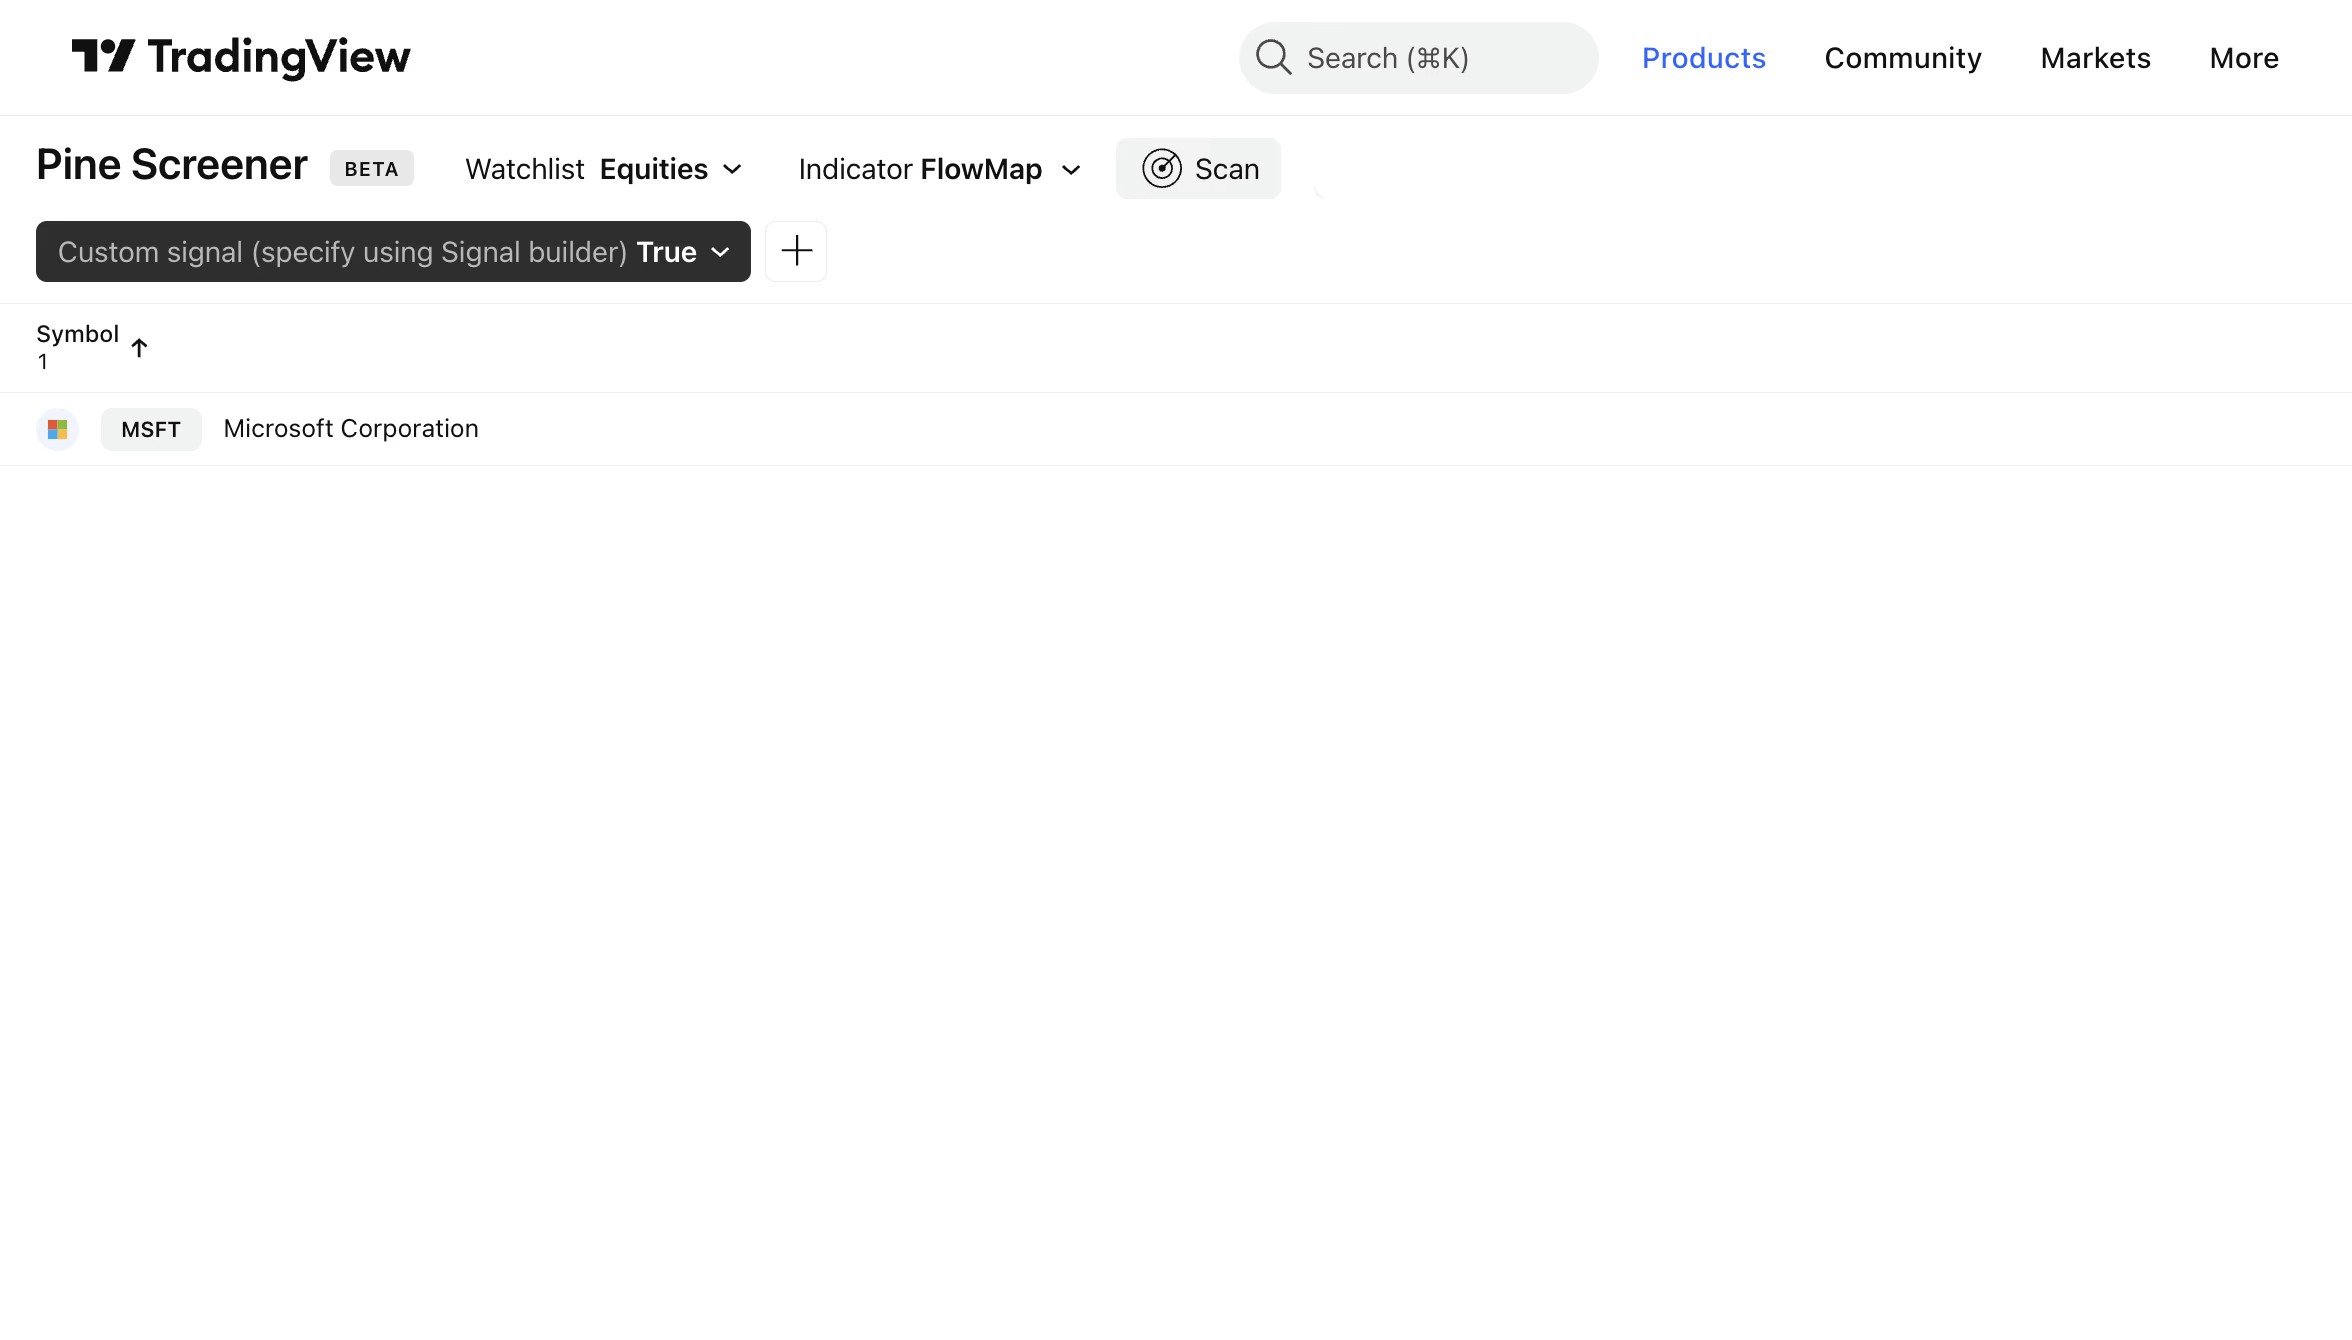
We can then hop over to TradingView and open up Microsoft's chart to confirm a downside liquidation is indeed there.
Signals can also be used to create alerts to automate finding opportunities and backtests to analyze signal performance. Read more about that here 👇
Creating a market scan with PineScreener
FlowMap let’s us build a custom signal using any single volume event available or combining multiple into one, which can be used for market scans.
Currently available events are liquidations, liquidity pool sweeps, liquidity pool detected and manipulation.
Building a signal
Let's build our signal. Scroll down in FlowMap's settings menu to find all available events. In this example, we're scanning for downside liquidations.
Once we have selected downside liquidation from the events, let's click "Apply" to save the changes.
Scanning the watchlist
To scan the selected watchlist of charts, set “Custom signal” to “True”. Then just click “Scan”.
PineScreener will begin to look for charts where downside liquidation has recently occurred.
Reviewing the results
In this example, we can see that PineScreener found a downside liquidation on MSFT (Microsoft).
We can then hop over to TradingView and open up Microsoft's chart to confirm a downside liquidation is indeed there.
Signals can also be used to create alerts to automate finding opportunities and backtests to analyze signal performance. Read more about that here 👇
Mentioned in this section
Dive deeper into topics mentioned
Mentioned in this section
Dive deeper into topics mentioned
Mentioned in this section
Dive deeper into topics mentioned


Another lesson scanned 💪
Market scans are powerful for quickly analyzing volume events on hundreds of charts at once, and now you know how to create one.
Take a look at how all the other parts of FlowMap more and how to trade orderflow using it 👇
Another lesson scanned 💪
Market scans are powerful for quickly analyzing volume events on hundreds of charts at once, and now you know how to create one.
Take a look at how all the other parts of FlowMap more and how to trade orderflow using it 👇


