

Backtesting in FlowMap
FlowMap let’s us build a custom signal using any single volume event available or combining multiple into one.
Currently available events are liquidations, liquidity pool sweeps, liquidity pool detected and manipulation.
Visualize backtest results
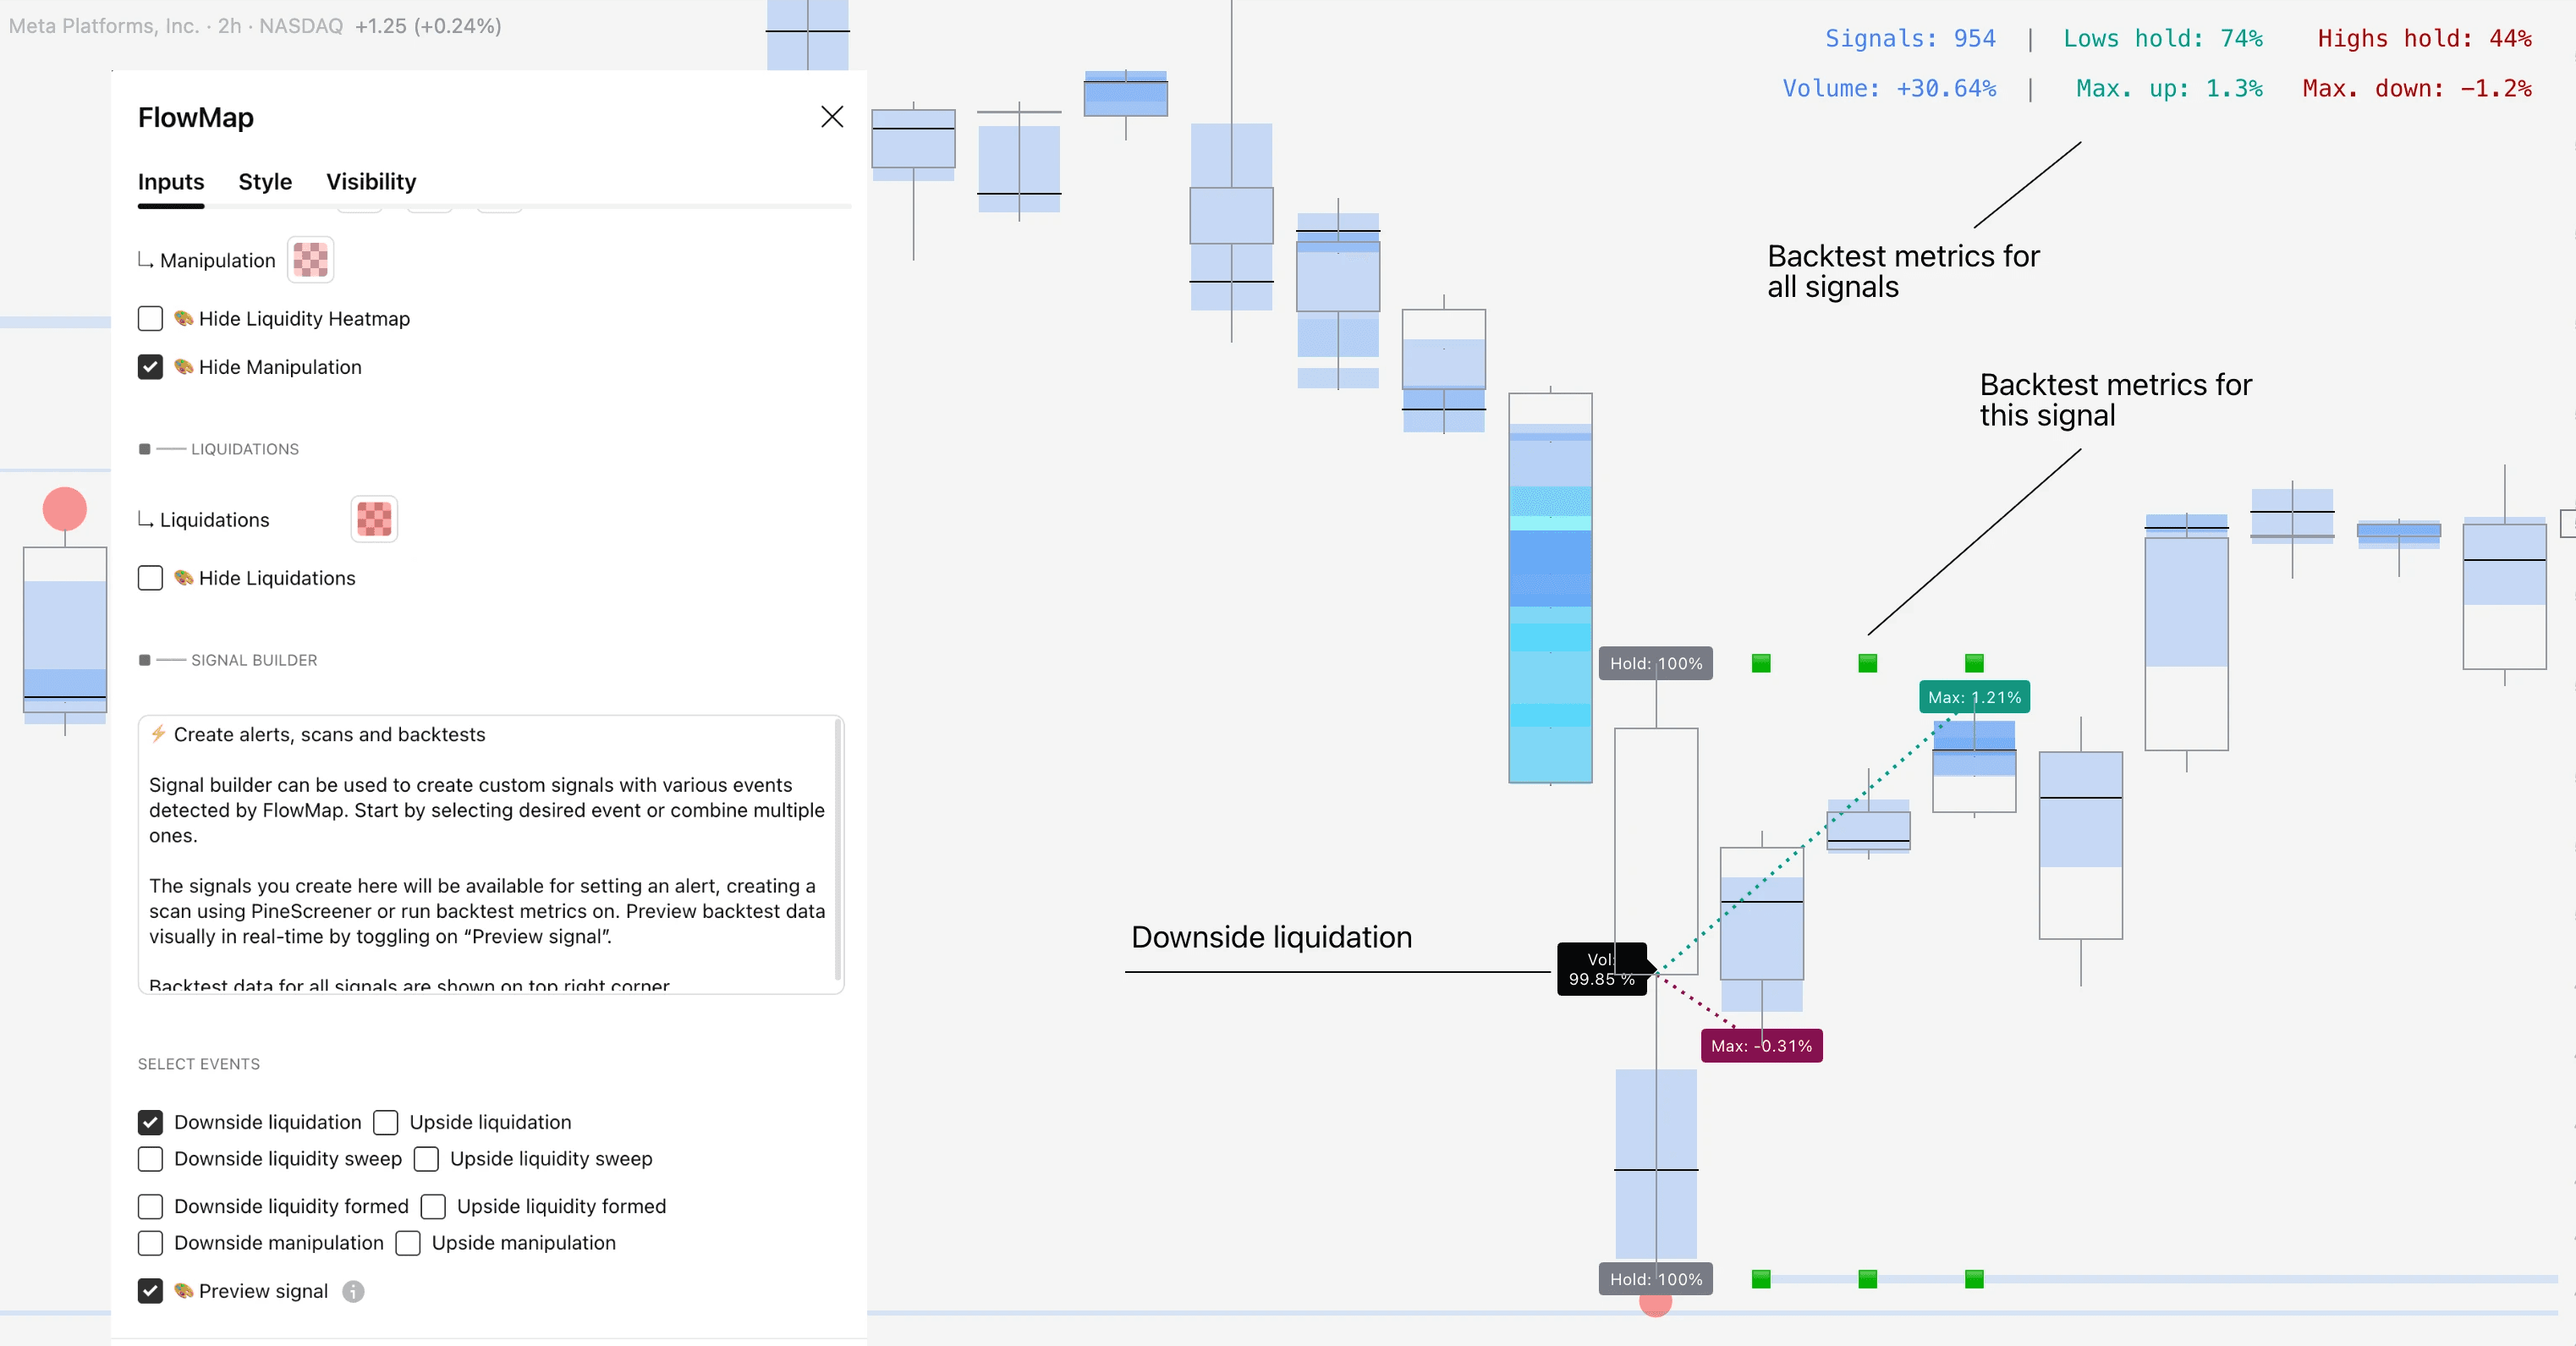
We can visually preview the backtest calculations for each signal by selecting “Preview signal”. In this example we are previewing a downside liquidation
In preview mode, FlowMap will show the backtest results for each signal one by one in real-time as well as the average backtest results across all signals, found on top right table.
Signals can also be used to create market scans and alerts to automate opportunity finding. More on that here 👇
Backtesting in FlowMap
FlowMap let’s us build a custom signal using any single volume event available or combining multiple into one.
Currently available events are liquidations, liquidity pool sweeps, liquidity pool detected and manipulation.
Visualize backtest results
We can visually preview the backtest calculations for each signal by selecting “Preview signal”. In this example we are previewing a downside liquidation
In preview mode, FlowMap will show the backtest results for each signal one by one in real-time as well as the average backtest results across all signals, found on top right table.
Signals can also be used to create market scans and alerts to automate opportunity finding. More on that here 👇
Mentioned in this section
Dive deeper into topics mentioned
Mentioned in this section
Dive deeper into topics mentioned
Mentioned in this section
Dive deeper into topics mentioned


How to read the backtest results
FlowMap shows four different data points regarding the signals: signal amount, volume test, highs/lows hold test and max. up/down test.
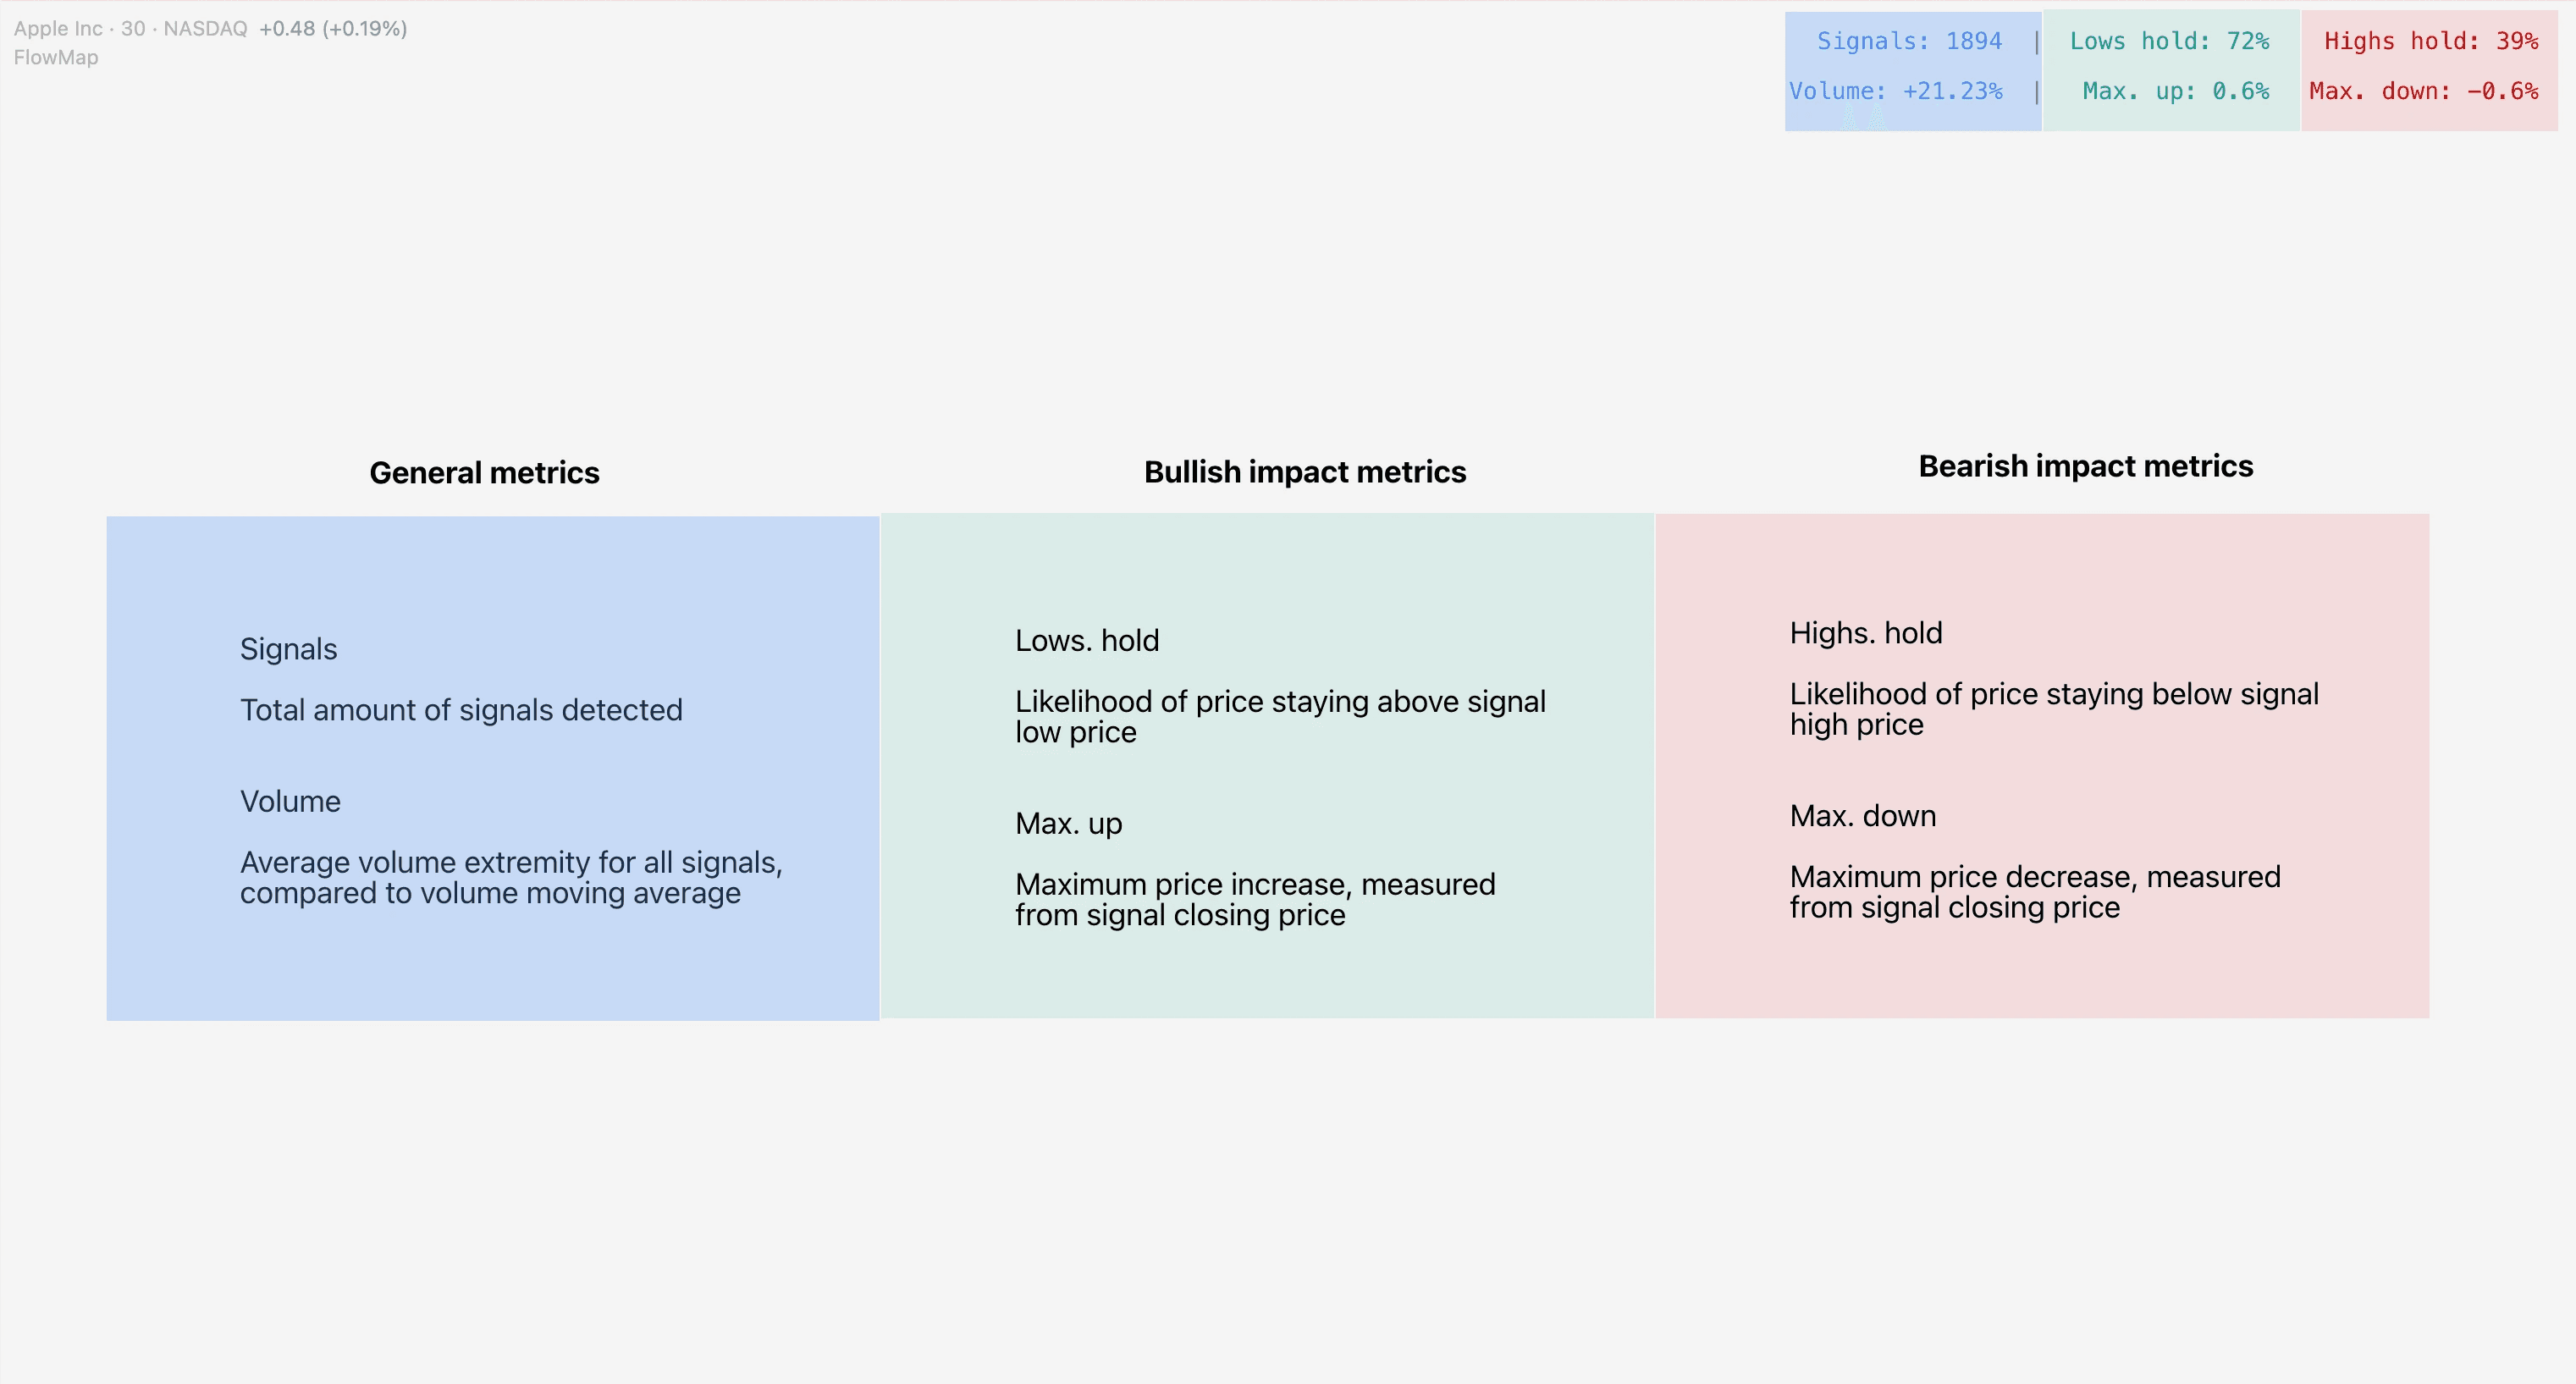
Volume test
Volume test tells us how much volume traded at signal is above/below average volume, a concept known as relative volume.
This test tells us how much higher or lower volume at signal is compared to a historical average of past 20 candles.
The idea and purpose of this test is to get insights into liquidity depth and resistance typically found on signals.
Let’s review an example where volume test is 30%.
Result | Interpretation |
|---|---|
Volume test is +30%. This means volume is typically 30% higher than average when signal is confirmed. | Since volume traded at signal is typically 30% higher than average, we can conclude that volume is typically unusually high at signal. We can expect liquidity depth and resistance at the signal to also be 30% higher than normal. |
Highs/lows hold test
Highs/ lows hold test measures likelihood of price staying below high and above low of the candle where signal was detected. This test asks the question “is price likely to put in a short term bottom or top?”.
Highs/lows hold test is measured for 3 candles after signal confirmation.
Let’s review an example where highs hold test is 66% and lows hold test is 30%.
Result | Interpretation |
|---|---|
Highs hold test is 66%. Price stays 66% of the time below signal high price. Lows hold test is 30%. Price stays 30% of the time above signal low price. | This is a clear indication there is much greater likelihood for a short term top in price, but not really a bottom. Price doesn't breach signal high 66% of the time. Lows on the other hand doesn’t hold often, only 30% of the time. |
Maximum run test
Max. up/down test measures maximum price increase to the upside and maximum decrease to the downside from signal closing price.
This test gives an idea for typical magnitude of the price moves that follow a signal, tested for 3 candles after a signal.
Let’s review an example where maximum upside is +2% and maximum downside is -2.5%.
Result | Interpretation |
|---|---|
Max. upside is +2%. Price increases 2% from signal closing price on average. Max. downside is -2.5%. Price decreases 2.5% from signal closing price on average. | This indicates there is a larger downside potential for the signal, as downside is larger than upside on average. Read this metric with highs/lows hold test to get a comprehensive idea of whether upside/downside is more likely. |
How to read the backtest results
FlowMap shows four different data points regarding the signals: signal amount, volume test, highs/lows hold test and max. up/down test.
Volume test
Volume test tells us how much volume traded at signal is above/below average volume, a concept known as relative volume.
This test tells us how much higher or lower volume at signal is compared to a historical average of past 20 candles.
The idea and purpose of this test is to get insights into liquidity depth and resistance typically found on signals.
Let’s review an example where volume test is 30%.
Result | Interpretation |
|---|---|
Volume test is +30%. This means volume is typically 30% higher than average when signal is confirmed. | Since volume traded at signal is typically 30% higher than average, we can conclude that volume is typically unusually high at signal. We can expect liquidity depth and resistance at the signal to also be 30% higher than normal. |
Highs/lows hold test
Highs/ lows hold test measures likelihood of price staying below high and above low of the candle where signal was detected. This test asks the question “is price likely to put in a short term bottom or top?”.
Highs/lows hold test is measured for 3 candles after signal confirmation.
Let’s review an example where highs hold test is 66% and lows hold test is 30%.
Result | Interpretation |
|---|---|
Highs hold test is 66%. Price stays 66% of the time below signal high price. Lows hold test is 30%. Price stays 30% of the time above signal low price. | This is a clear indication there is much greater likelihood for a short term top in price, but not really a bottom. Price doesn't breach signal high 66% of the time. Lows on the other hand doesn’t hold often, only 30% of the time. |
Maximum run test
Max. up/down test measures maximum price increase to the upside and maximum decrease to the downside from signal closing price.
This test gives an idea for typical magnitude of the price moves that follow a signal, tested for 3 candles after a signal.
Let’s review an example where maximum upside is +2% and maximum downside is -2.5%.
Result | Interpretation |
|---|---|
Max. upside is +2%. Price increases 2% from signal closing price on average. Max. downside is -2.5%. Price decreases 2.5% from signal closing price on average. | This indicates there is a larger downside potential for the signal, as downside is larger than upside on average. Read this metric with highs/lows hold test to get a comprehensive idea of whether upside/downside is more likely. |
Evidence based decisions
Backtesting is a great way to rule out the possibility of signals not working and getting an idea what makes sense to expect as shown by data.
Users should note the results are guidelines and historical performance does not guarantee future results.
The backtesting results on FlowMap only measure short term price and volume impact. Some signals might have a delayed effect which the backtesting results do not take into account.
The signals do not also take into account varying performance on favorable vs. unfavorable market conditions.
For example, a liquidation into a parabolic move is more likely to result in a reversal than liquidation in a ranging market, as price is already exhausted by the parabolic move itself.
Still, backtesting is a very valuable piece of evidence to take into consideration in analysis and trade idea validation.
Back to testing your FlowMap knowledge 💪
Now you know how backtesting works in FlowMap. It's a very valuable tool for cutting out beliefs by following what the data indicates.
Combine it with sharp analysis and you'll up your game in markets in no time.
Take a look at all the other FlowMap lessons to learn how all the other parts move under the hood and how to trade orderflow with it 👇


