
Find SubFlow Terminal on TradingView
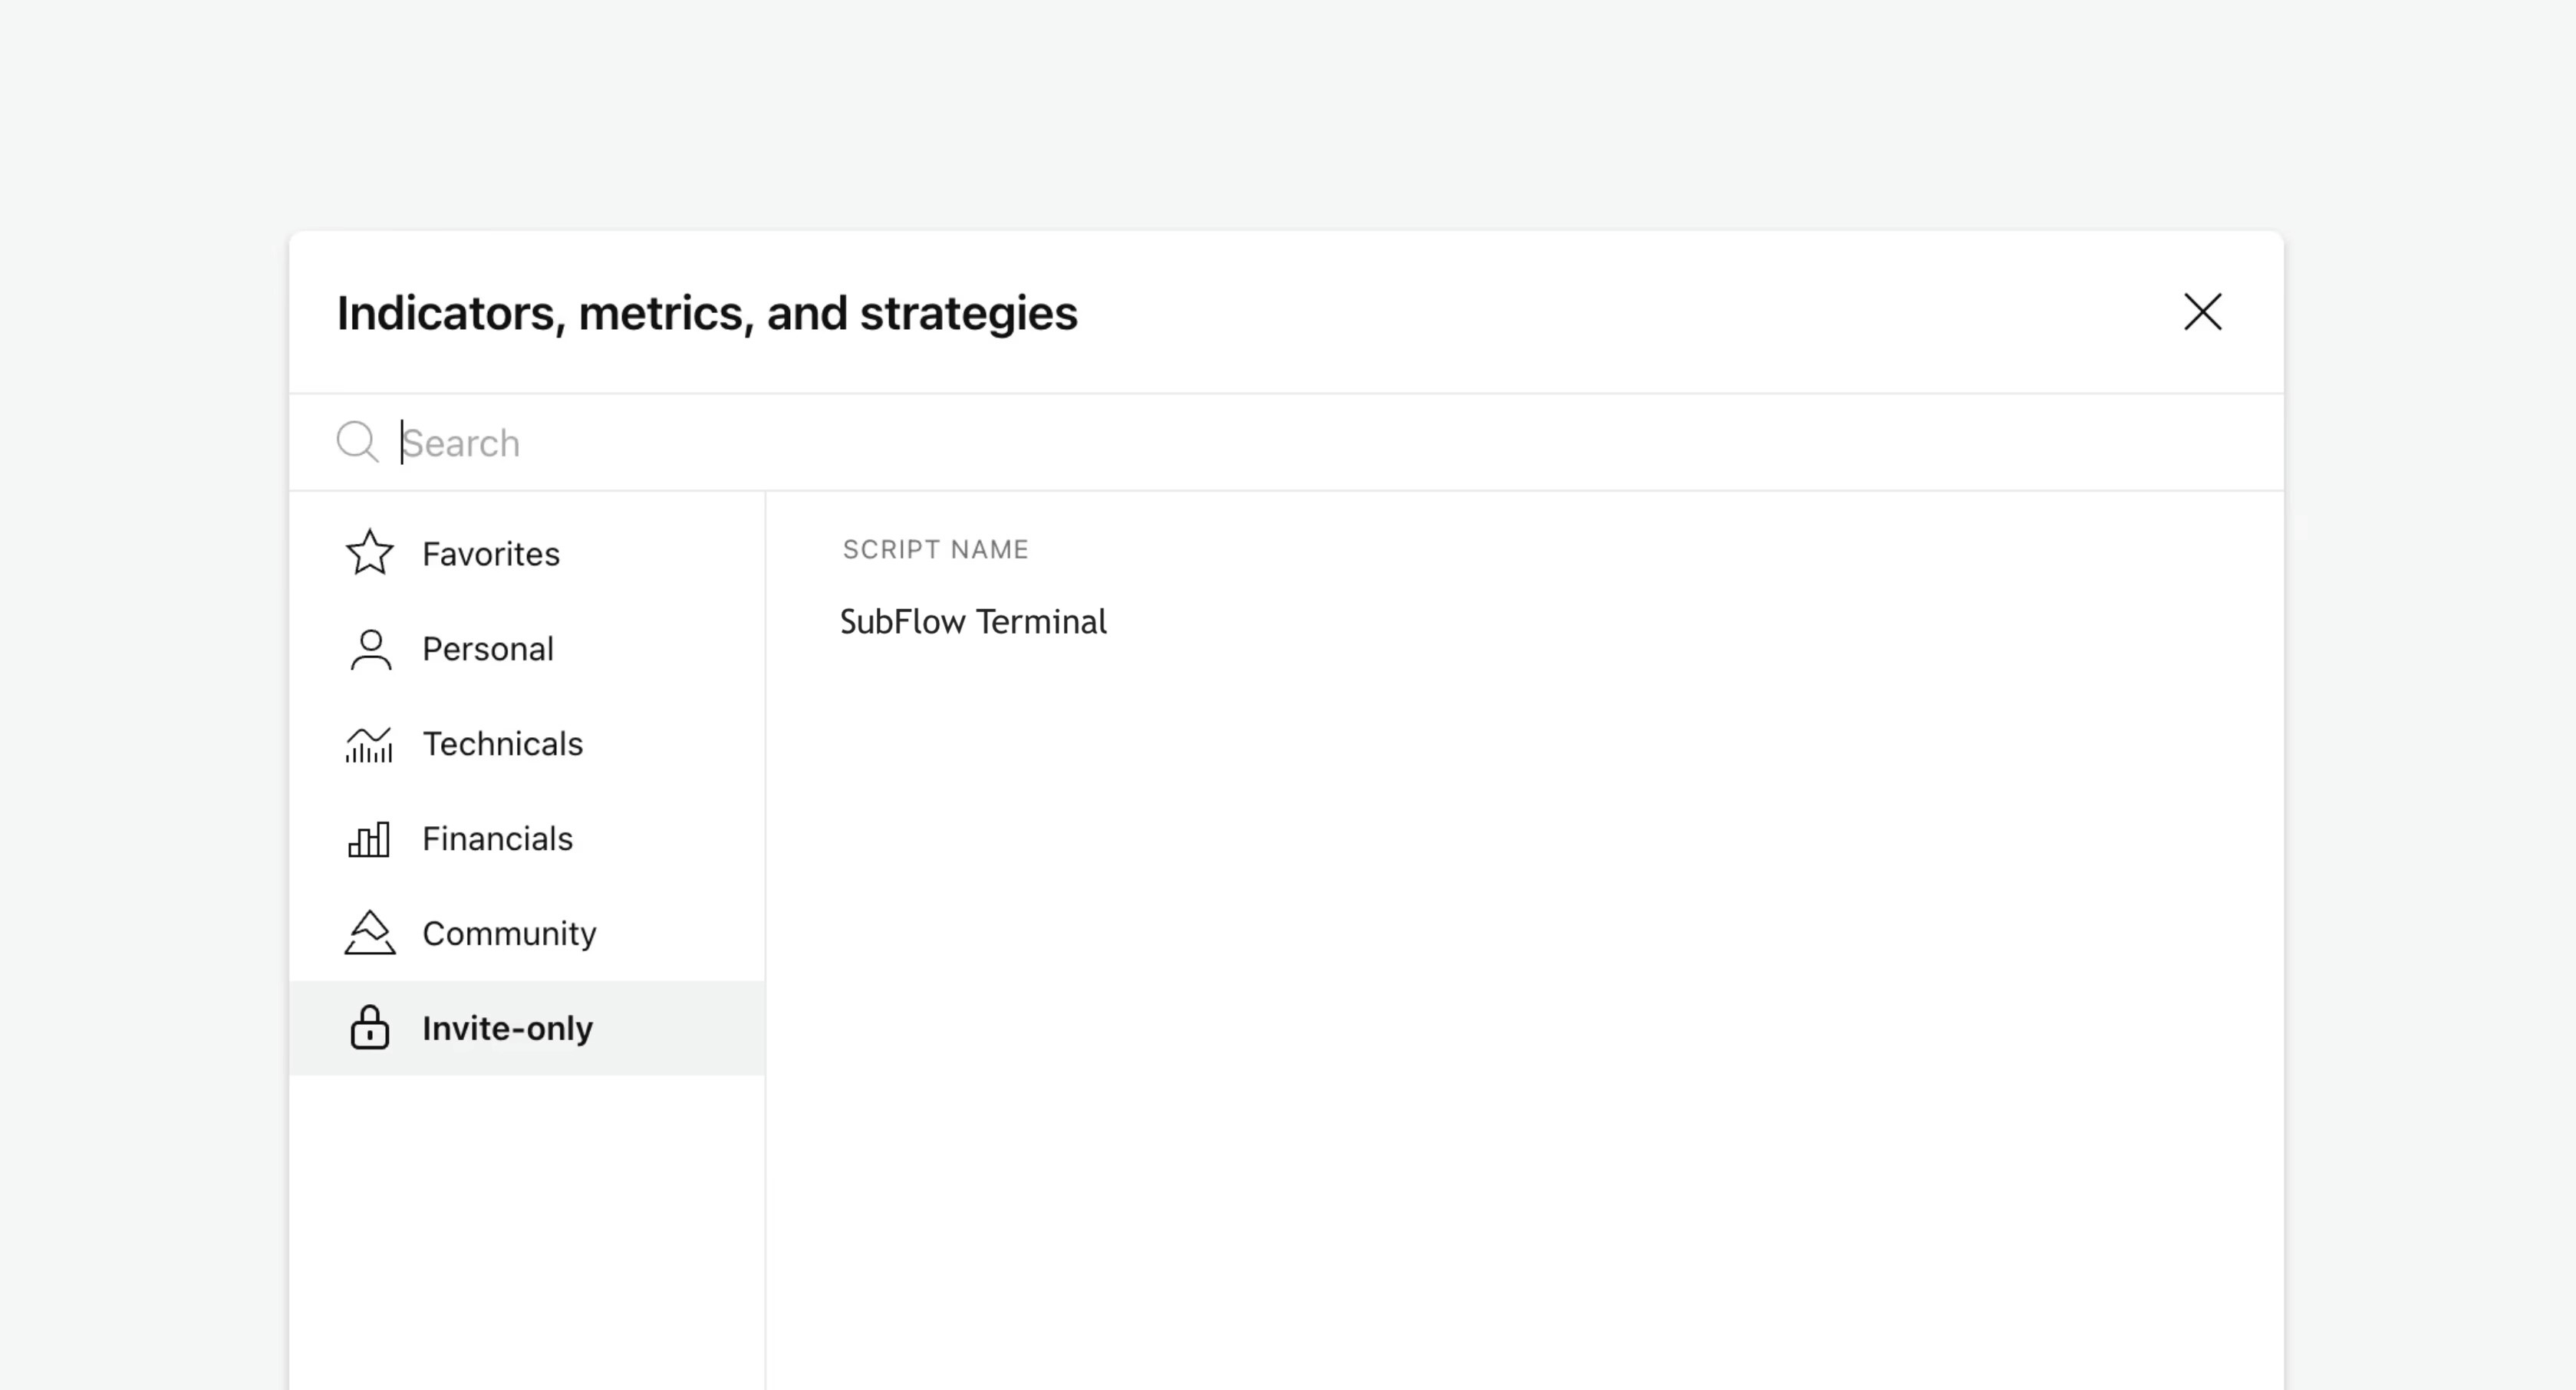
SubFlow Terminal can be found in "Invite-only scripts" under Indicators tab on TradingView.
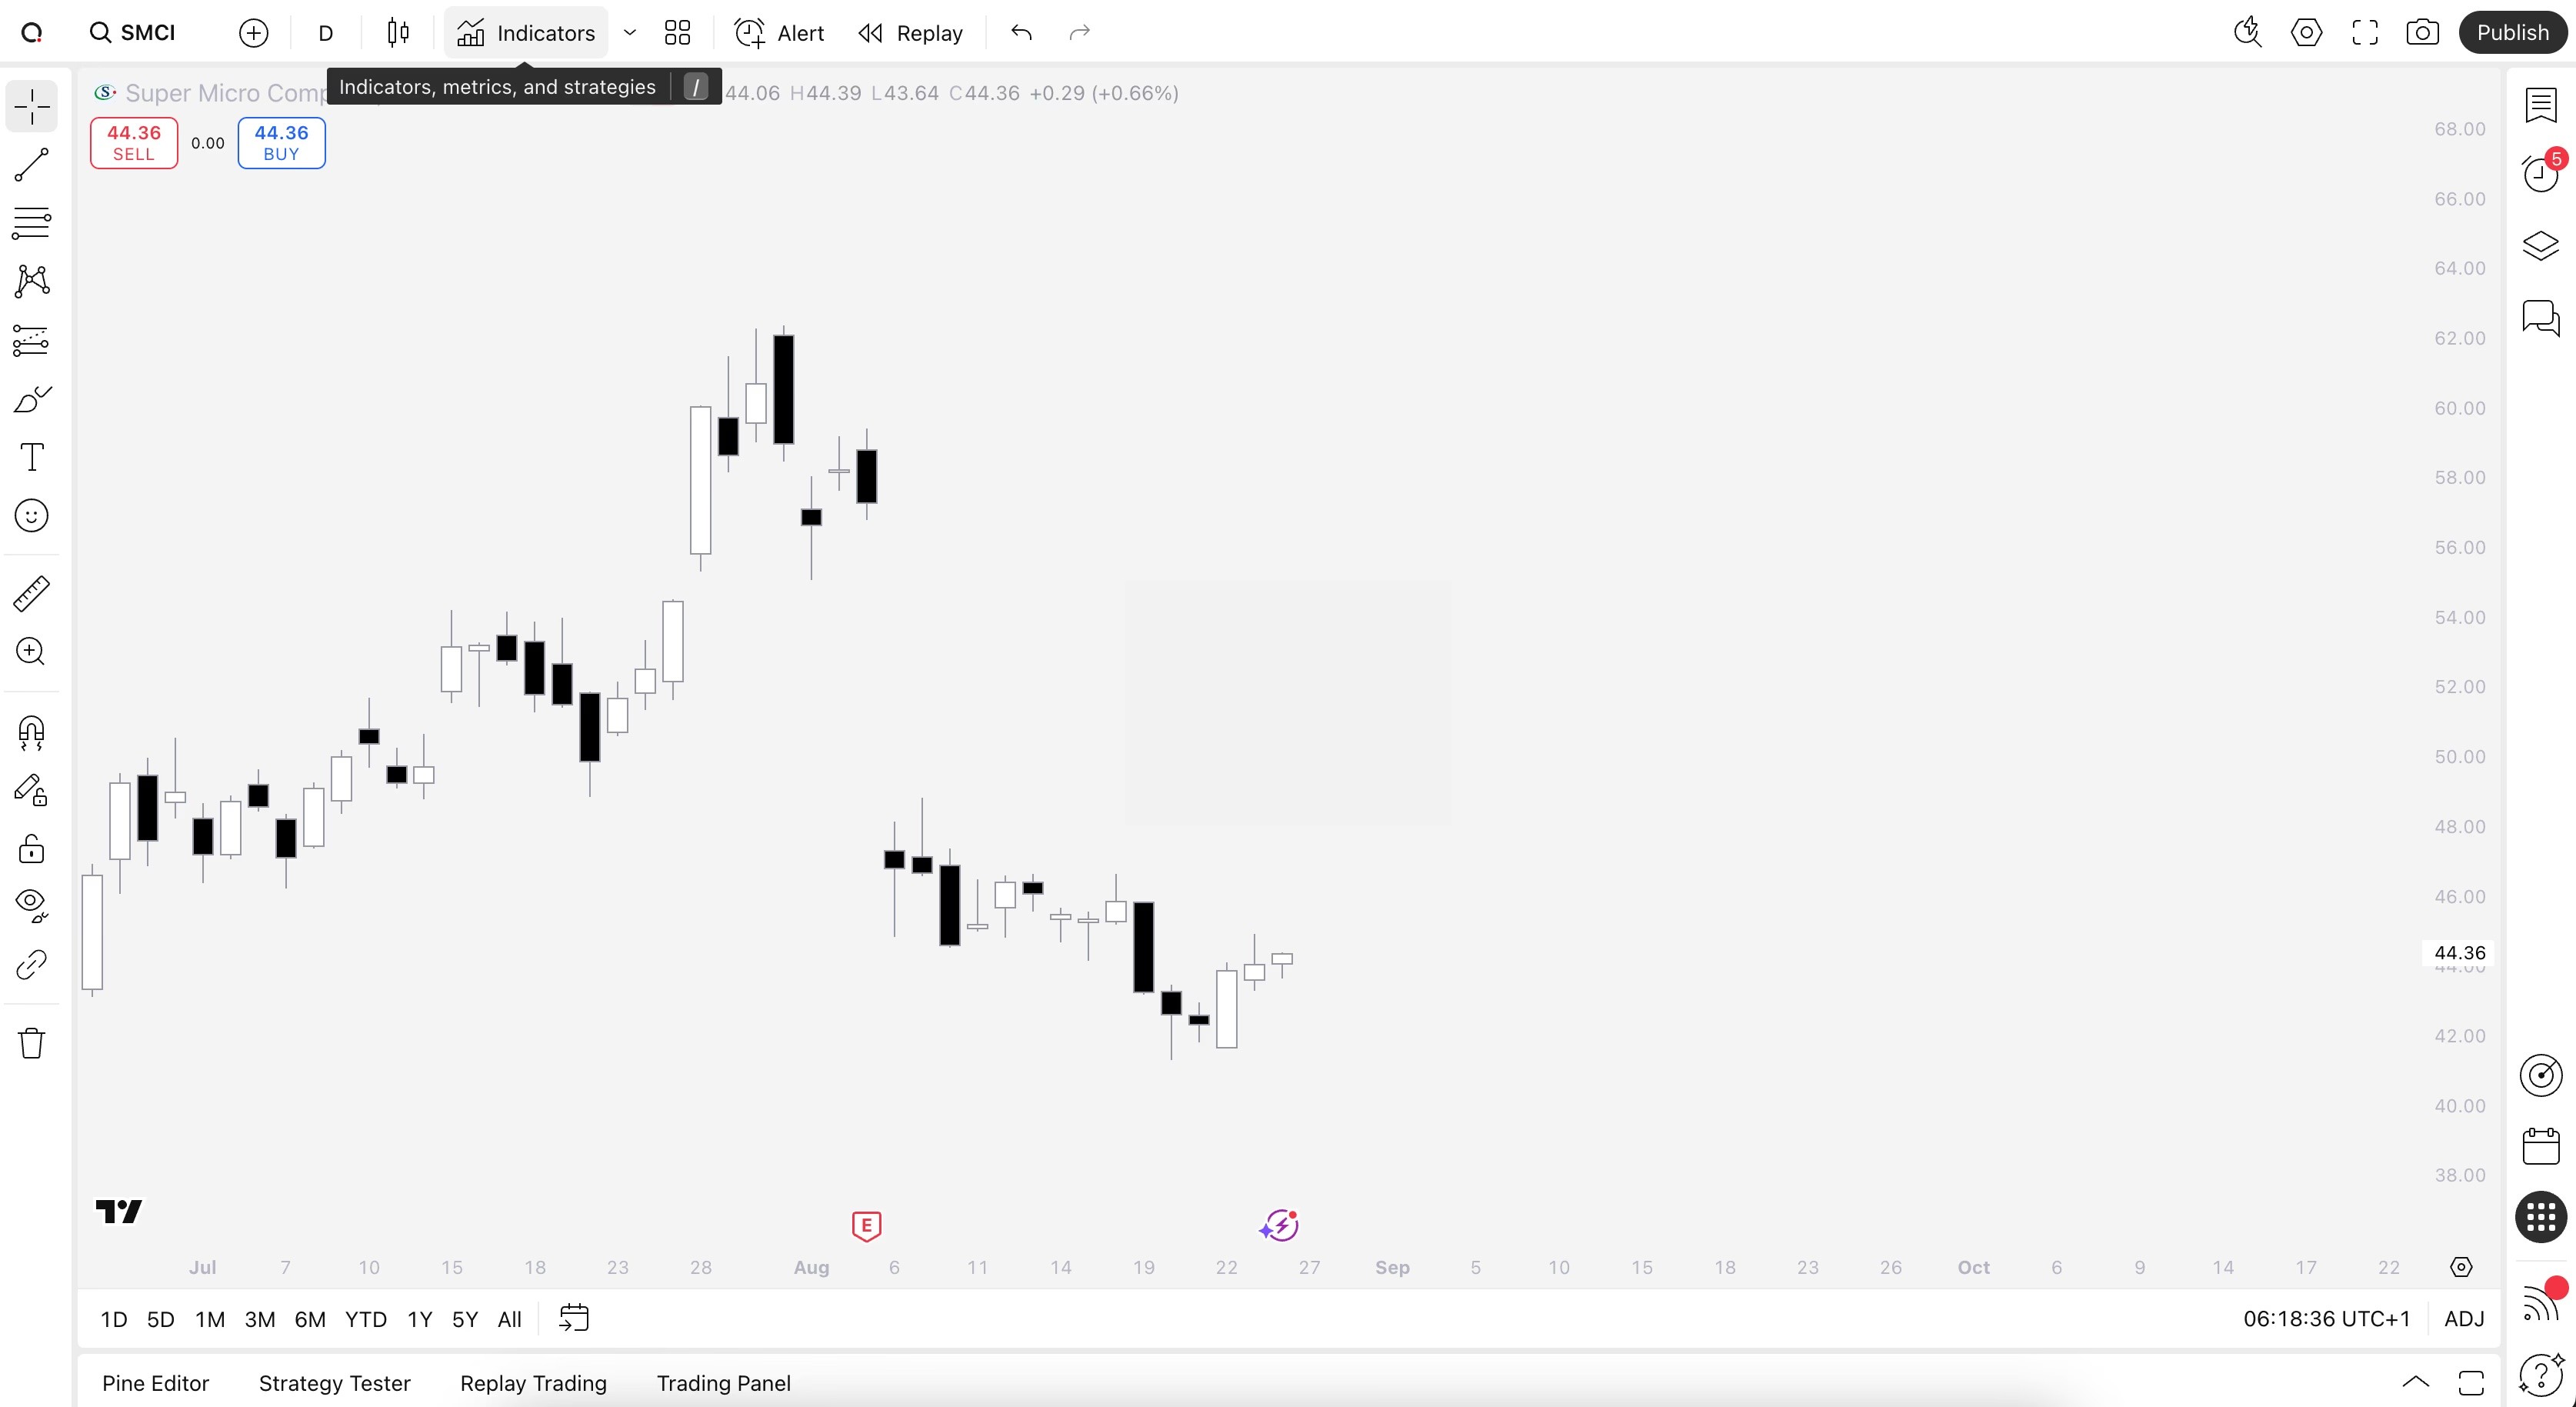
Start by opening any chart on TradingView and clicking "Indicators" on top menu.
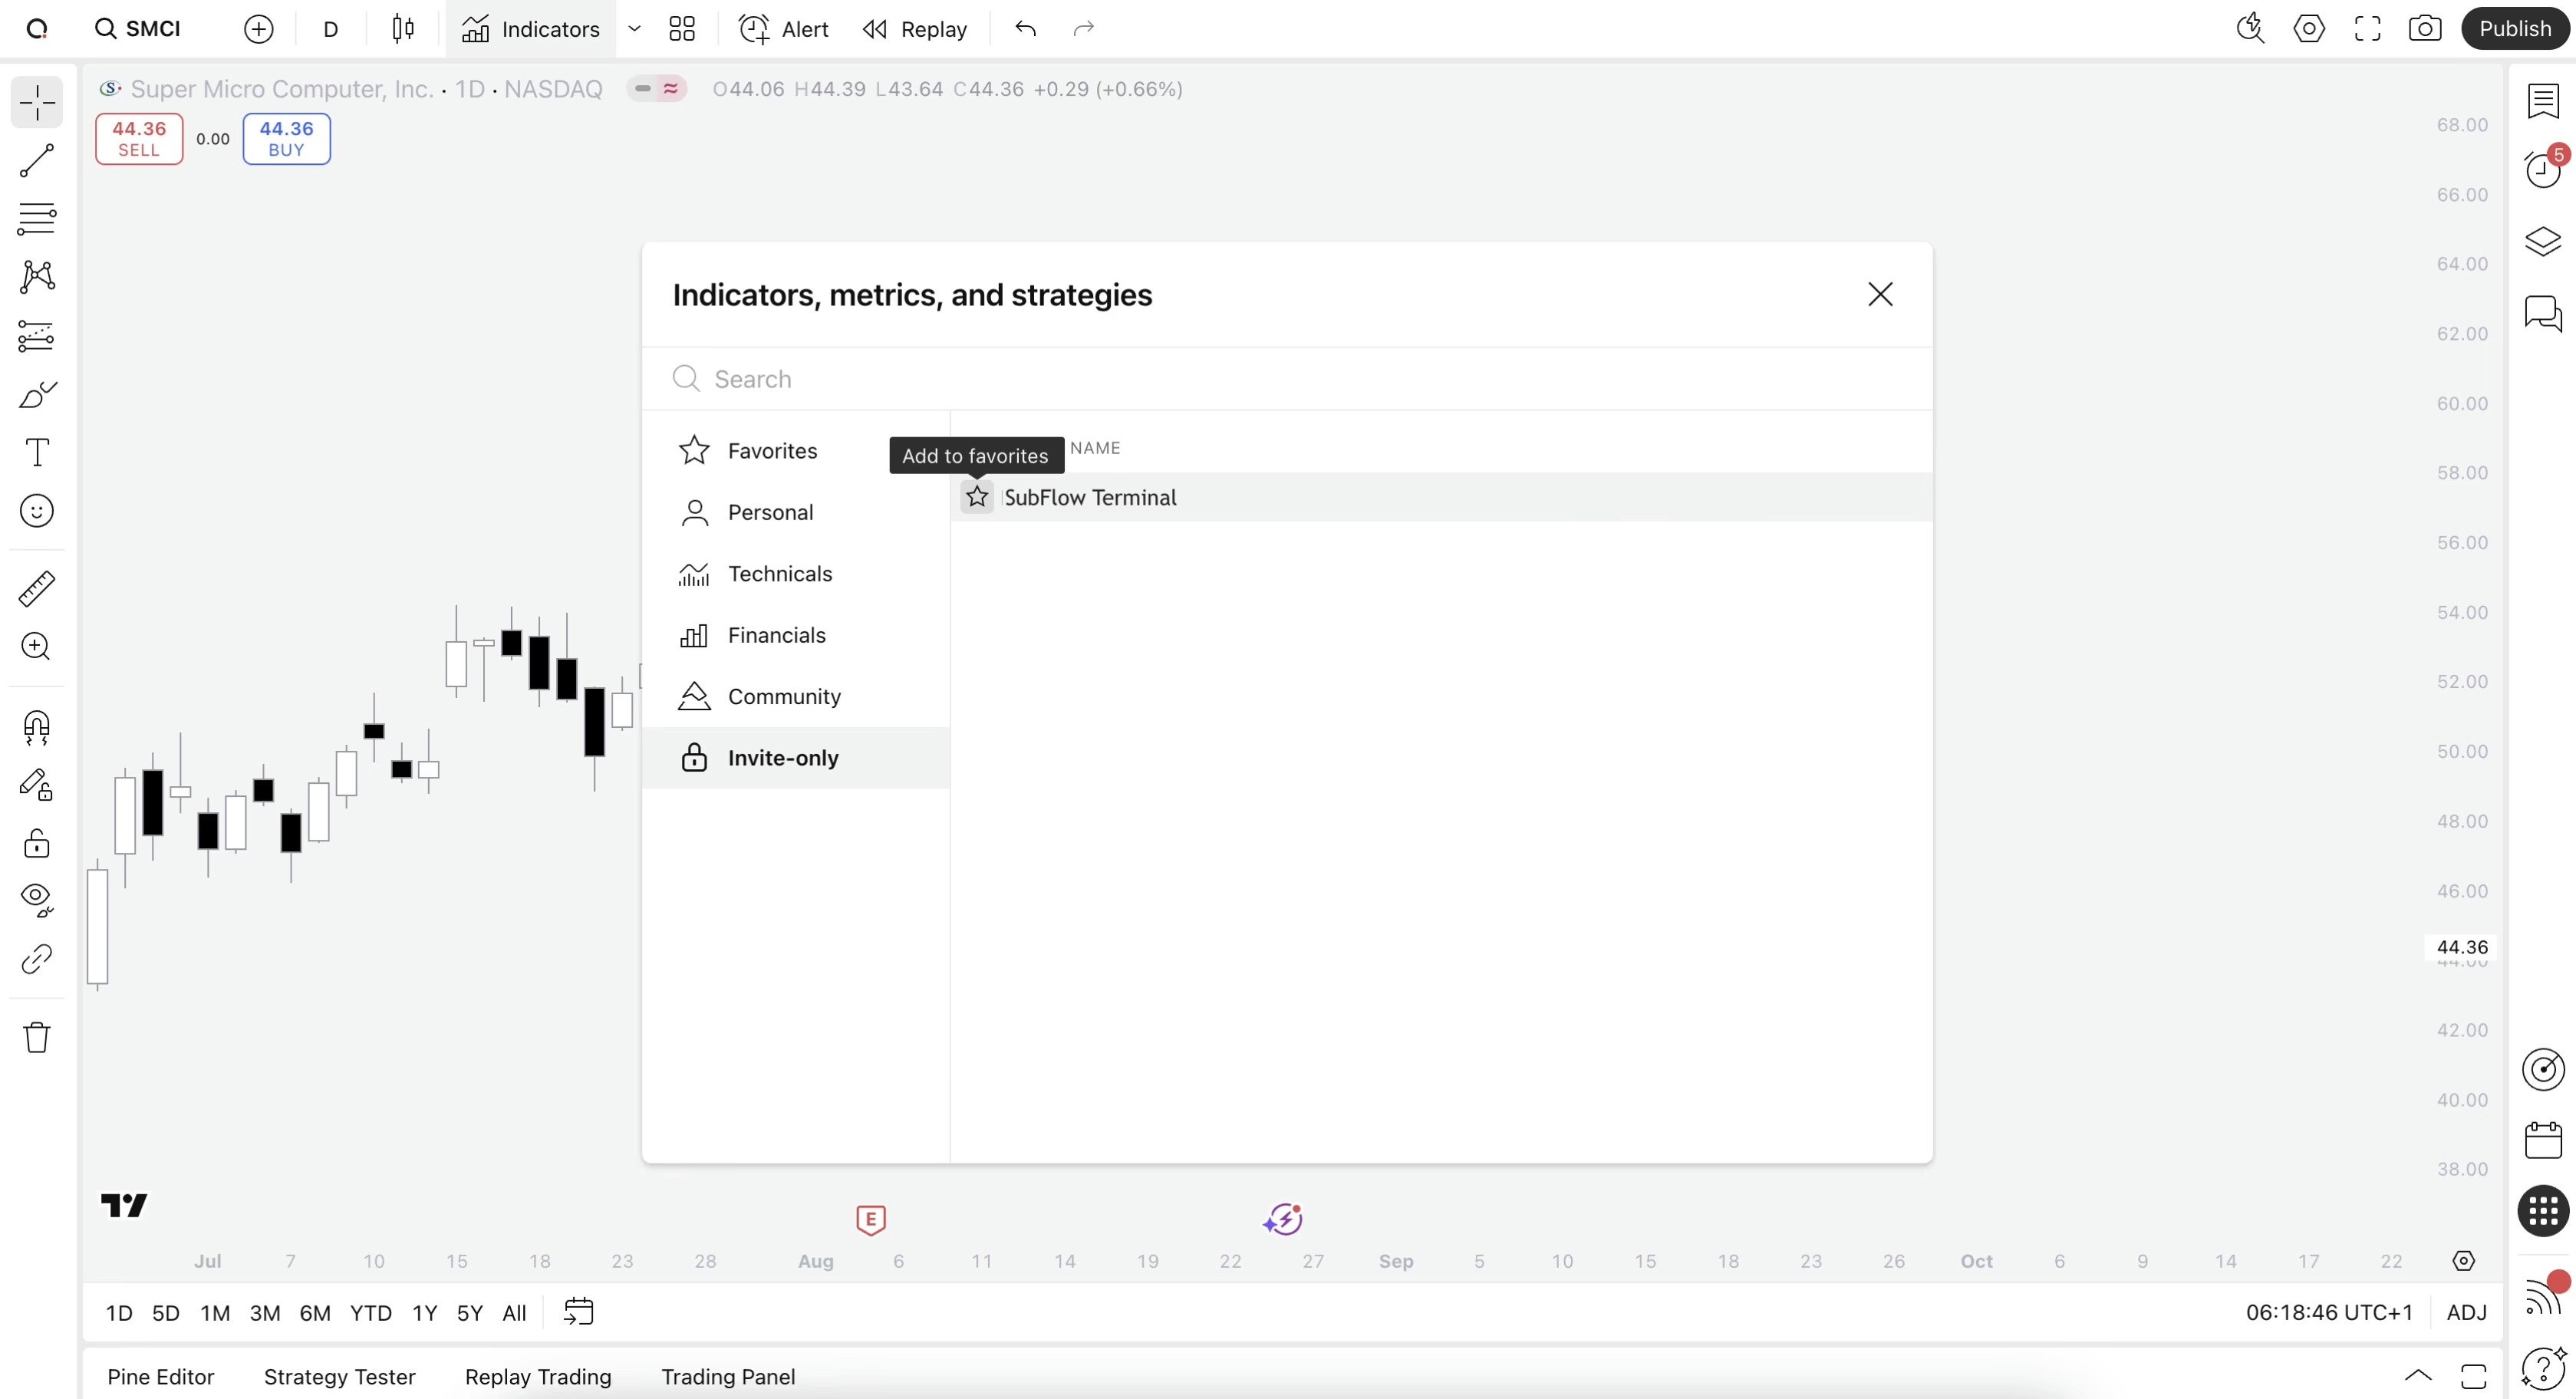
With Indicators tab open, head to Invite-only tab where you will find SubFlow Terminal. Add SubFlow Terminal to your chart by simply clicking on it.
Make sure to also click the star icon next to SubFlow Terminal to favorite it and get notified on new updates
Find SubFlow Terminal on TradingView
SubFlow Terminal can be found in "Invite-only scripts" under Indicators tab on TradingView.
Start by opening any chart on TradingView and clicking "Indicators" on top menu.
With Indicators tab open, head to Invite-only tab where you will find SubFlow Terminal. Add SubFlow Terminal to your chart by simply clicking on it.
Make sure to also click the star icon next to SubFlow Terminal to favorite it and get notified on new updates
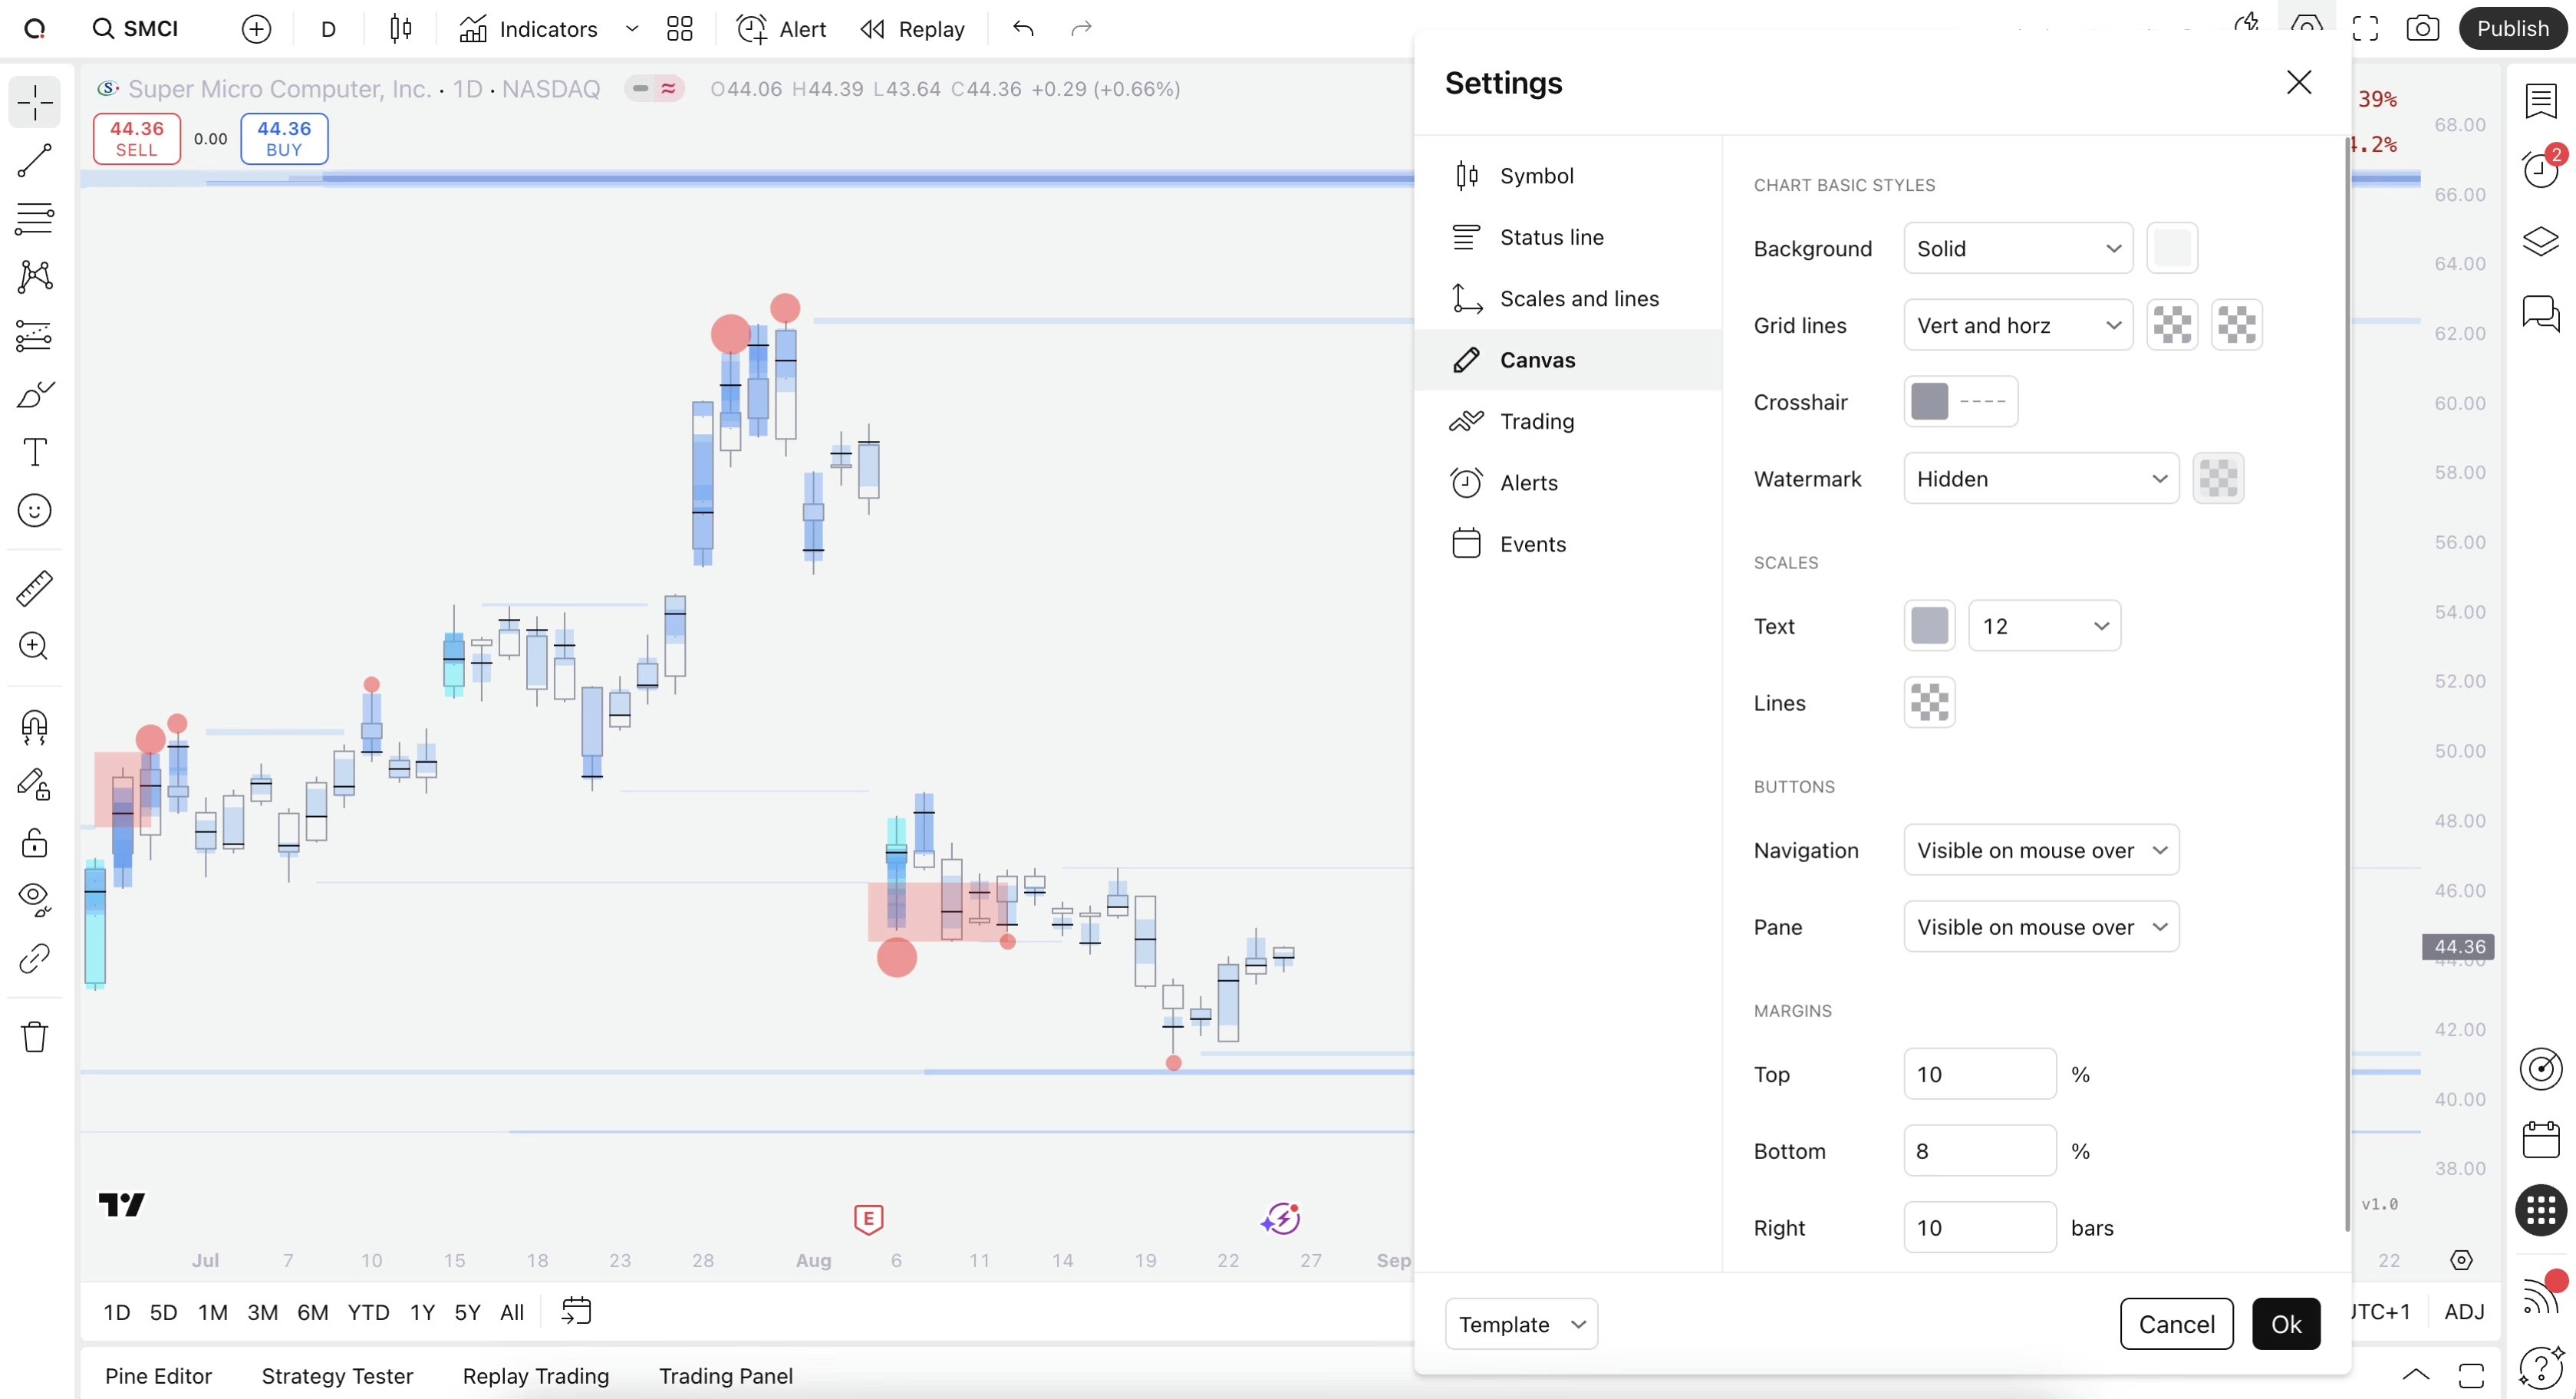
Style chart for SubFlow Terminal
While all colors on SubFlow Terminal are fully customizable, the default visuals stick out best against white backgrounds. Feel free to copy our template for a similar look.
Chart settings can be found by right clicking anywhere on the chart and selecting "Settings".
Candle borders and wick |
|---|
#9598a1 |
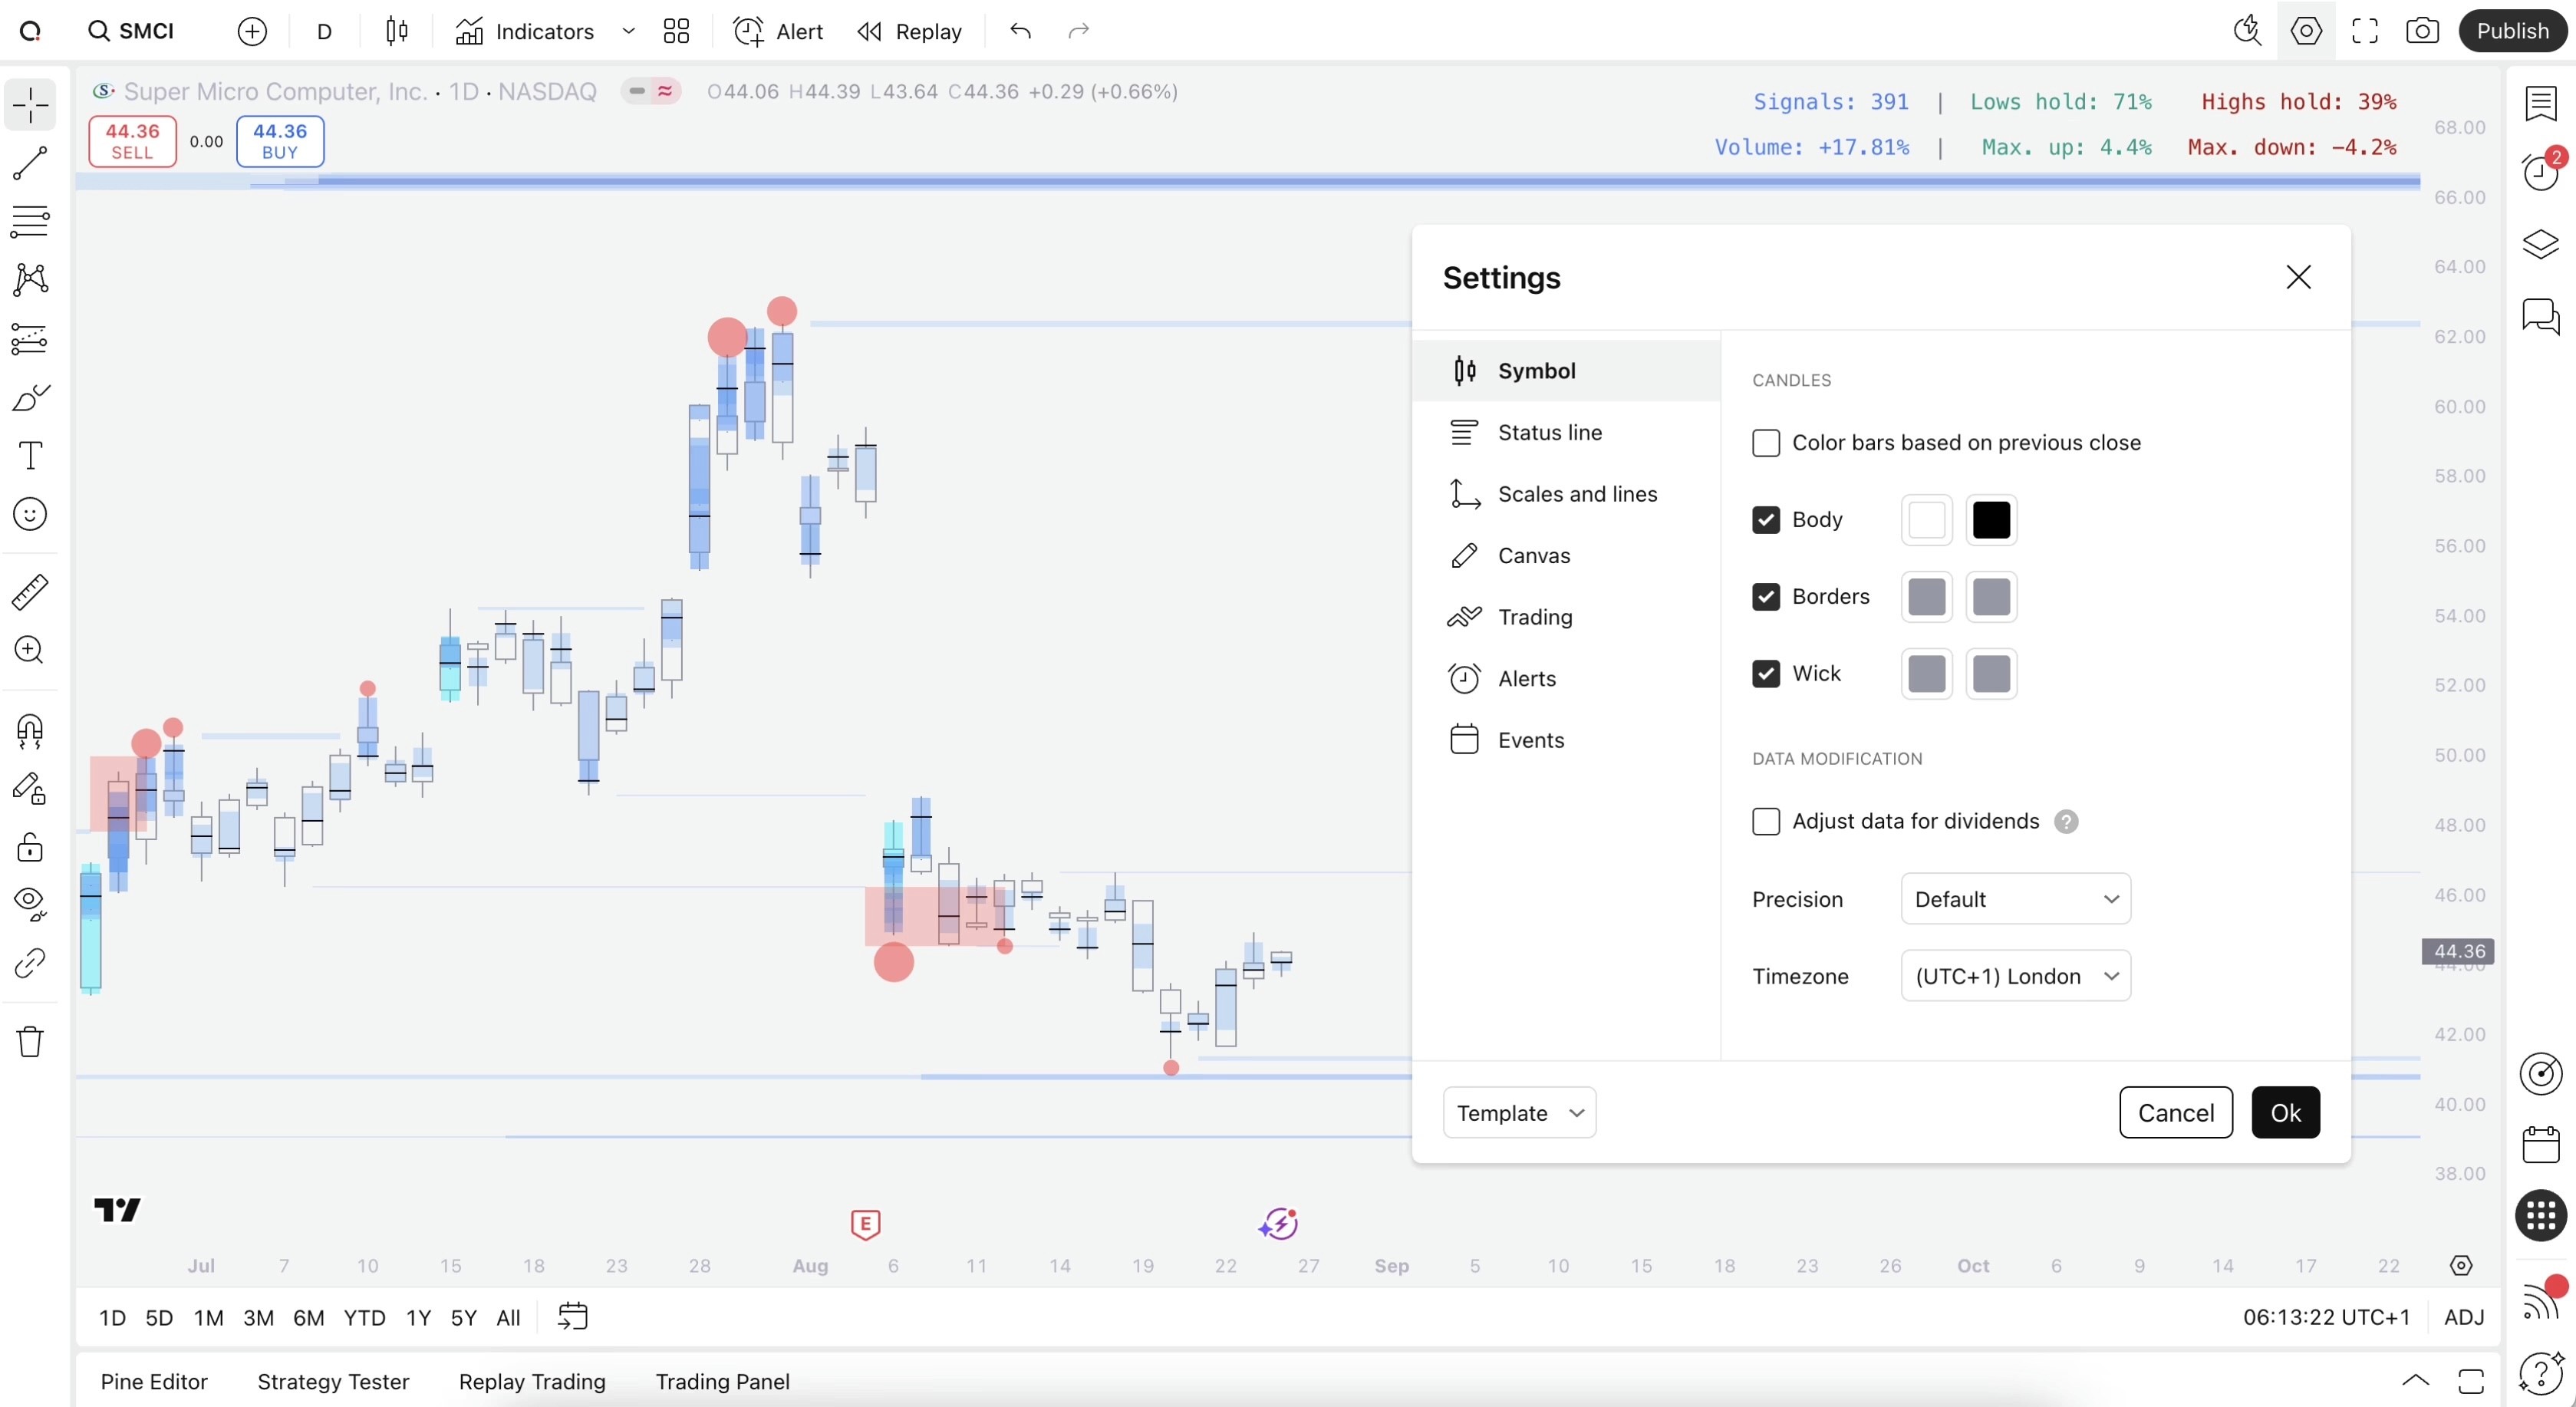
Background color |
|---|
#f4f4f4 |
Style chart for SubFlow Terminal
While all colors on SubFlow Terminal are fully customizable, the default visuals stick out best against white backgrounds. Feel free to copy our template for a similar look.
Chart settings can be found by right clicking anywhere on the chart and selecting "Settings".
Candle borders and wick |
|---|
#9598a1 |
Background color |
|---|
#f4f4f4 |
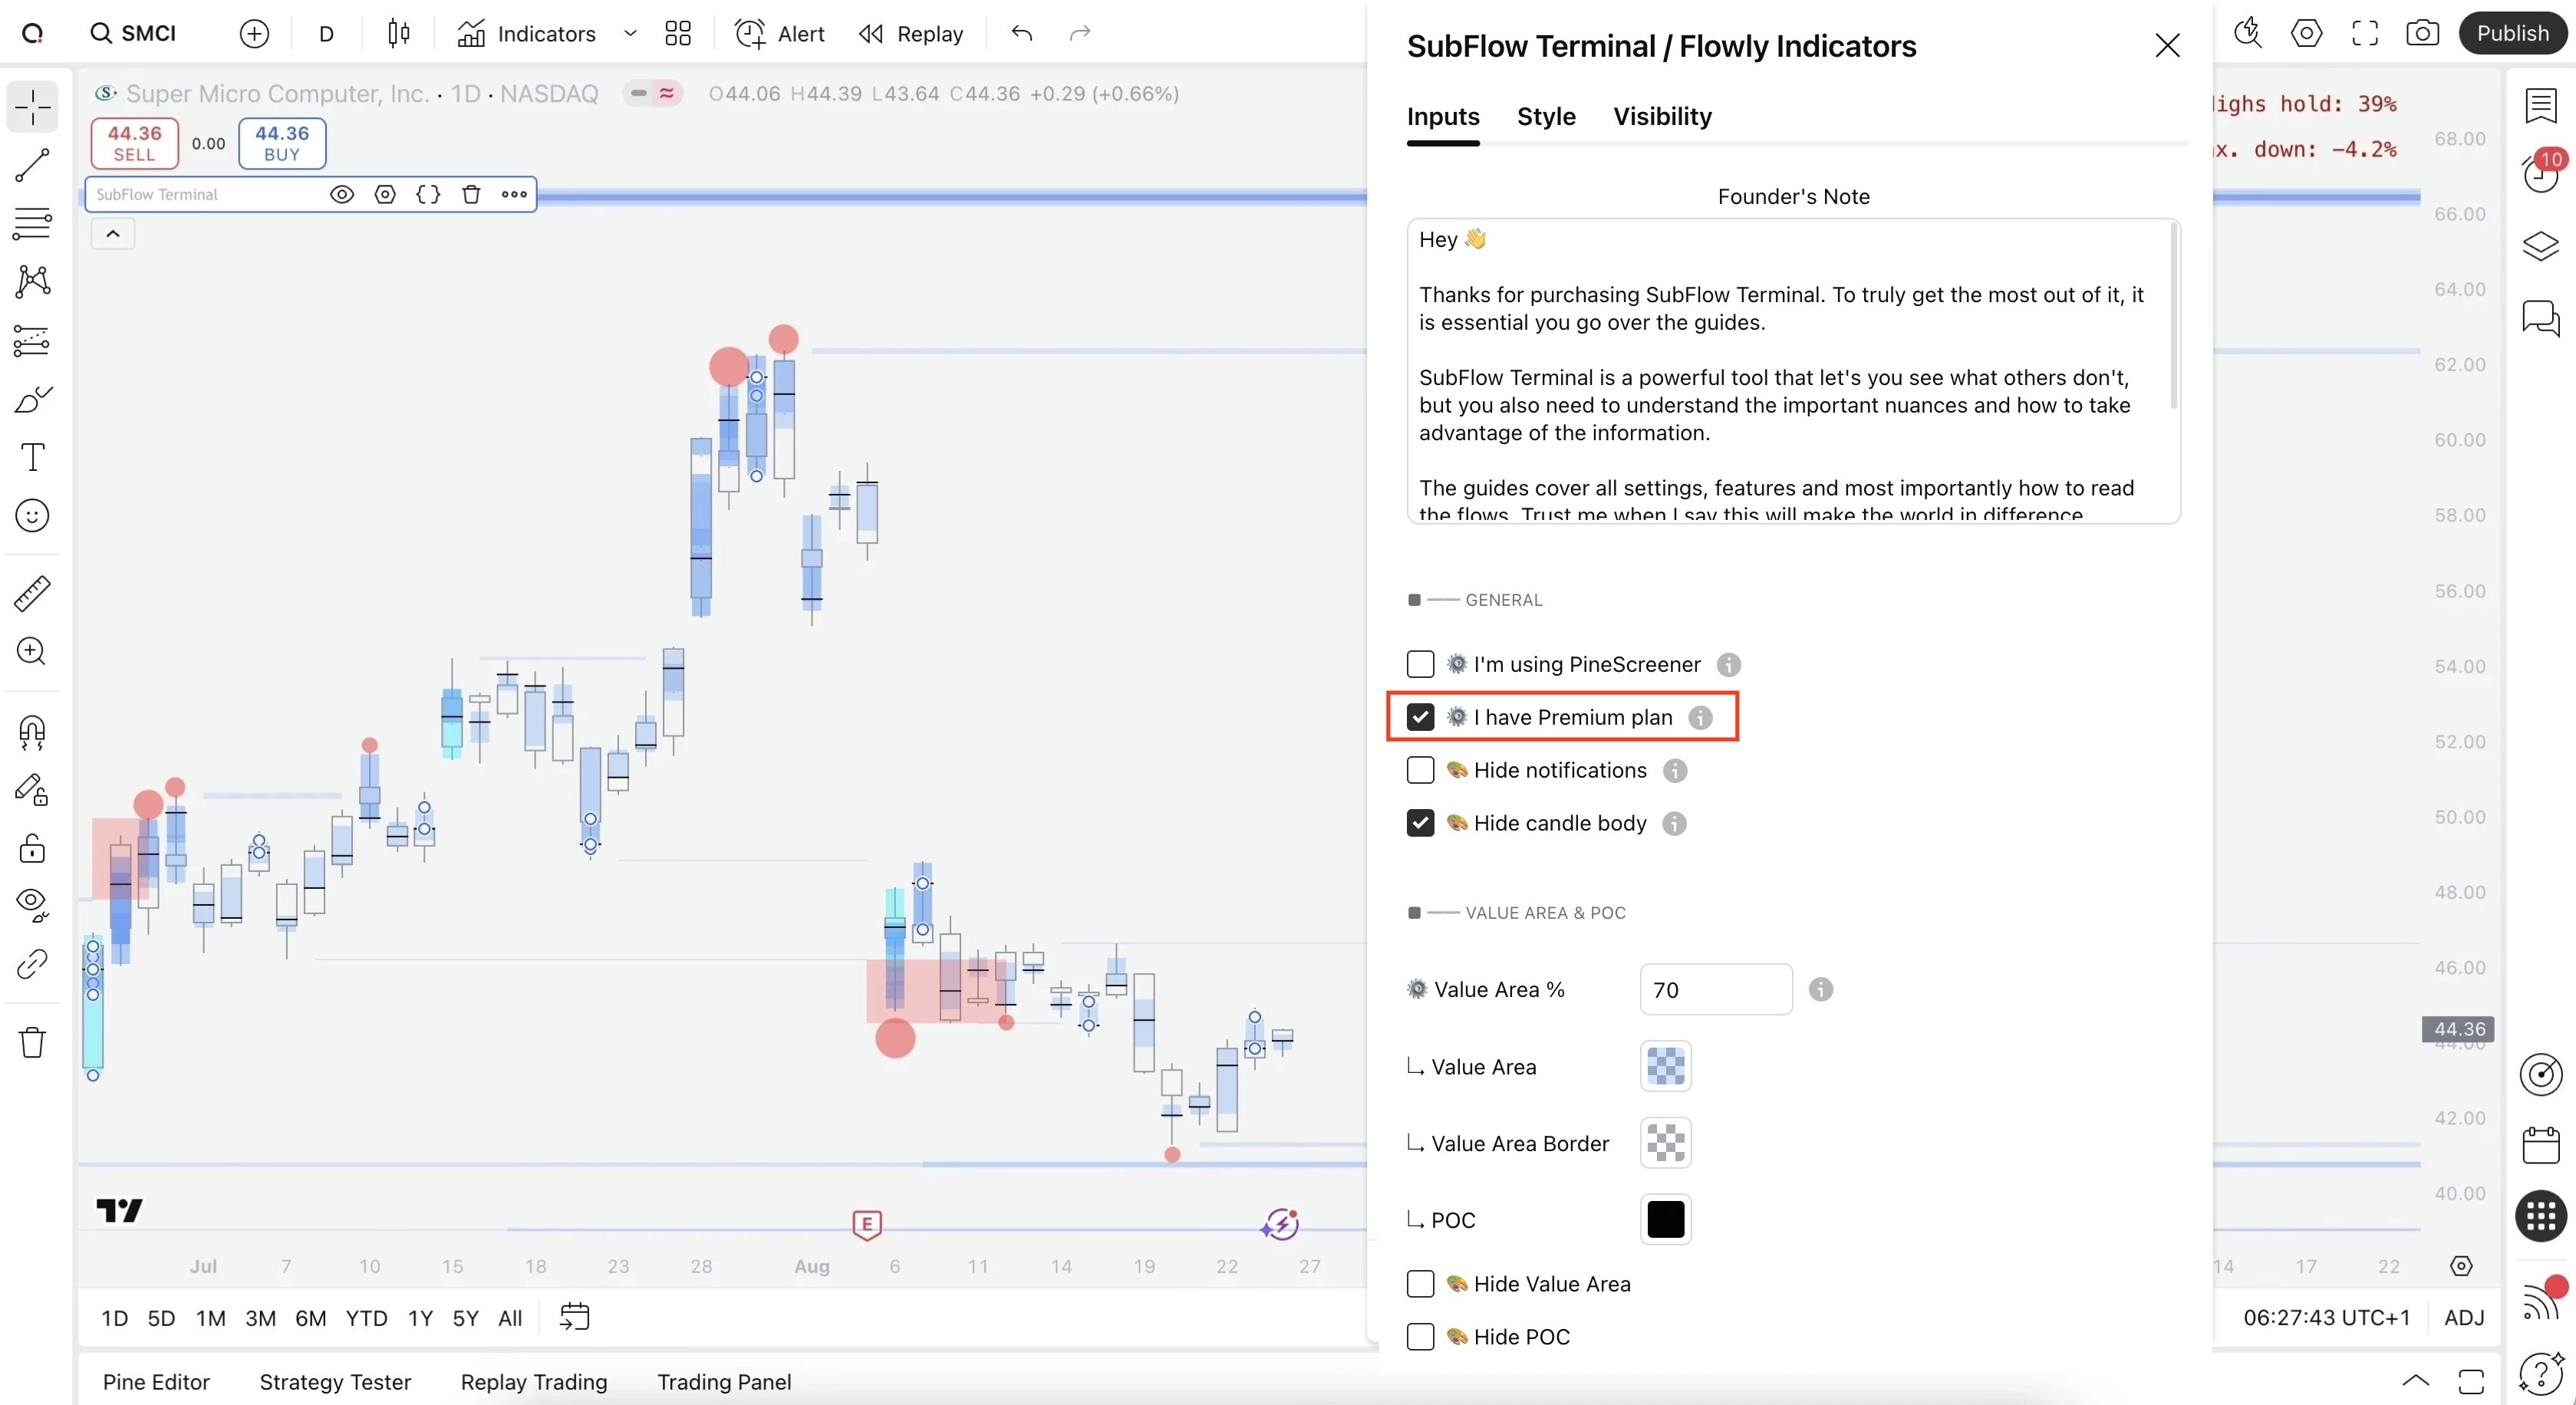
Optimize SubFlow Terminal calculations
While SubFlow Terminal can be used on any TradingView plan, including free plan, users with a paid plan can leverage more accurate orderflow calculations for SubFlow Terminal.
Enable this setting by heading to SubFlow Terminal settings and toggling "I have Premium plan".
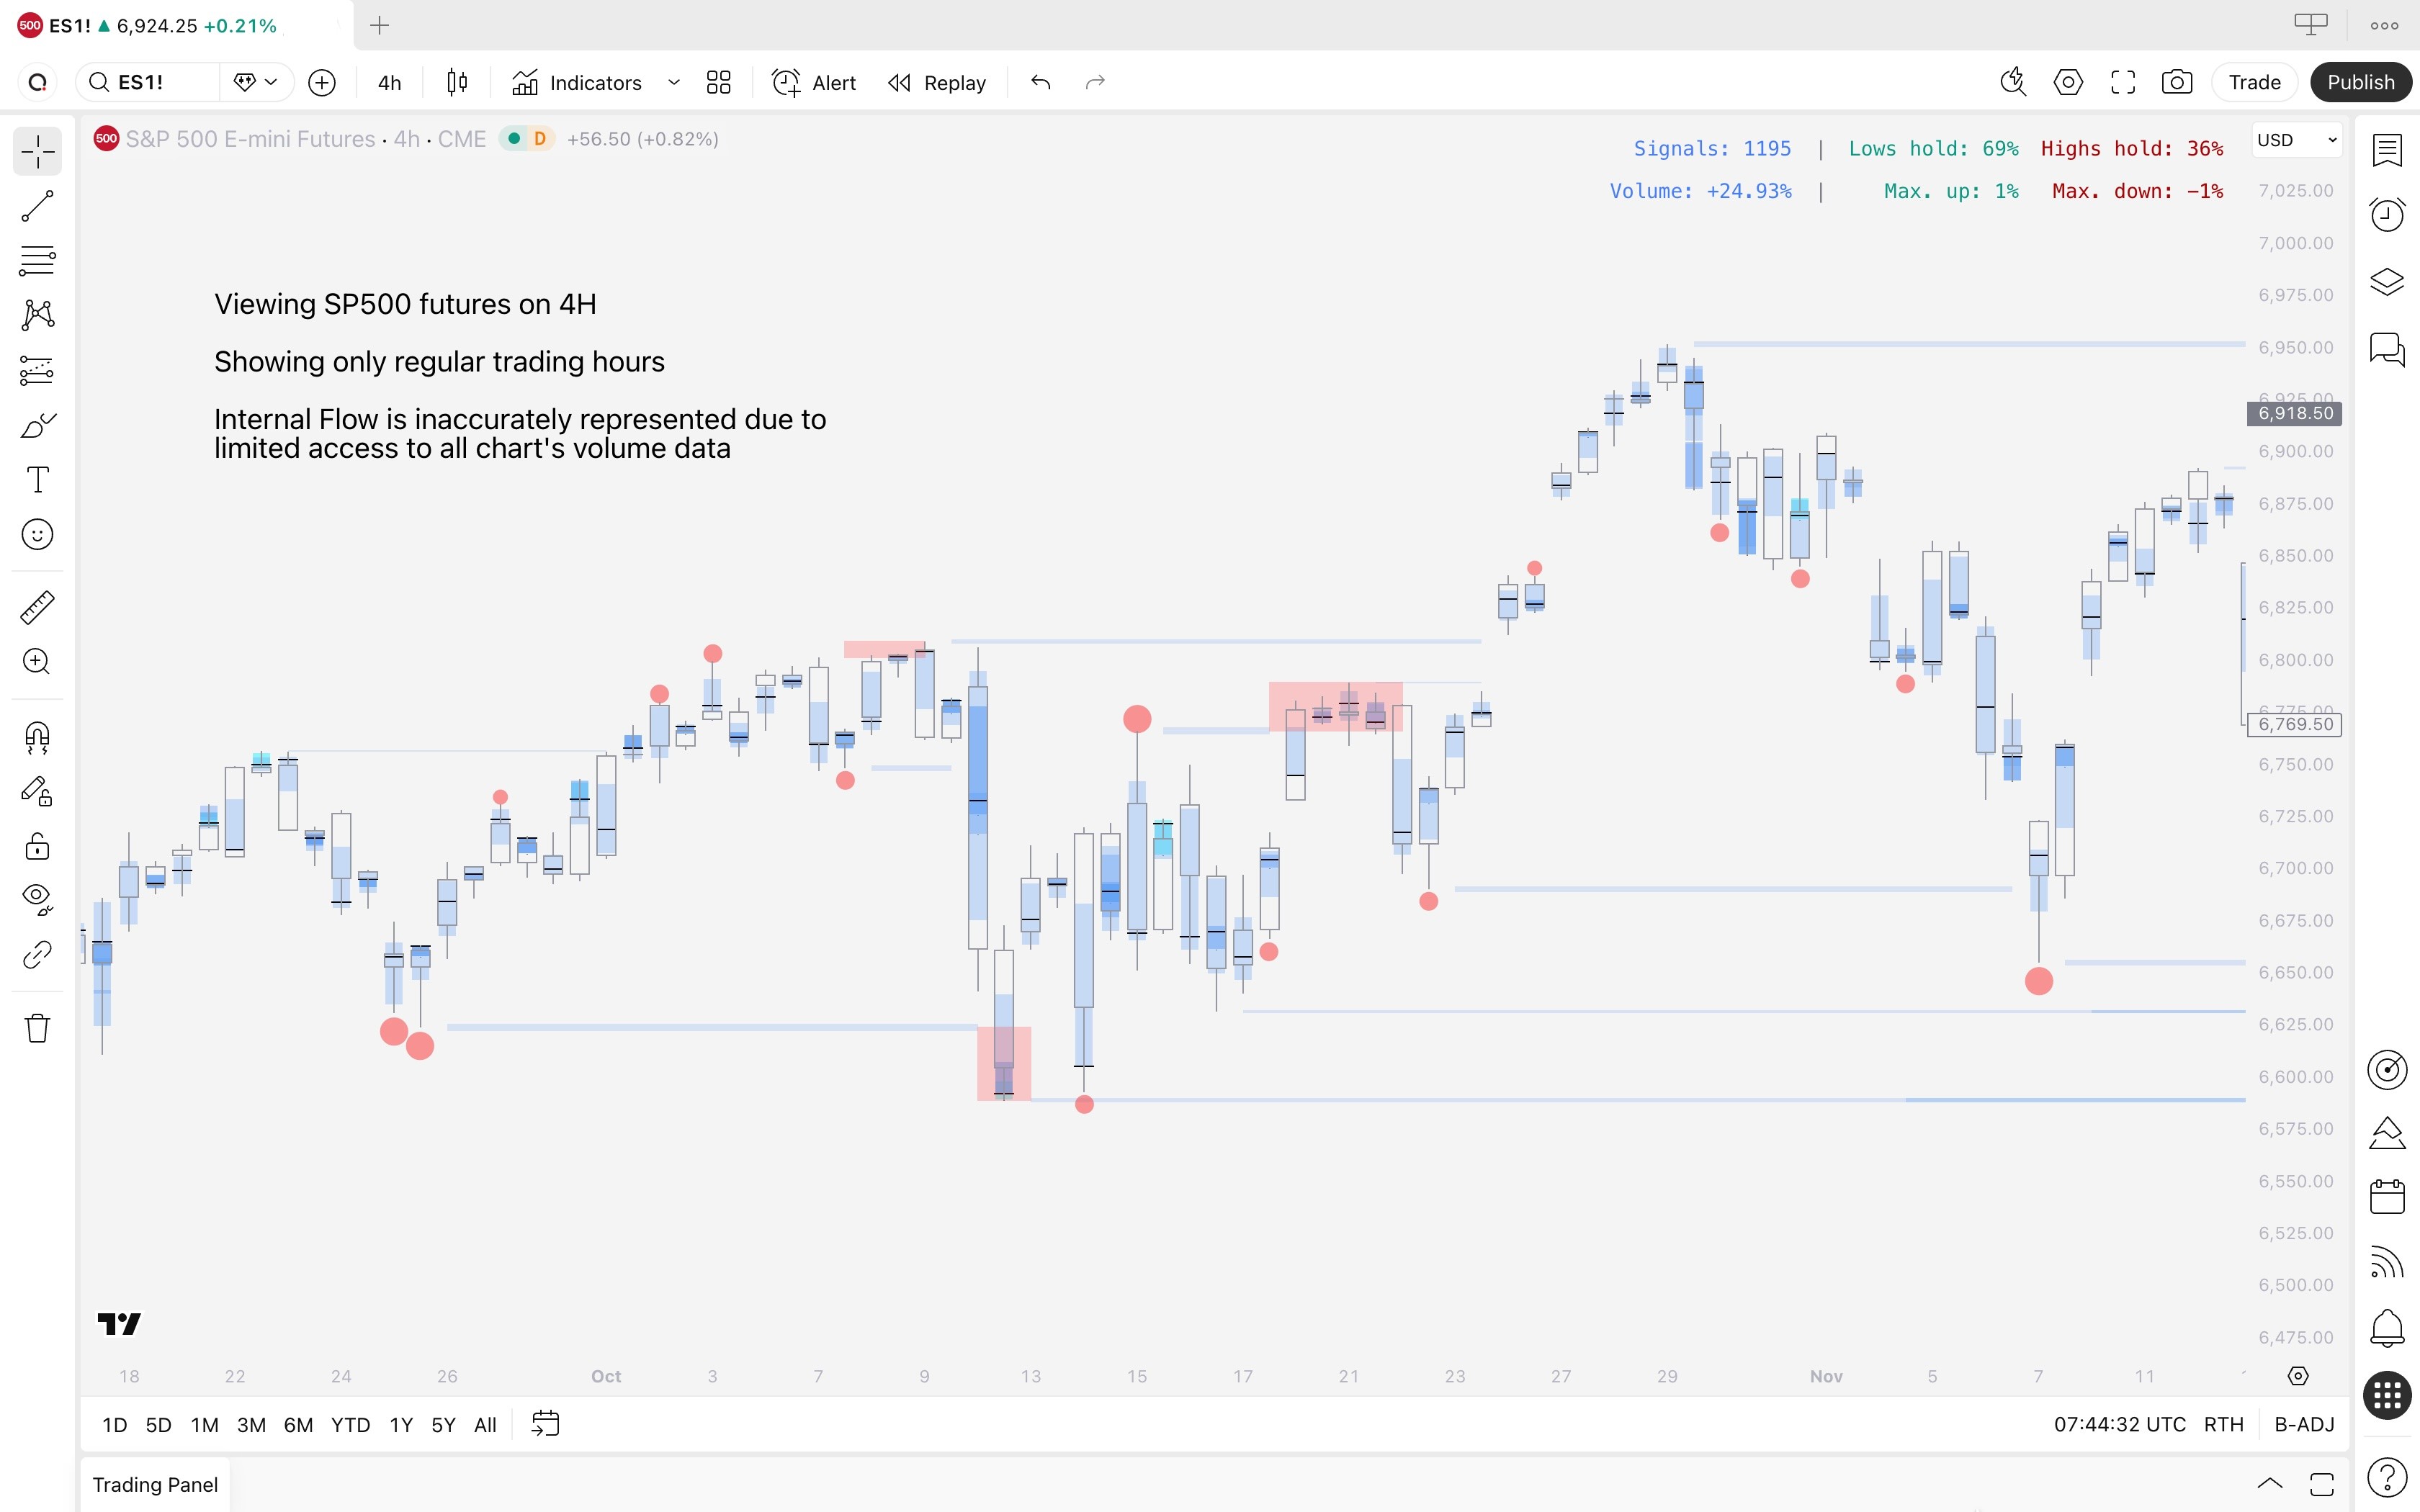
Internal Flow in stock market
By default, TradingView displays stock market charts only for regular trading hours (when stock market is open).
This means Internal Flow will not have access to all volume data available beyond regular trading hours to determine what "unusual volume" means.
On lower timeframe charts, this leads to sparse and inaccurate data.
Switching to electronic trading hours
Internal Flow will work properly once we switch "Regular trading hours" to "Electronic trading hours" on TradingView's chart settings.
Open any stock chart, right click canvas and select Settings
Navigate to "Data modification" under Symbol tab
Select "Electronic trading hours"
Click "Ok"
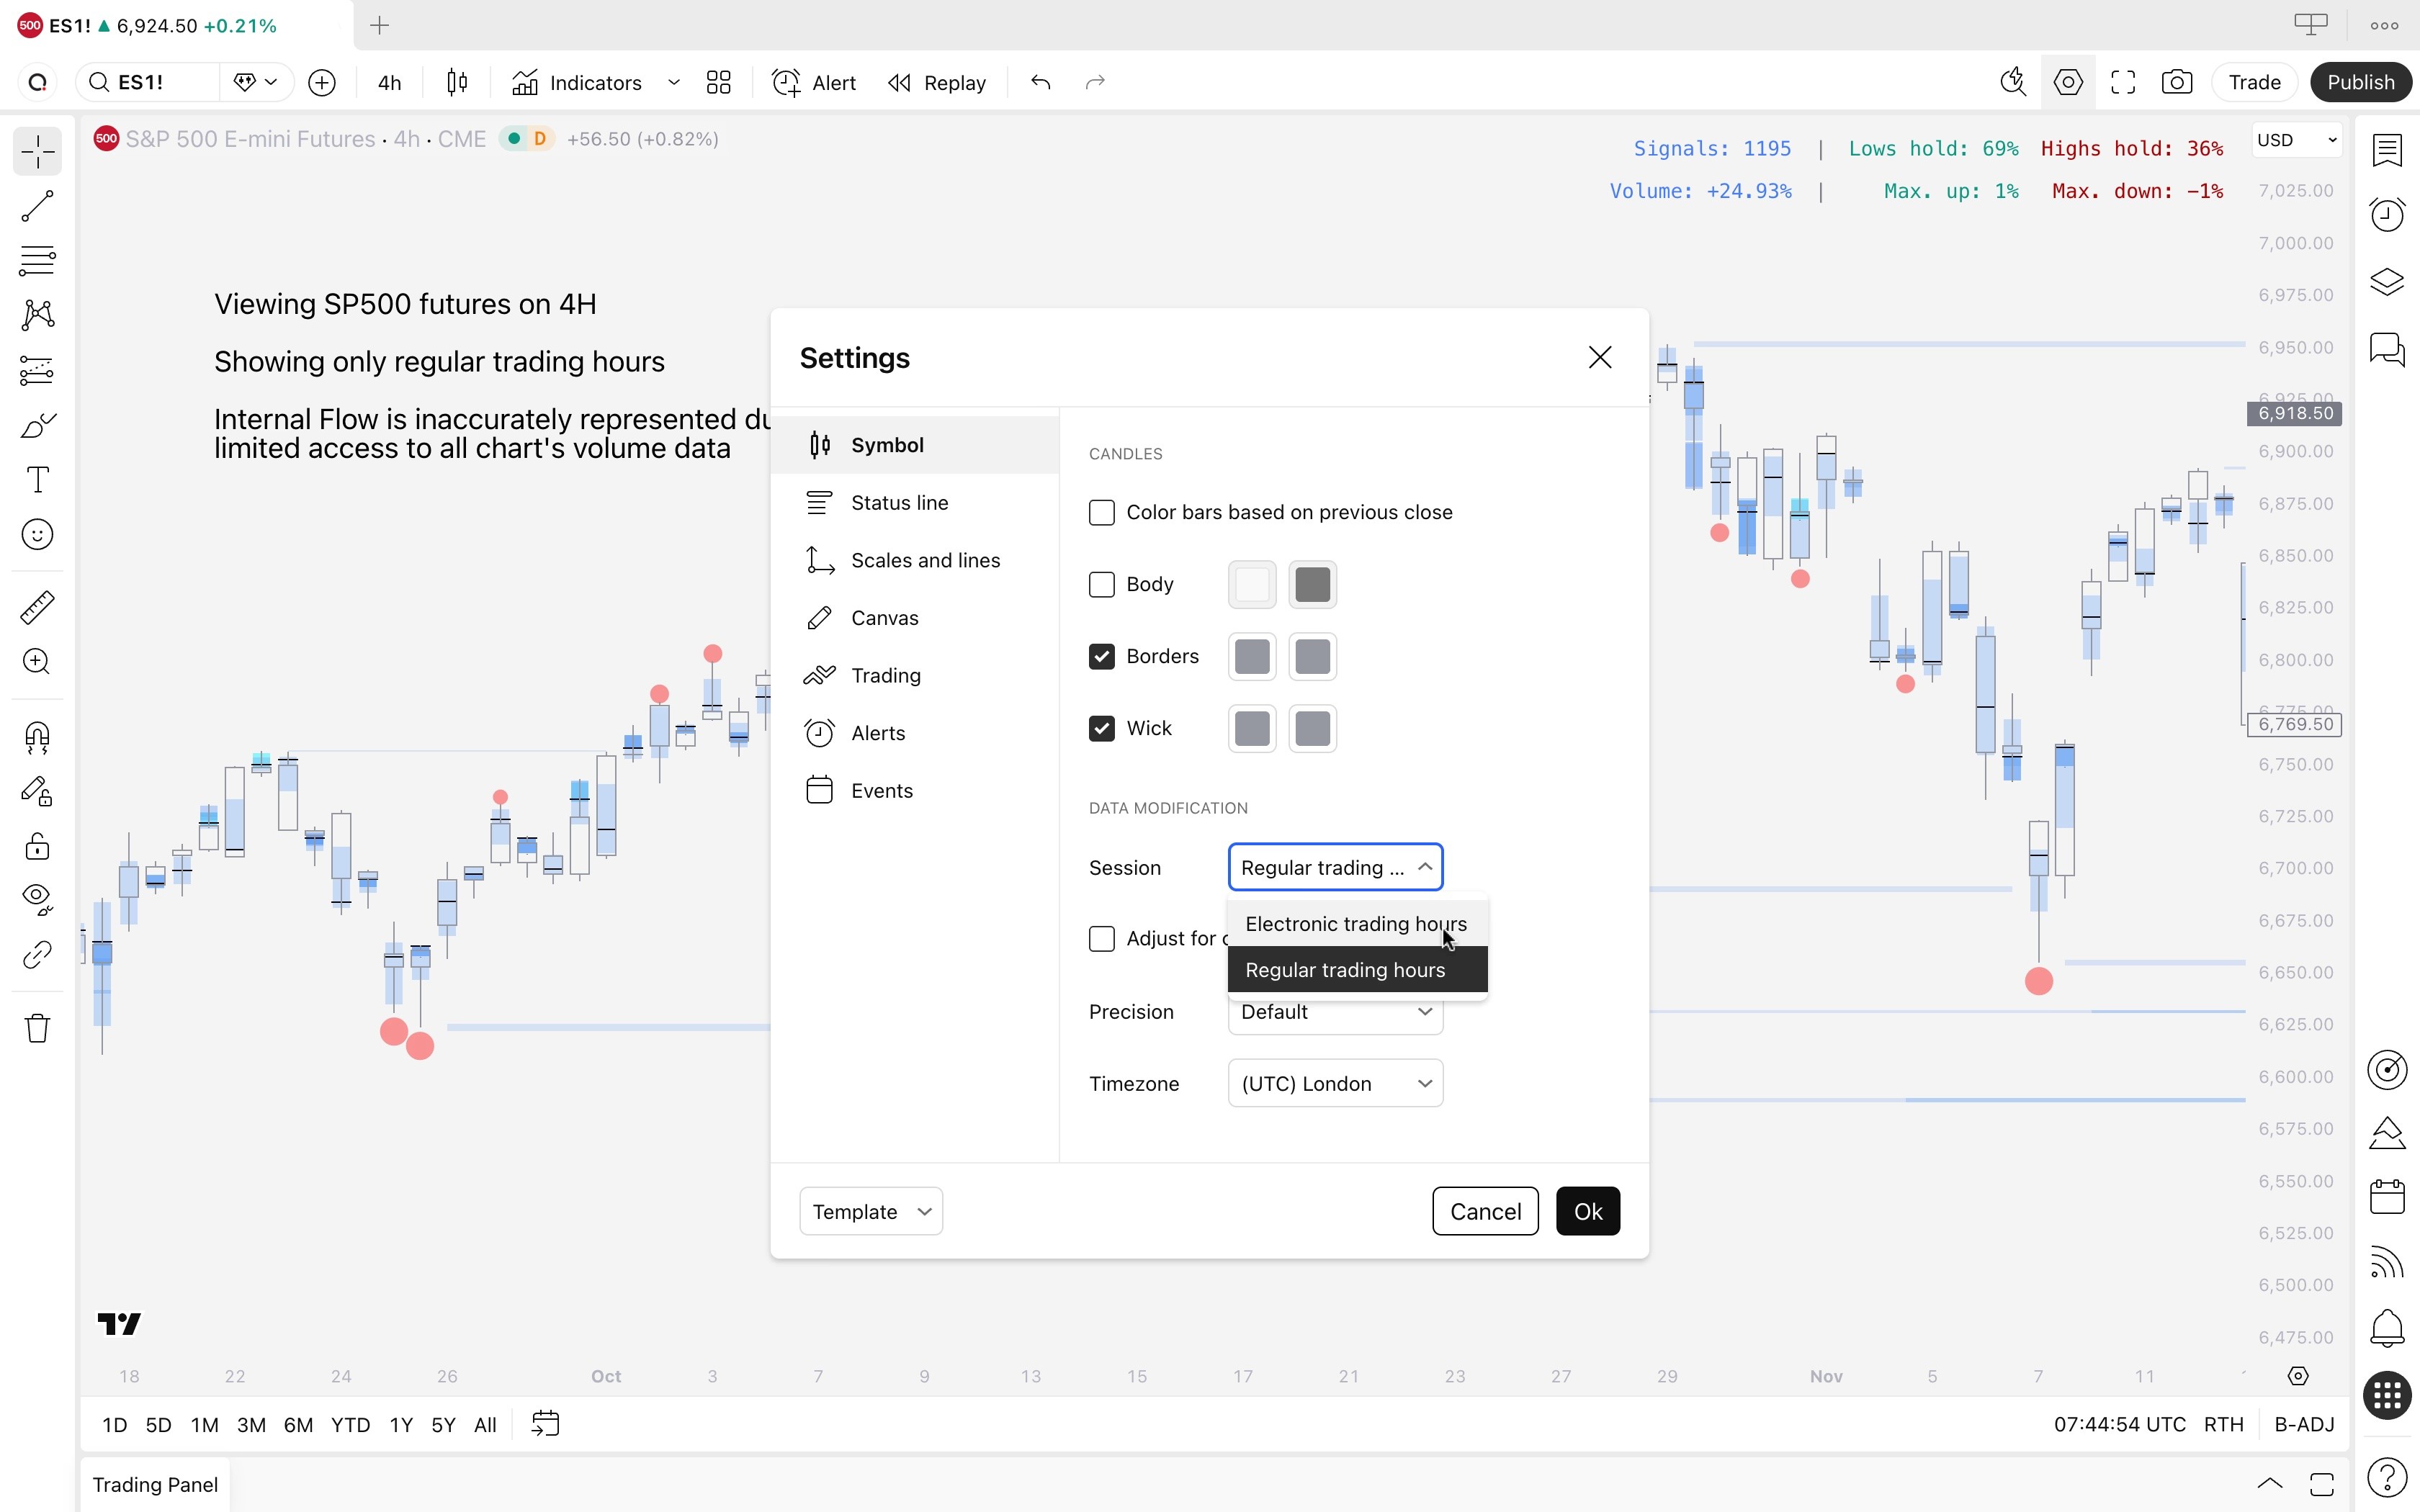
Internal Flow now has access to all volume data on the stock market chart and is represented accurately.
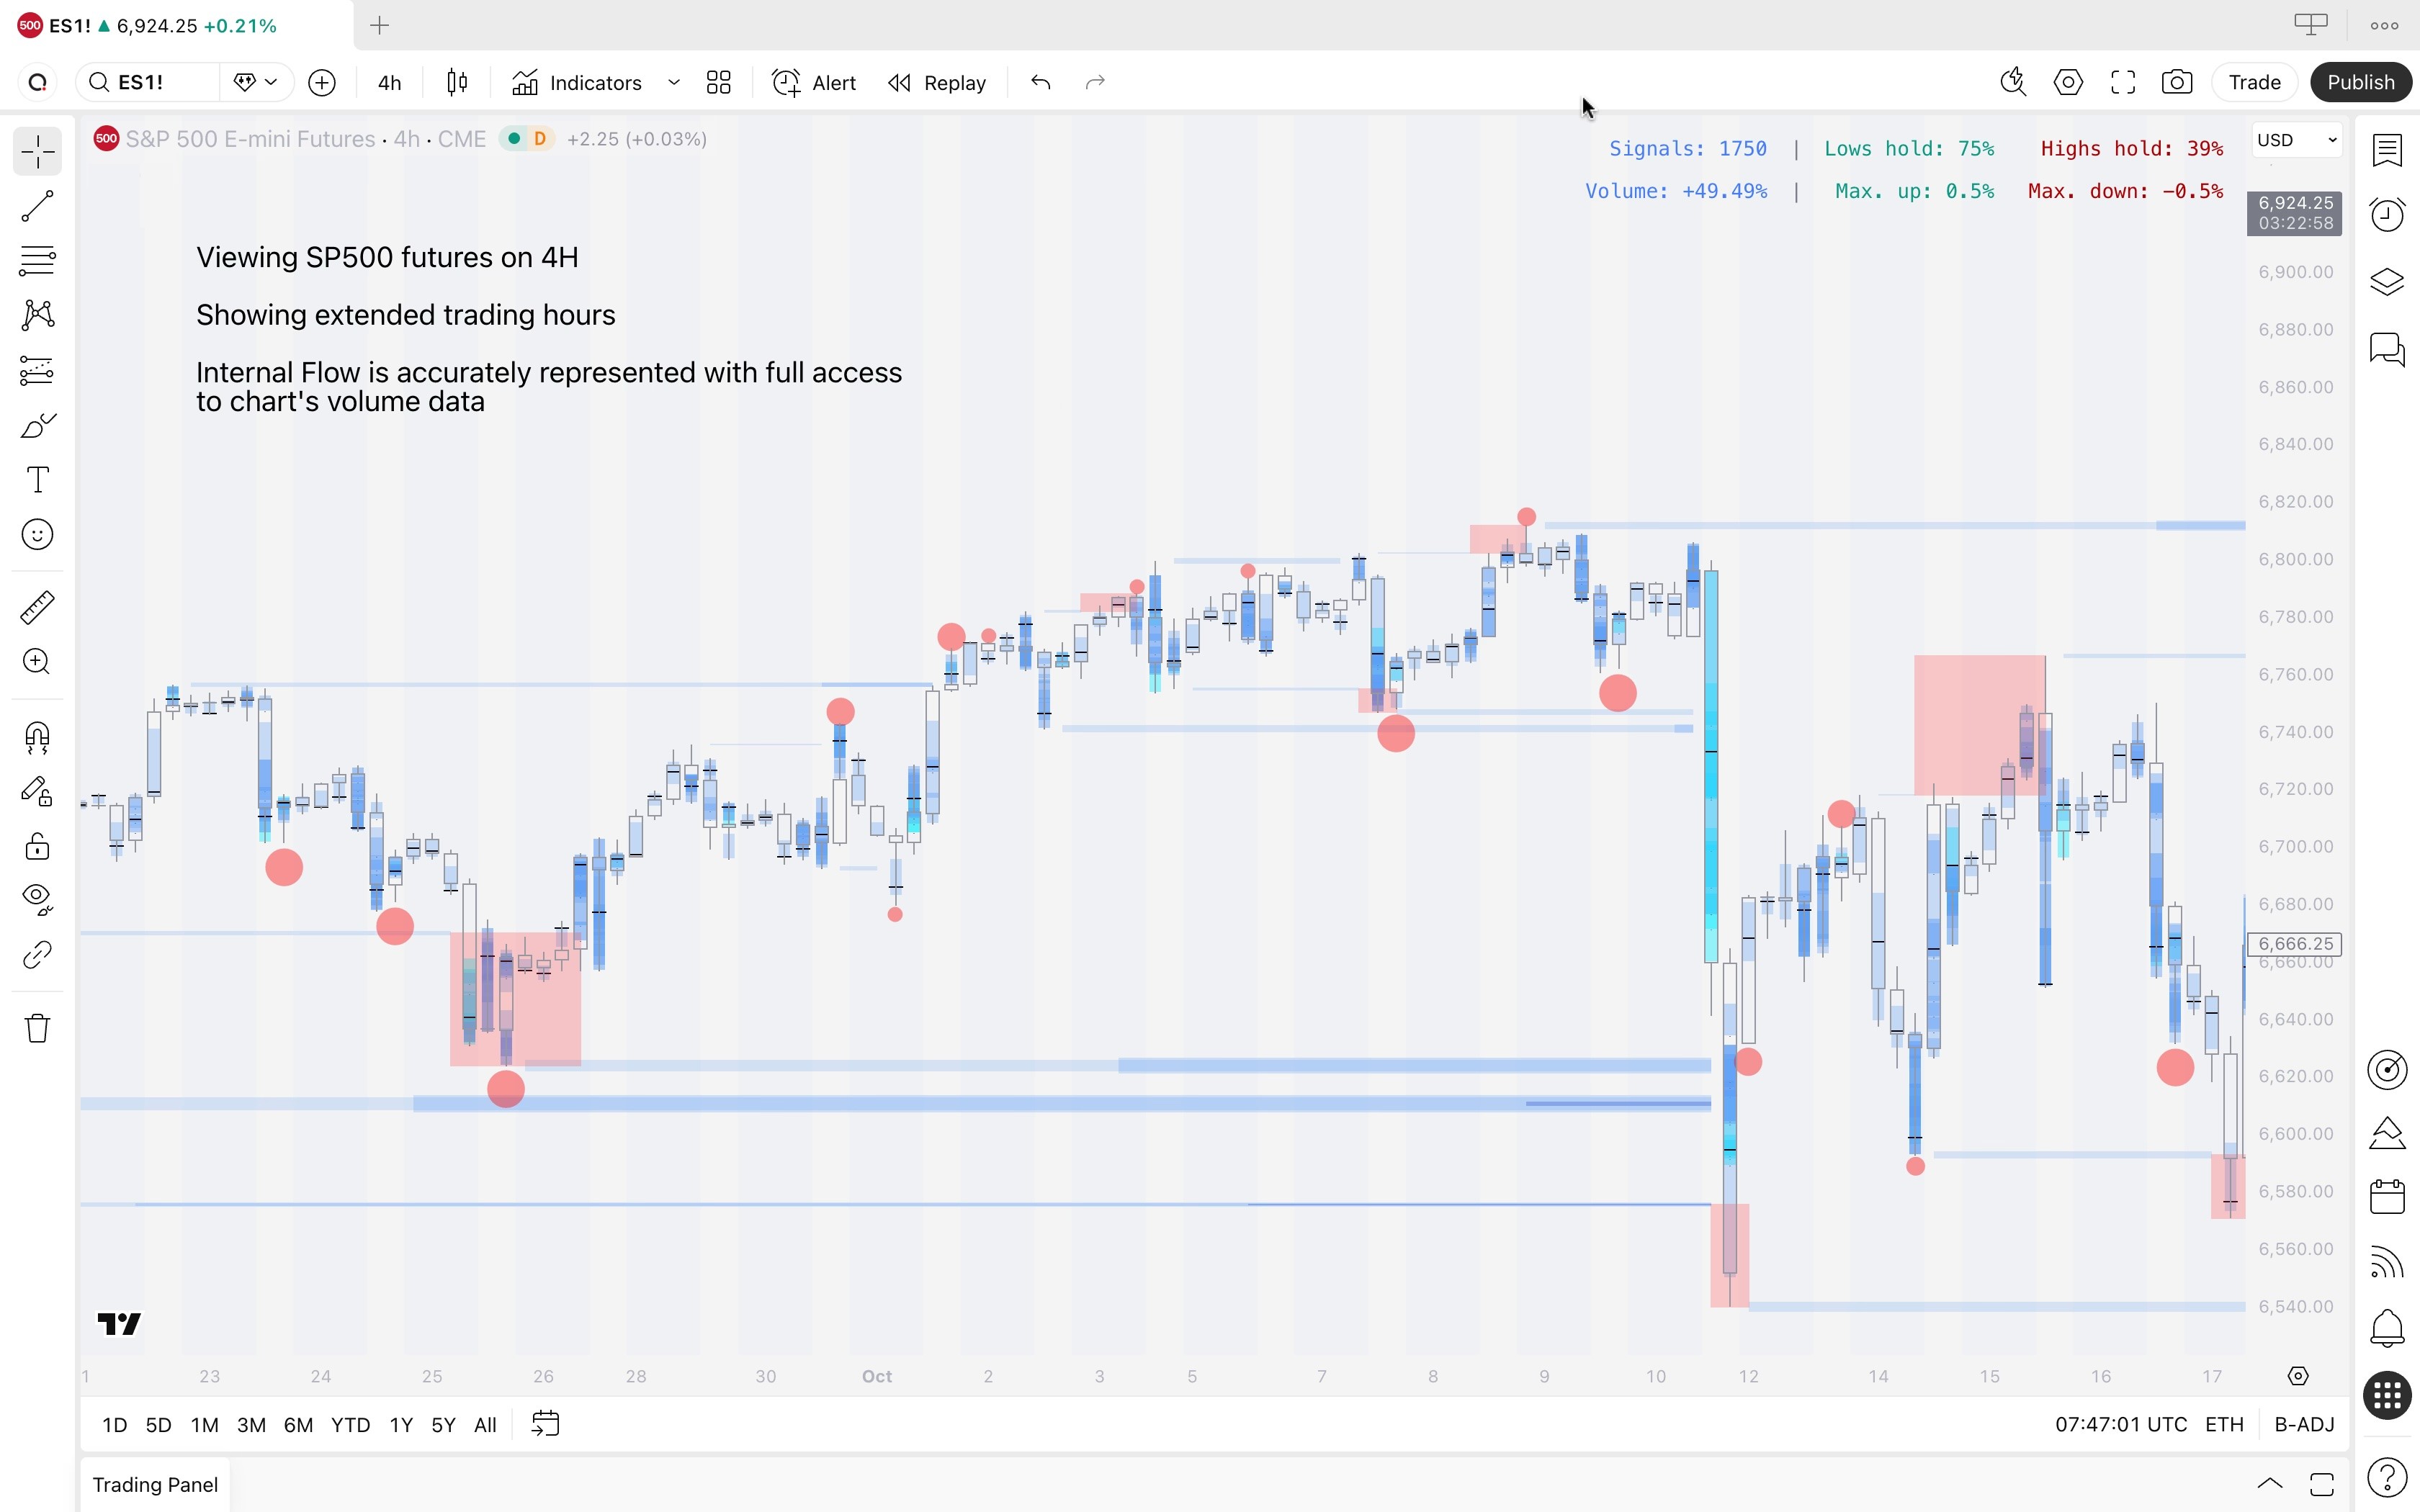
Internal Flow in stock market
By default, TradingView displays stock market charts only for regular trading hours (when stock market is open).
This means Internal Flow will not have access to all volume data available beyond regular trading hours to determine what "unusual volume" means.
On lower timeframe charts, this leads to sparse and inaccurate data.
Switching to electronic trading hours
Internal Flow will work properly once we switch "Regular trading hours" to "Electronic trading hours" on TradingView's chart settings.
Open any stock chart, right click canvas and select Settings
Navigate to "Data modification" under Symbol tab
Select "Electronic trading hours"
Click "Ok"
Internal Flow now has access to all volume data on the stock market chart and is represented accurately.
You're ready to map the flows 🥳
SubFlow Terminal is now all set, you may begin to map the flows and see what others are missing. Move onto other SubFlow Terminal lessons to learn how SubFlow Terminal works and how to trade it 👇
You're ready to map the flows 🥳
SubFlow Terminal is now all set, you may begin to map the flows and see what others are missing. Move onto other SubFlow Terminal lessons to learn how SubFlow Terminal works and how to trade it 👇


