What is liquidity in trading?
Liquidity in trading context simply means buy and sell orders that are waiting to be executed at a higher or lower price than current market price.
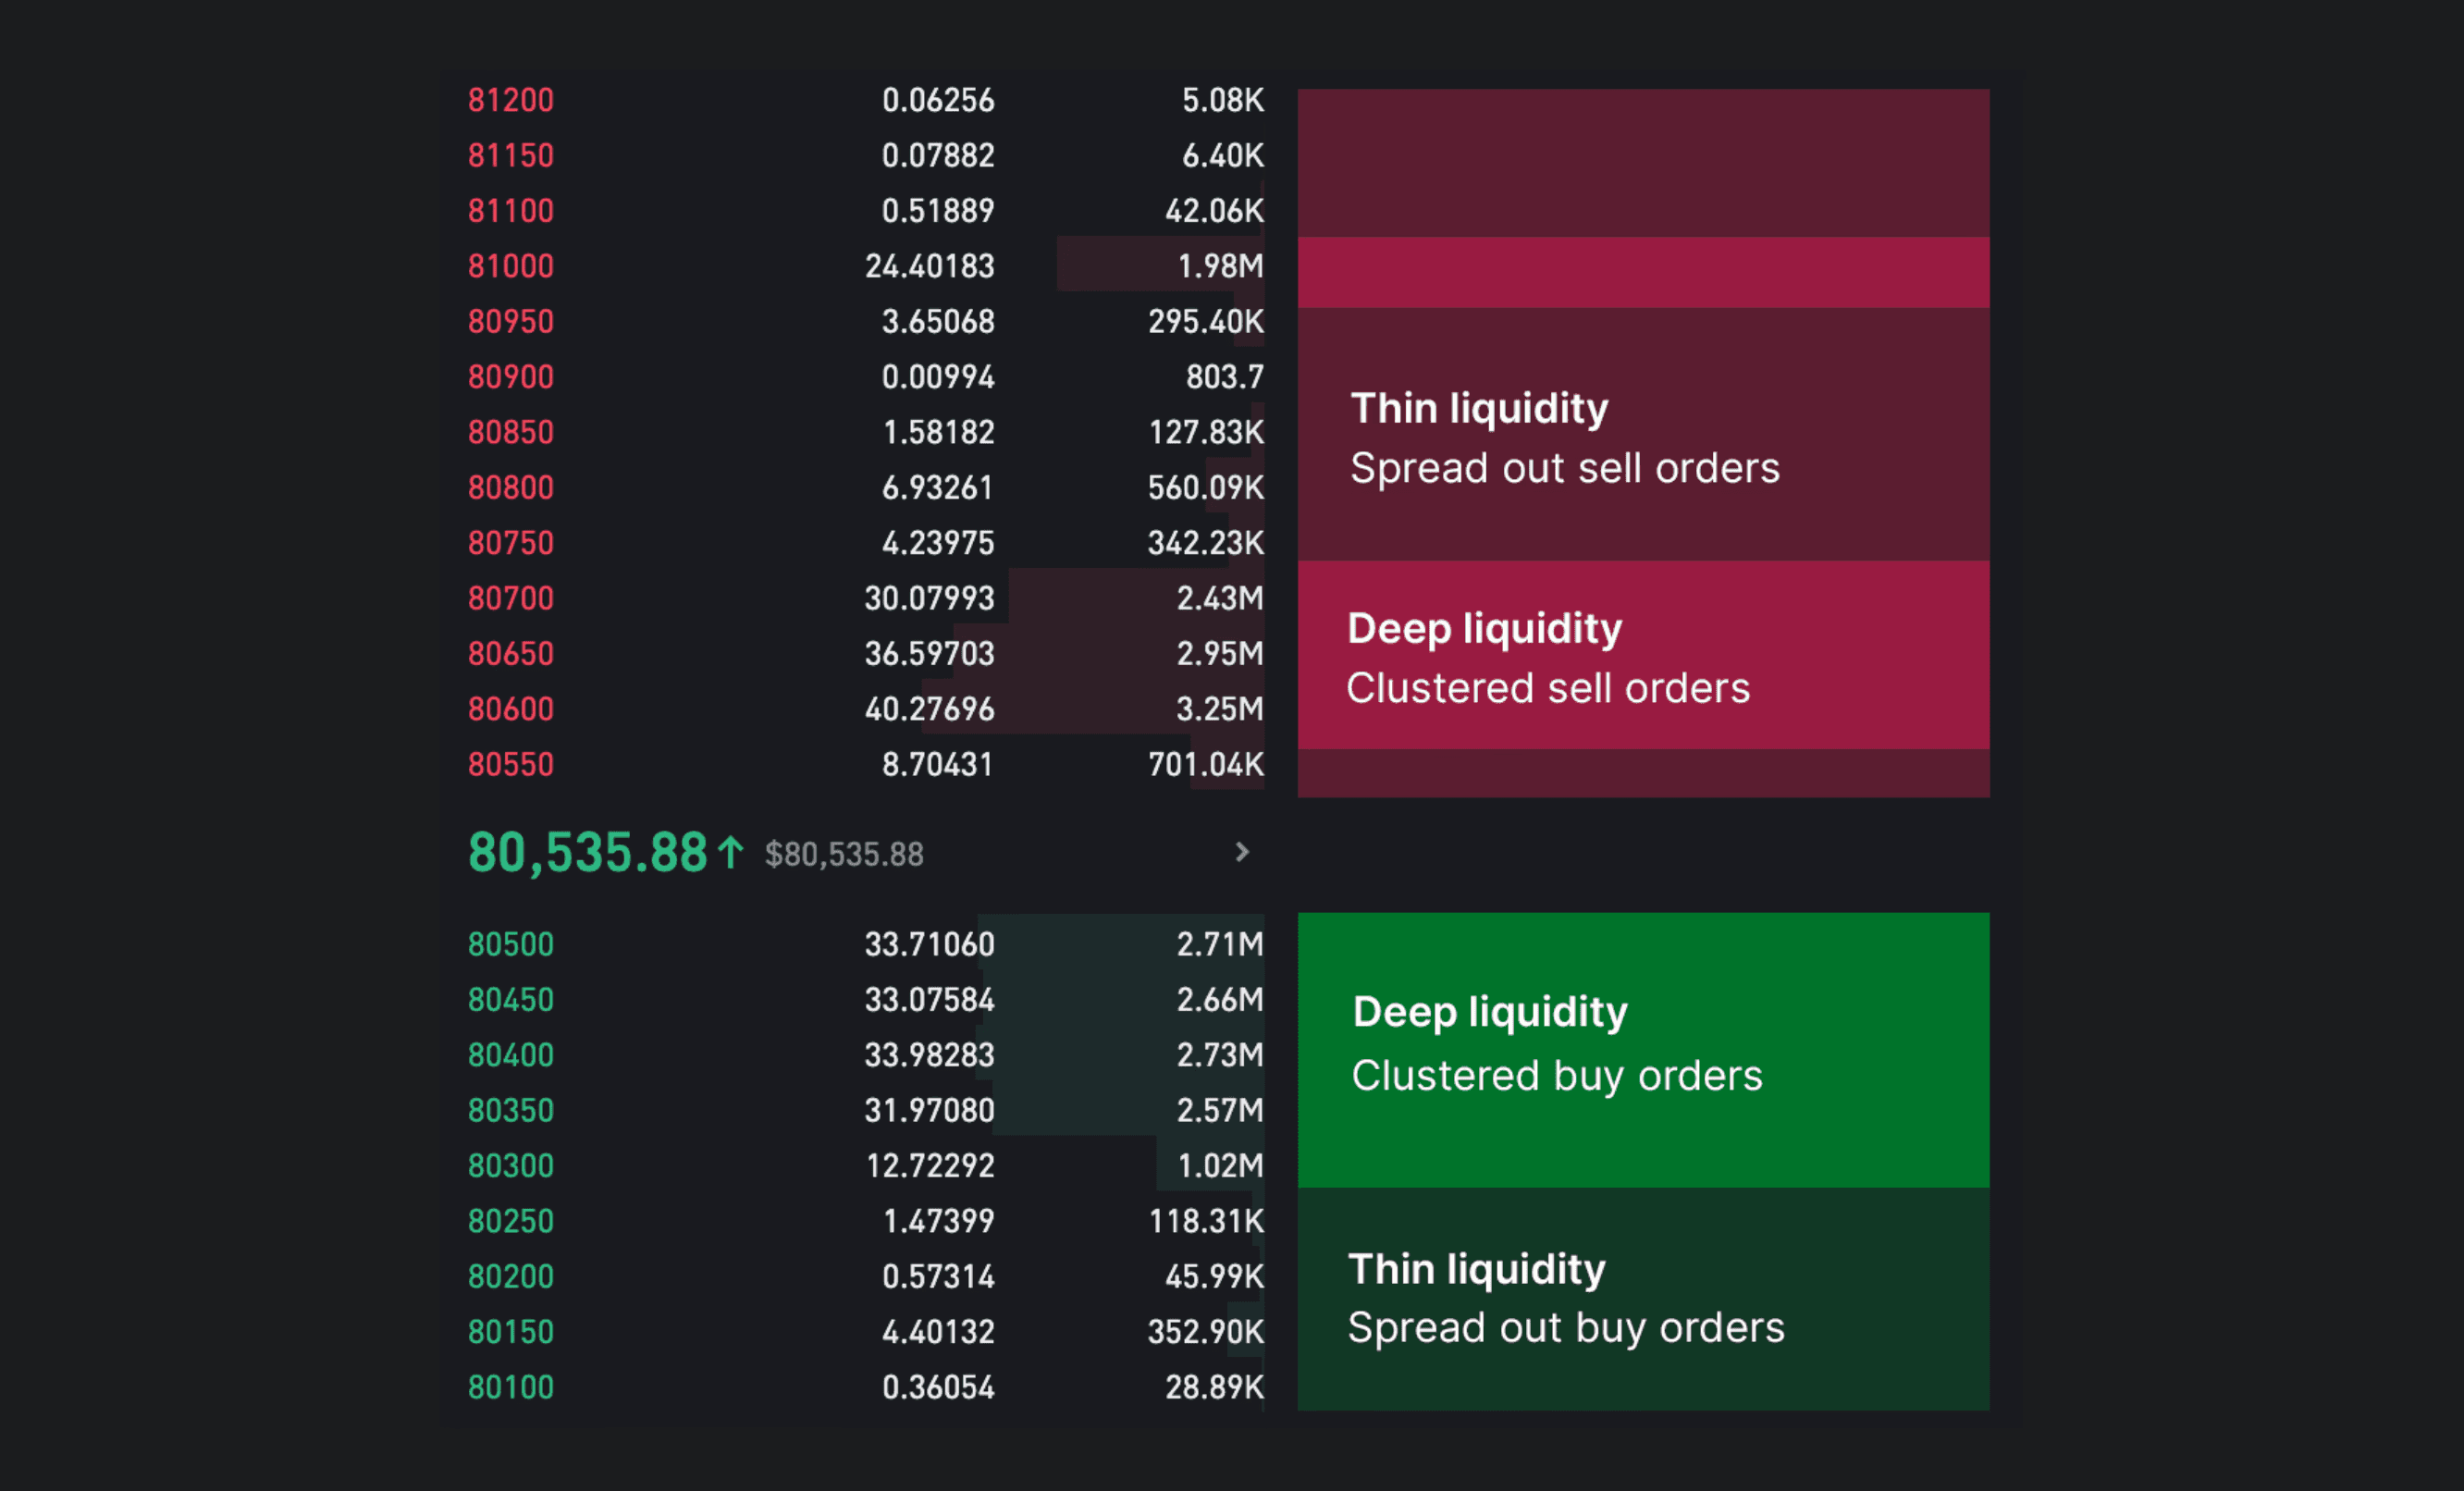
Depth of liquidity refers to how many buy and sell orders are clustered around price levels.
Deep liquidity | Thin liquidity |
|---|---|
Large amount of buy/sell orders in narrow price area. Path of hard resistance. | Insignificant amount of buy/sell orders spread out in large price area. Path of least resistance. |
Traders are usually concerned with deep liquidity, as that's where price can be expected to find resistance.
Here's how that looks like in a live exchange orderbook.
How price moves through liquidity
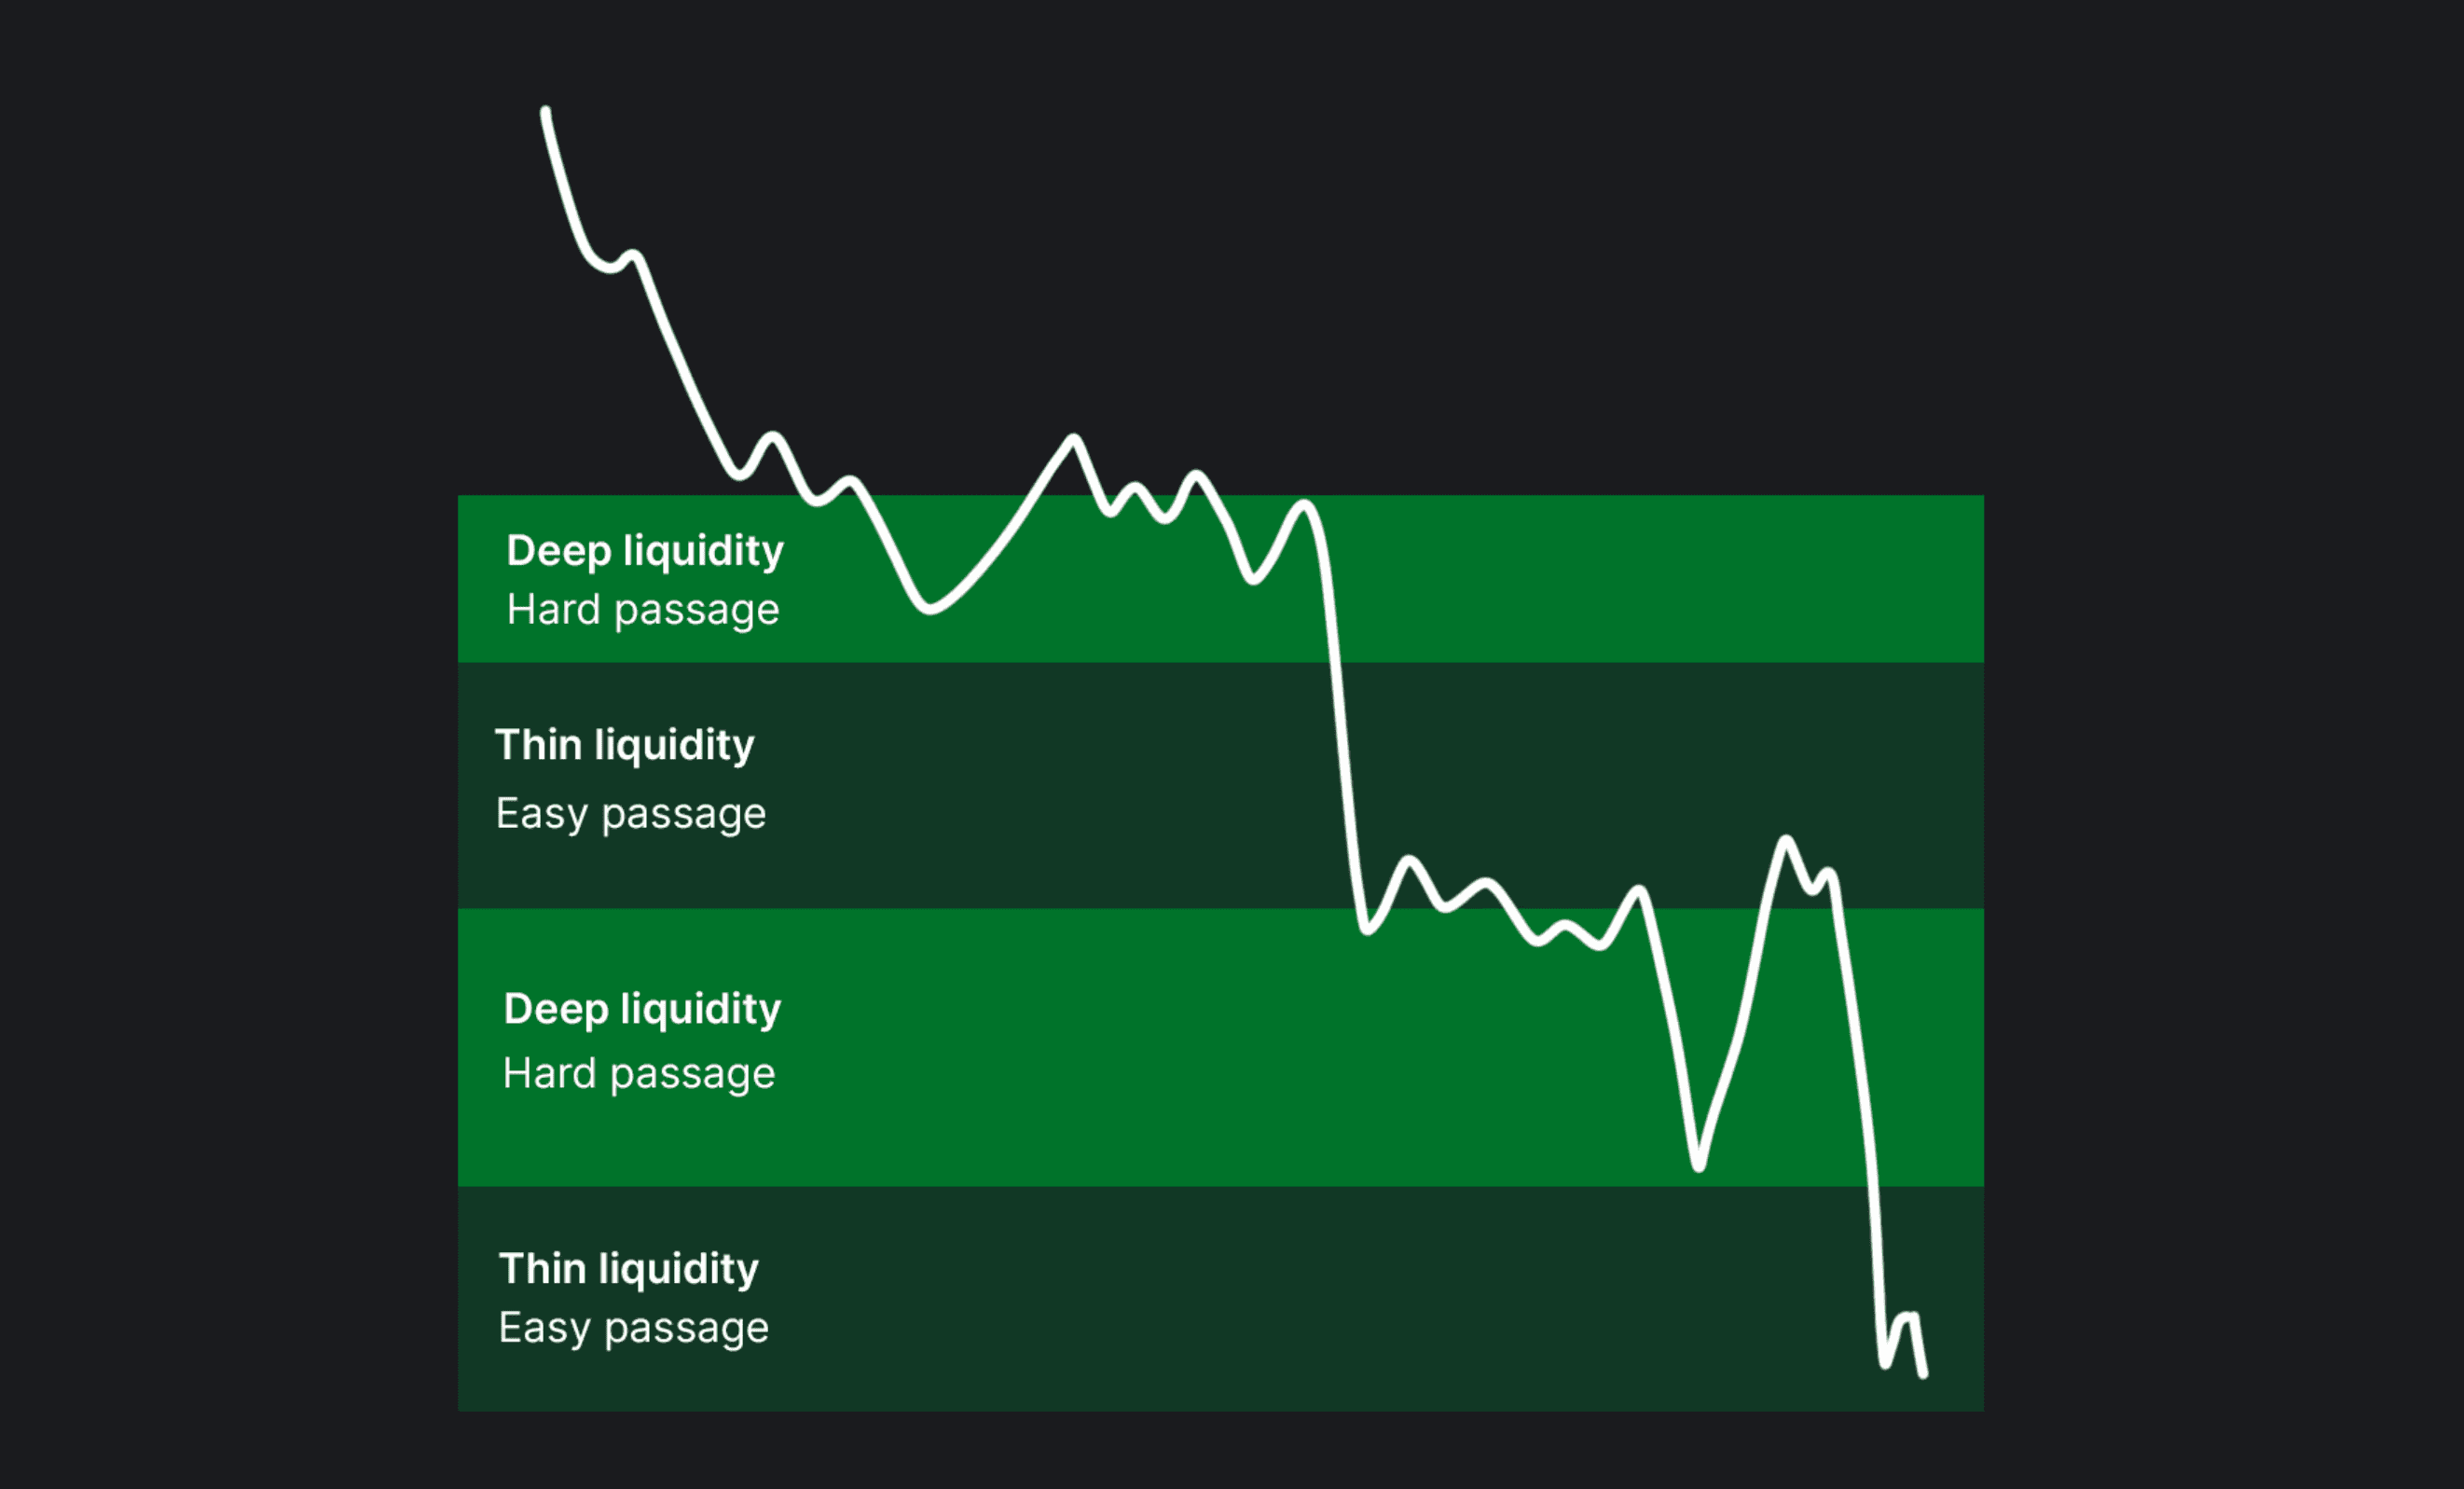
At deep liquidity, price struggles to move to higher/lower prices due to high amount of buy/sell orders clustered around narrow area in price. Because the supply is large, demand also needs to be large to pass through.
Thin liquidity is the opposite, price doesn't struggle to move to higher/lower prices. Because supply is insignificant, demand doesn't need to be significant either to pass through.
We can expect price to behave roughly like this in when trading at deep and thin liquidity.
What is liquidity in trading?
Liquidity in trading context simply means buy and sell orders that are waiting to be executed at a higher or lower price than current market price.
Depth of liquidity refers to how many buy and sell orders are clustered around price levels.
Deep liquidity | Thin liquidity |
|---|---|
Large amount of buy/sell orders in narrow price area. Path of hard resistance. | Insignificant amount of buy/sell orders spread out in large price area. Path of least resistance. |
Traders are usually concerned with deep liquidity, as that's where price can be expected to find resistance.
Here's how that looks like in a live exchange orderbook.
How price moves through liquidity
At deep liquidity, price struggles to move to higher/lower prices due to high amount of buy/sell orders clustered around narrow area in price. Because the supply is large, demand also needs to be large to pass through.
Thin liquidity is the opposite, price doesn't struggle to move to higher/lower prices. Because supply is insignificant, demand doesn't need to be significant either to pass through.
We can expect price to behave roughly like this in when trading at deep and thin liquidity.
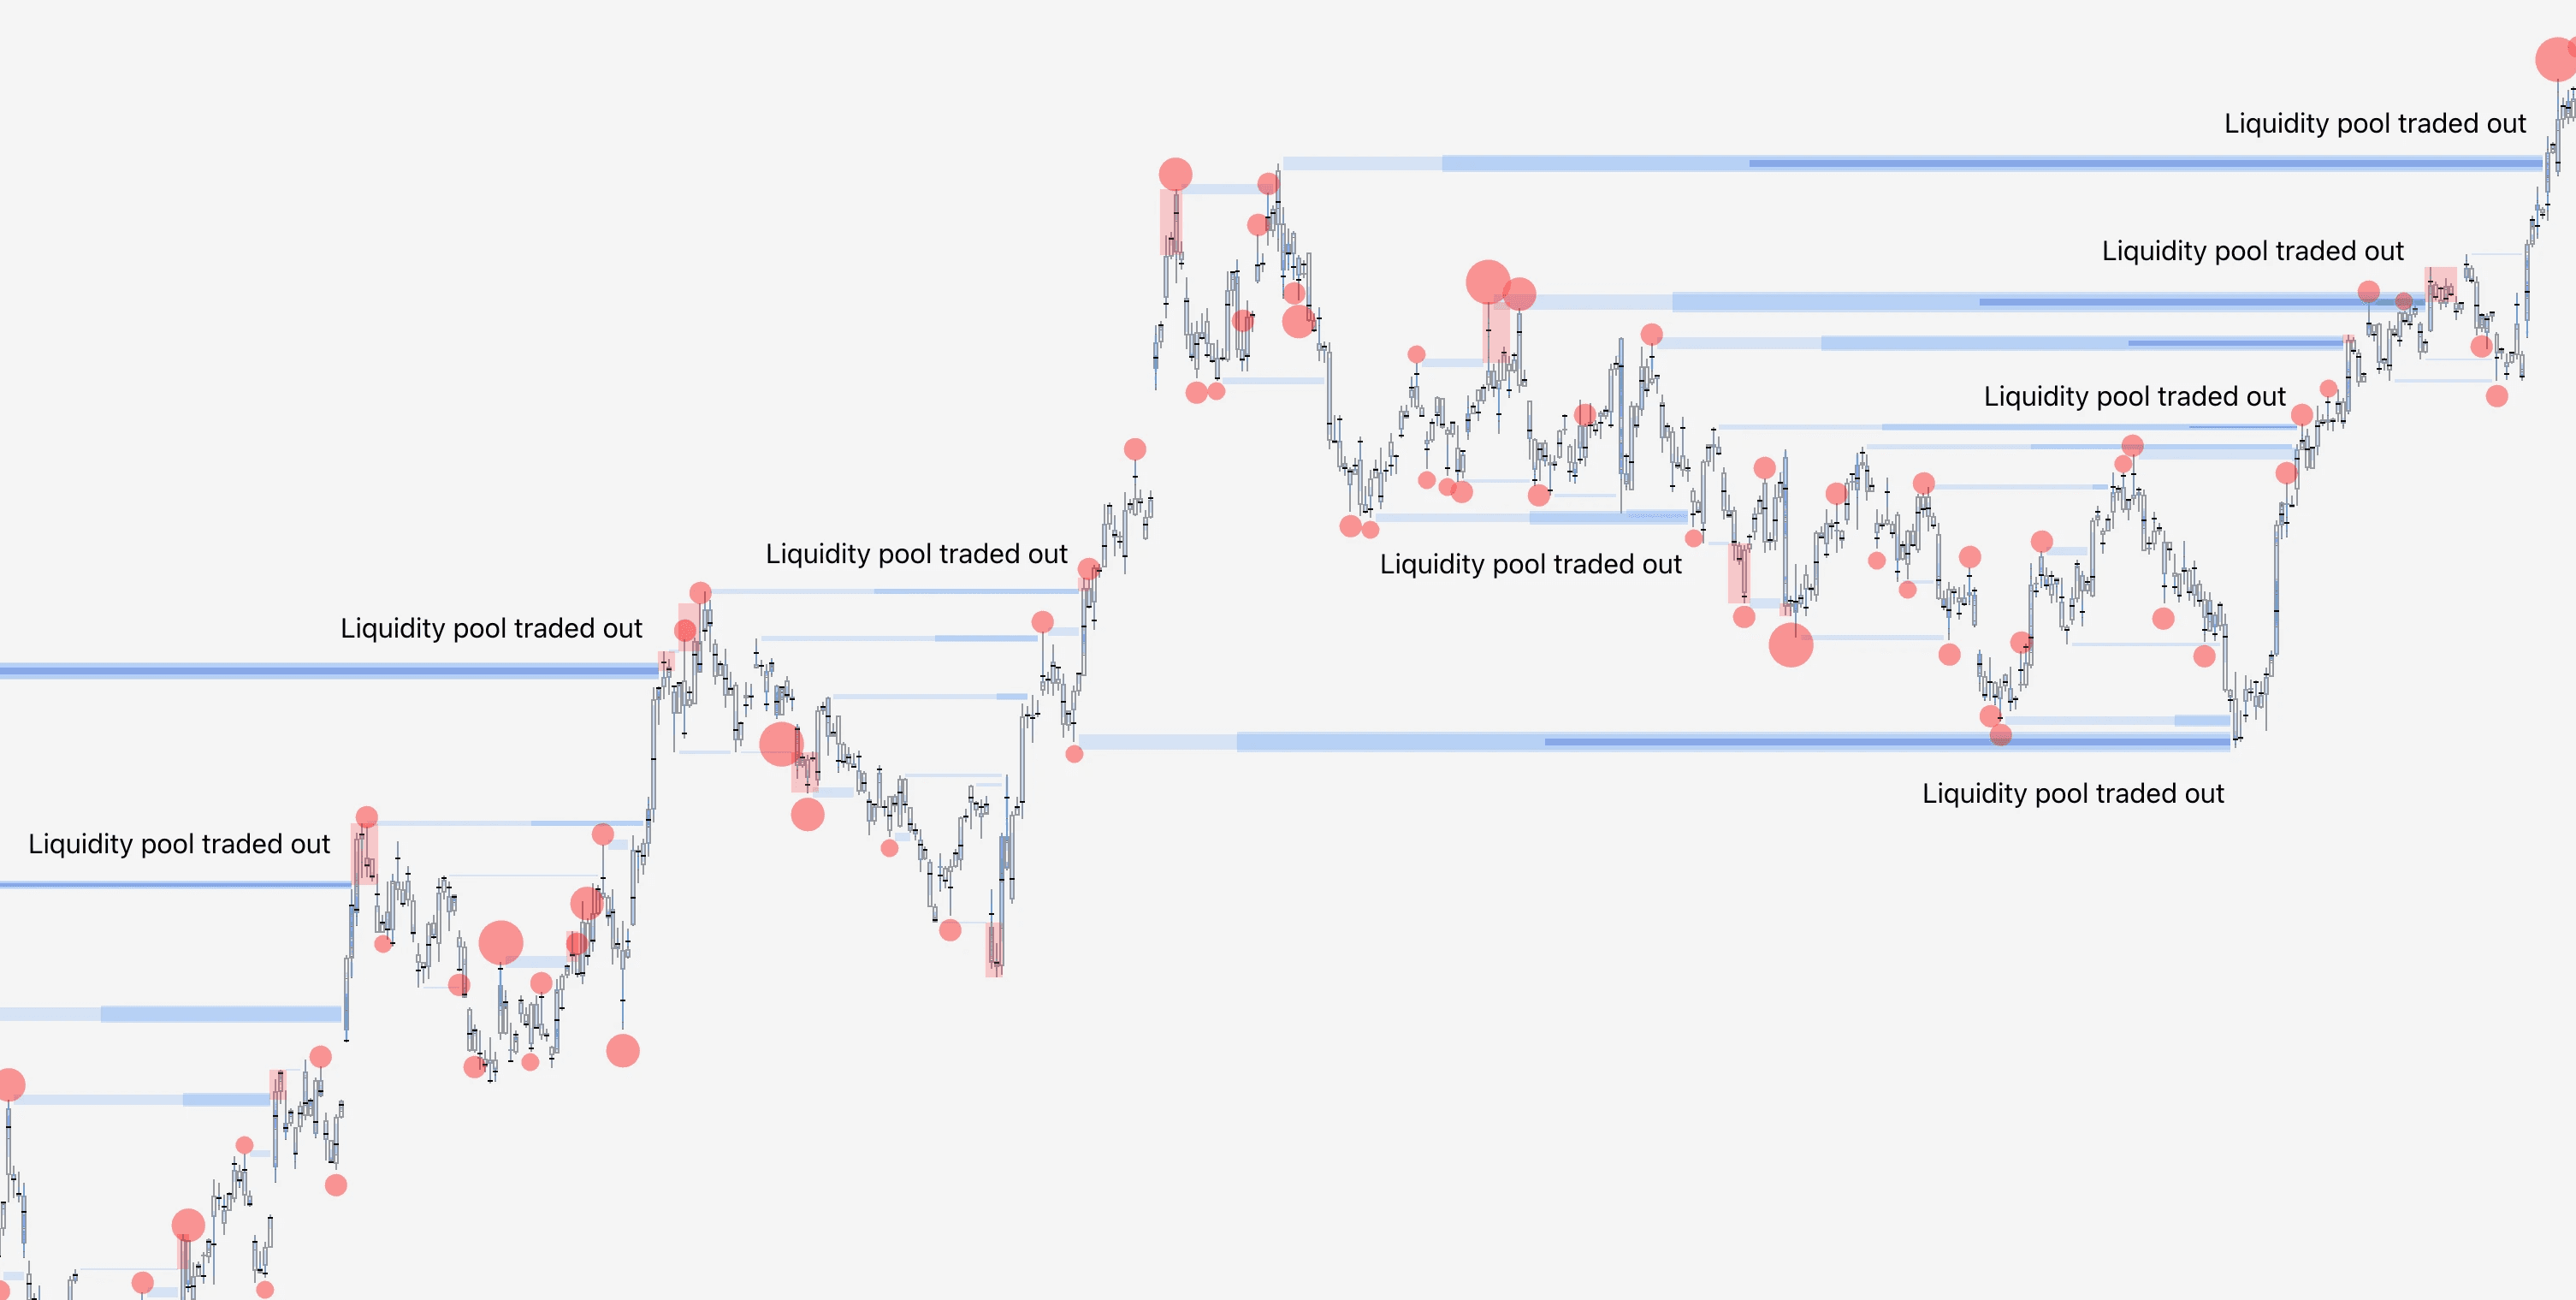
Liquidity Heatmap in SubFlow Terminal
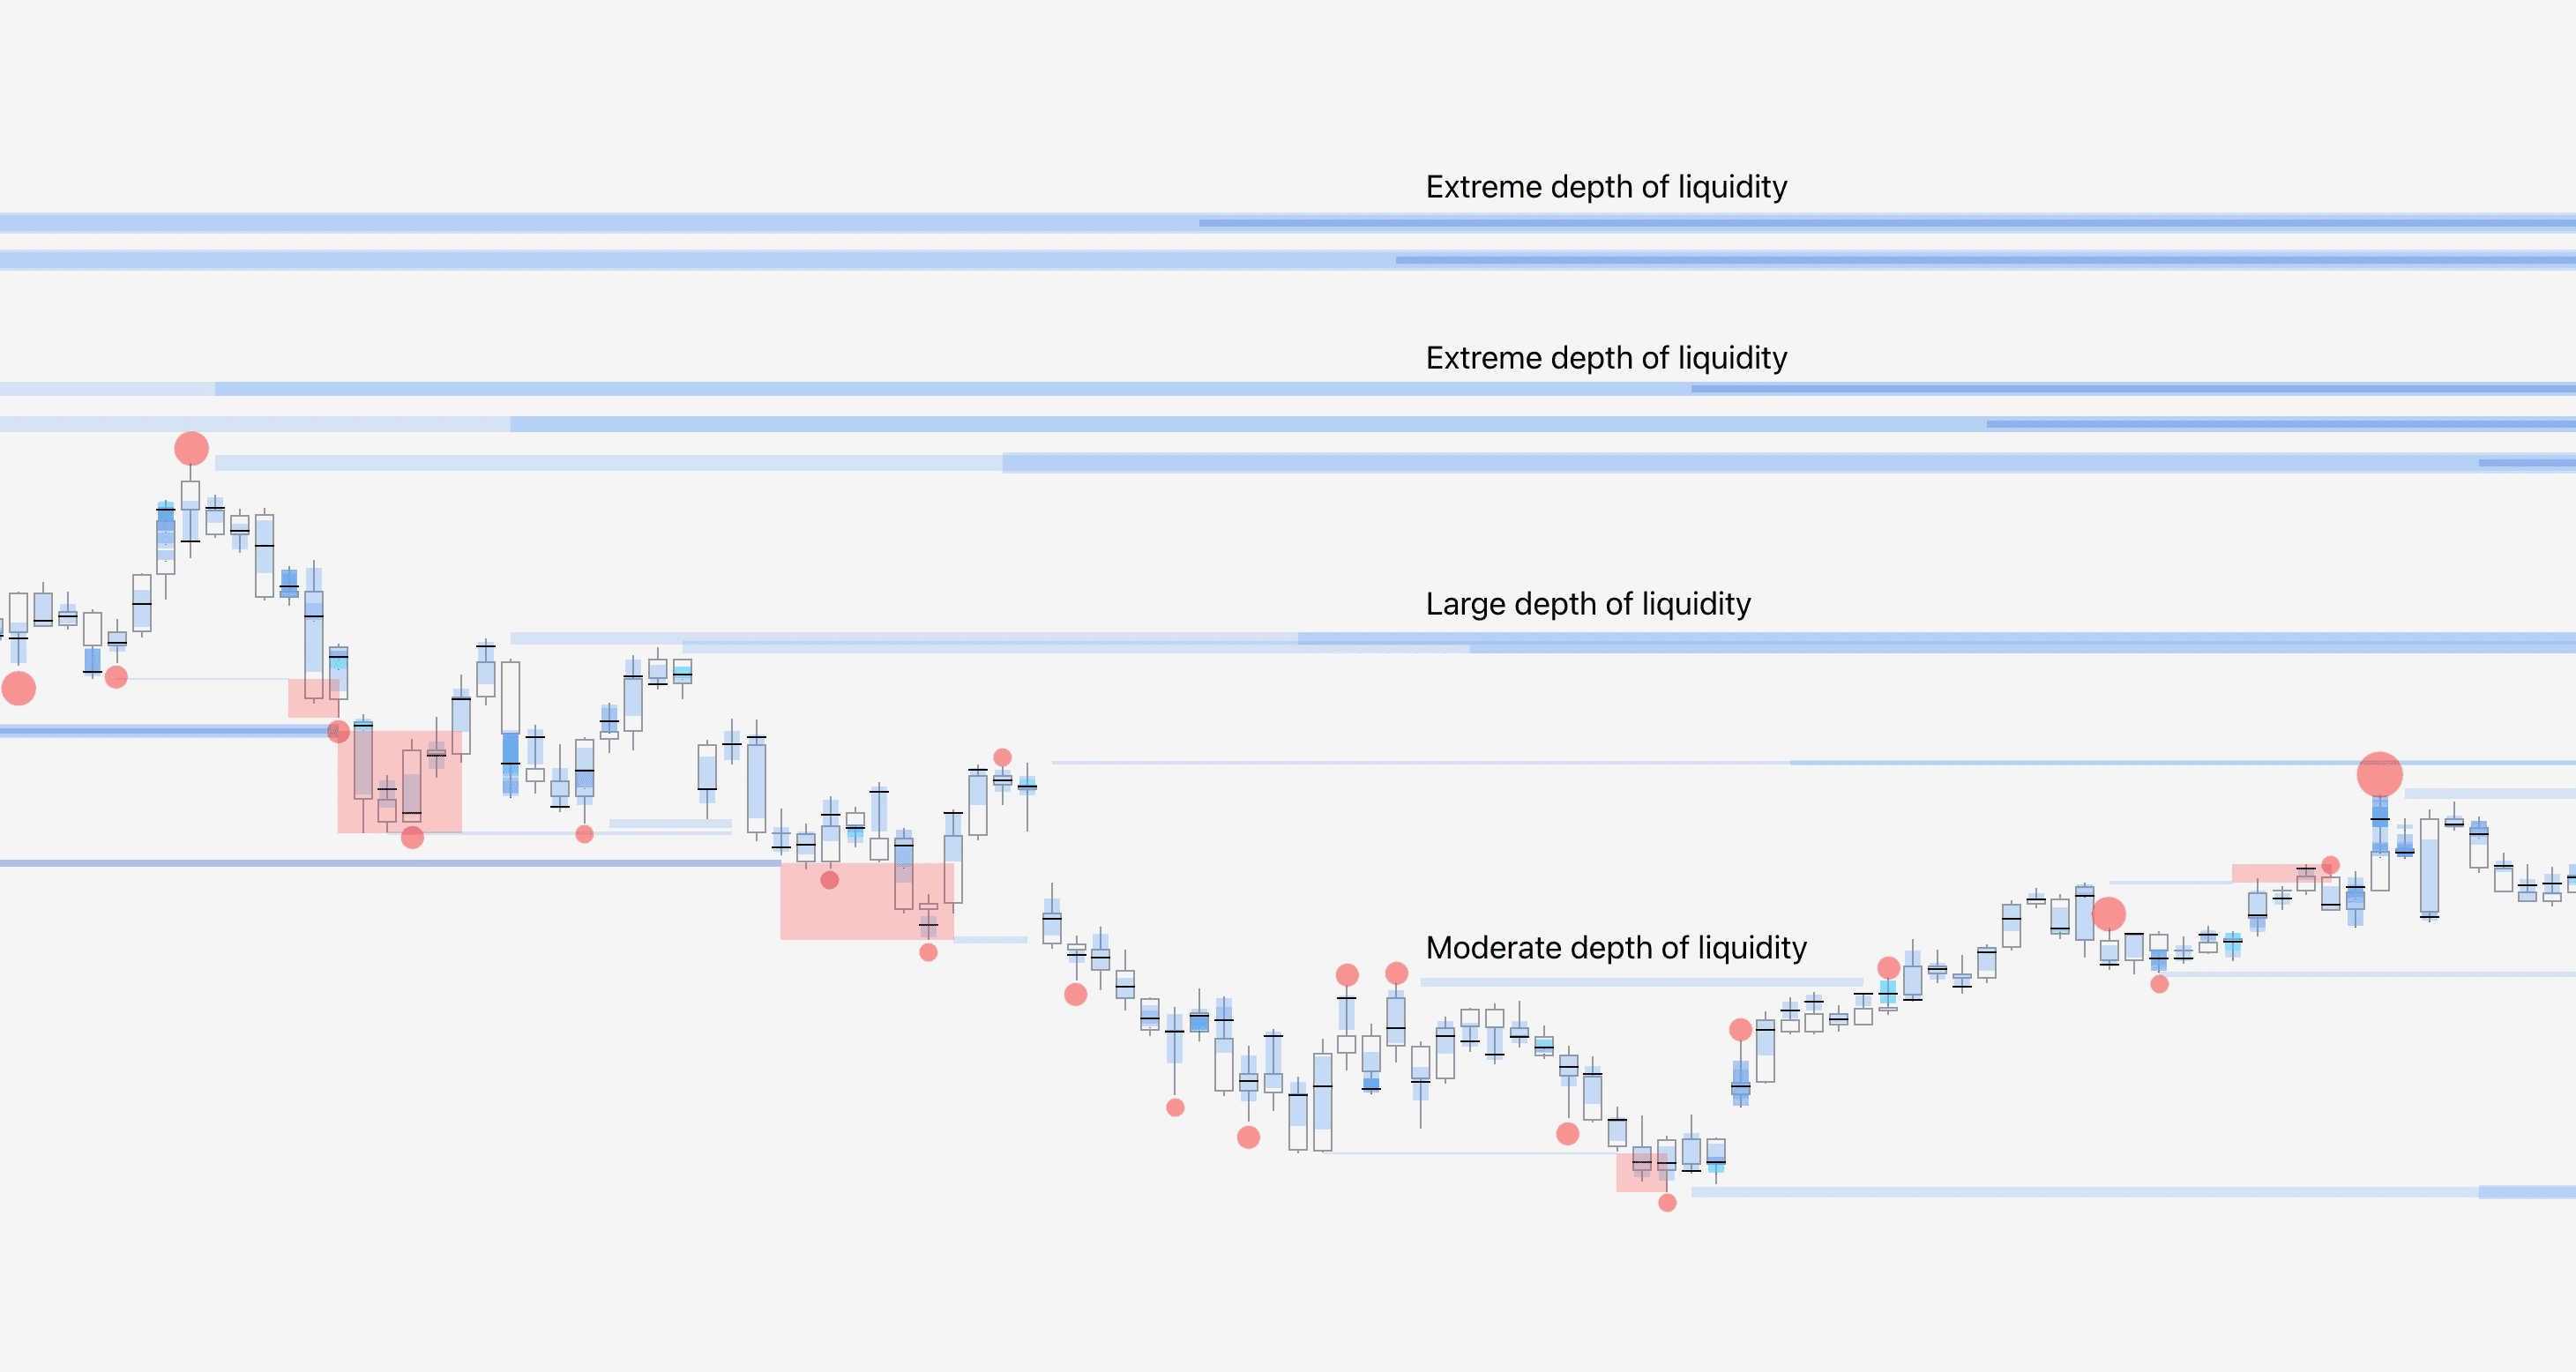
SubFlow Terminal is built to detect only deep liquidity where price is likely to find resistance.
When a liquidity pool is detected by the algorithm, SubFlow Terminal estimates its depth using volume traded at the time pool was detected.
The larger the line and brighter the color, the deeper the liquidity. Depth of liquidity can also be gauged by looking for multiple lines close to each other.
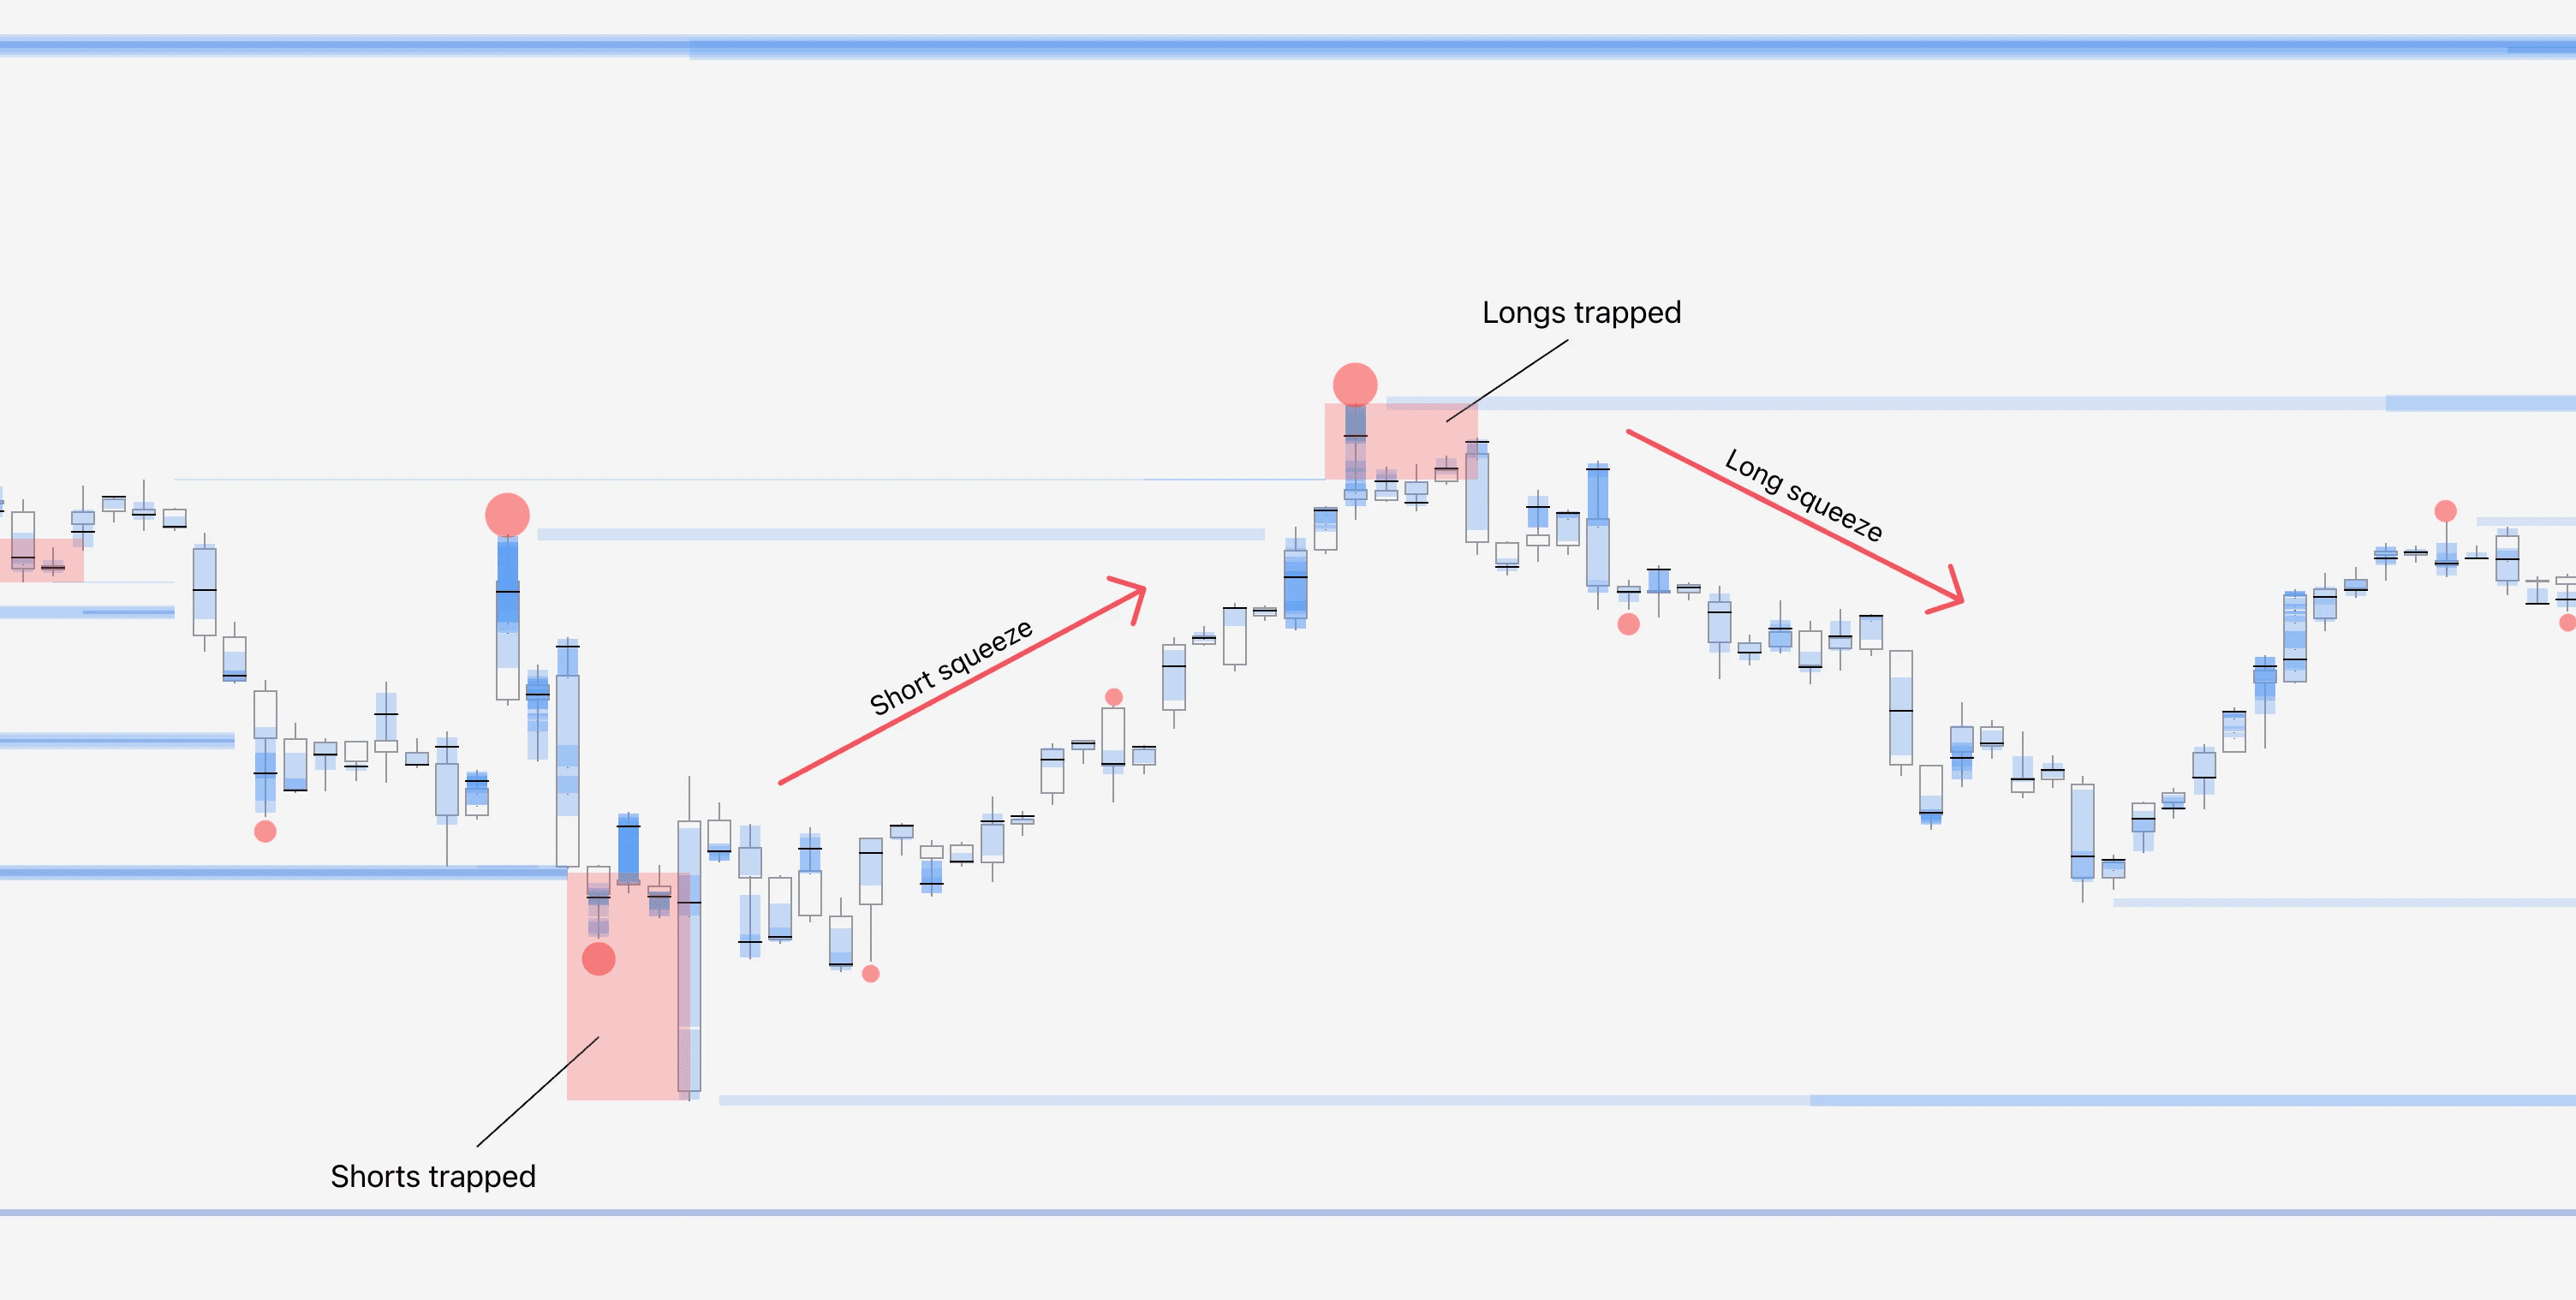
The red boxes represent manipulation events, where traders buying or selling into a liquidity pool get trapped in a losing position once smarter players drive price back inside the pool.
Liquidity Heatmap in SubFlow Terminal
SubFlow Terminal is built to detect only deep liquidity where price is likely to find resistance.
When a liquidity pool is detected by the algorithm, SubFlow Terminal estimates its depth using volume traded at the time pool was detected.
The larger the line and brighter the color, the deeper the liquidity. Depth of liquidity can also be gauged by looking for multiple lines close to each other.
The red boxes represent manipulation events, where traders buying or selling into a liquidity pool get trapped in a losing position once smarter players drive price back inside the pool.
How to trade Liquidity Heatmap
Liquidity Heatmap is great for identifying where price is attracted to like a magnet, liquidity is almost always traded out sooner or later. This is great for identifying price targets for trades.
Sweep of pools also create a window of opportunity for a reversal/halt in price, as price struggles to move forward. This is great for reversal trades.
Manipulation events are even better for reversals, as the trapped traders potentially get squeezed out of their positions and fuel the rally further.
That's just a few examples on how to trade Liquidity Heatmap in SubFlow Terminal. Find more examples in these playbooks 👇
Mentioned in this section
Dive deeper into topics mentioned
Mentioned in this section
Dive deeper into topics mentioned


You're deep in like liquidity 💪
Liquidity is one of the most fundamental core concepts of orderflow trading. When visualized with a heatmap, we can see in advance where price will likely struggle to move forward.
You're almost there! Take a break, get some coffee and tackle rest of the lessons 👇
You're deep in like liquidity 💪
Liquidity is one of the most fundamental core concepts of orderflow trading. When visualized with a heatmap, we can see in advance where price will likely struggle to move forward.
You're almost there! Take a break, get some coffee and tackle rest of the lessons 👇