Internal Flow in SubFlow Terminal
Internal Flow shines an X-ray vision, revealing unusual volume activity and aggressive large trades developing inside candles.
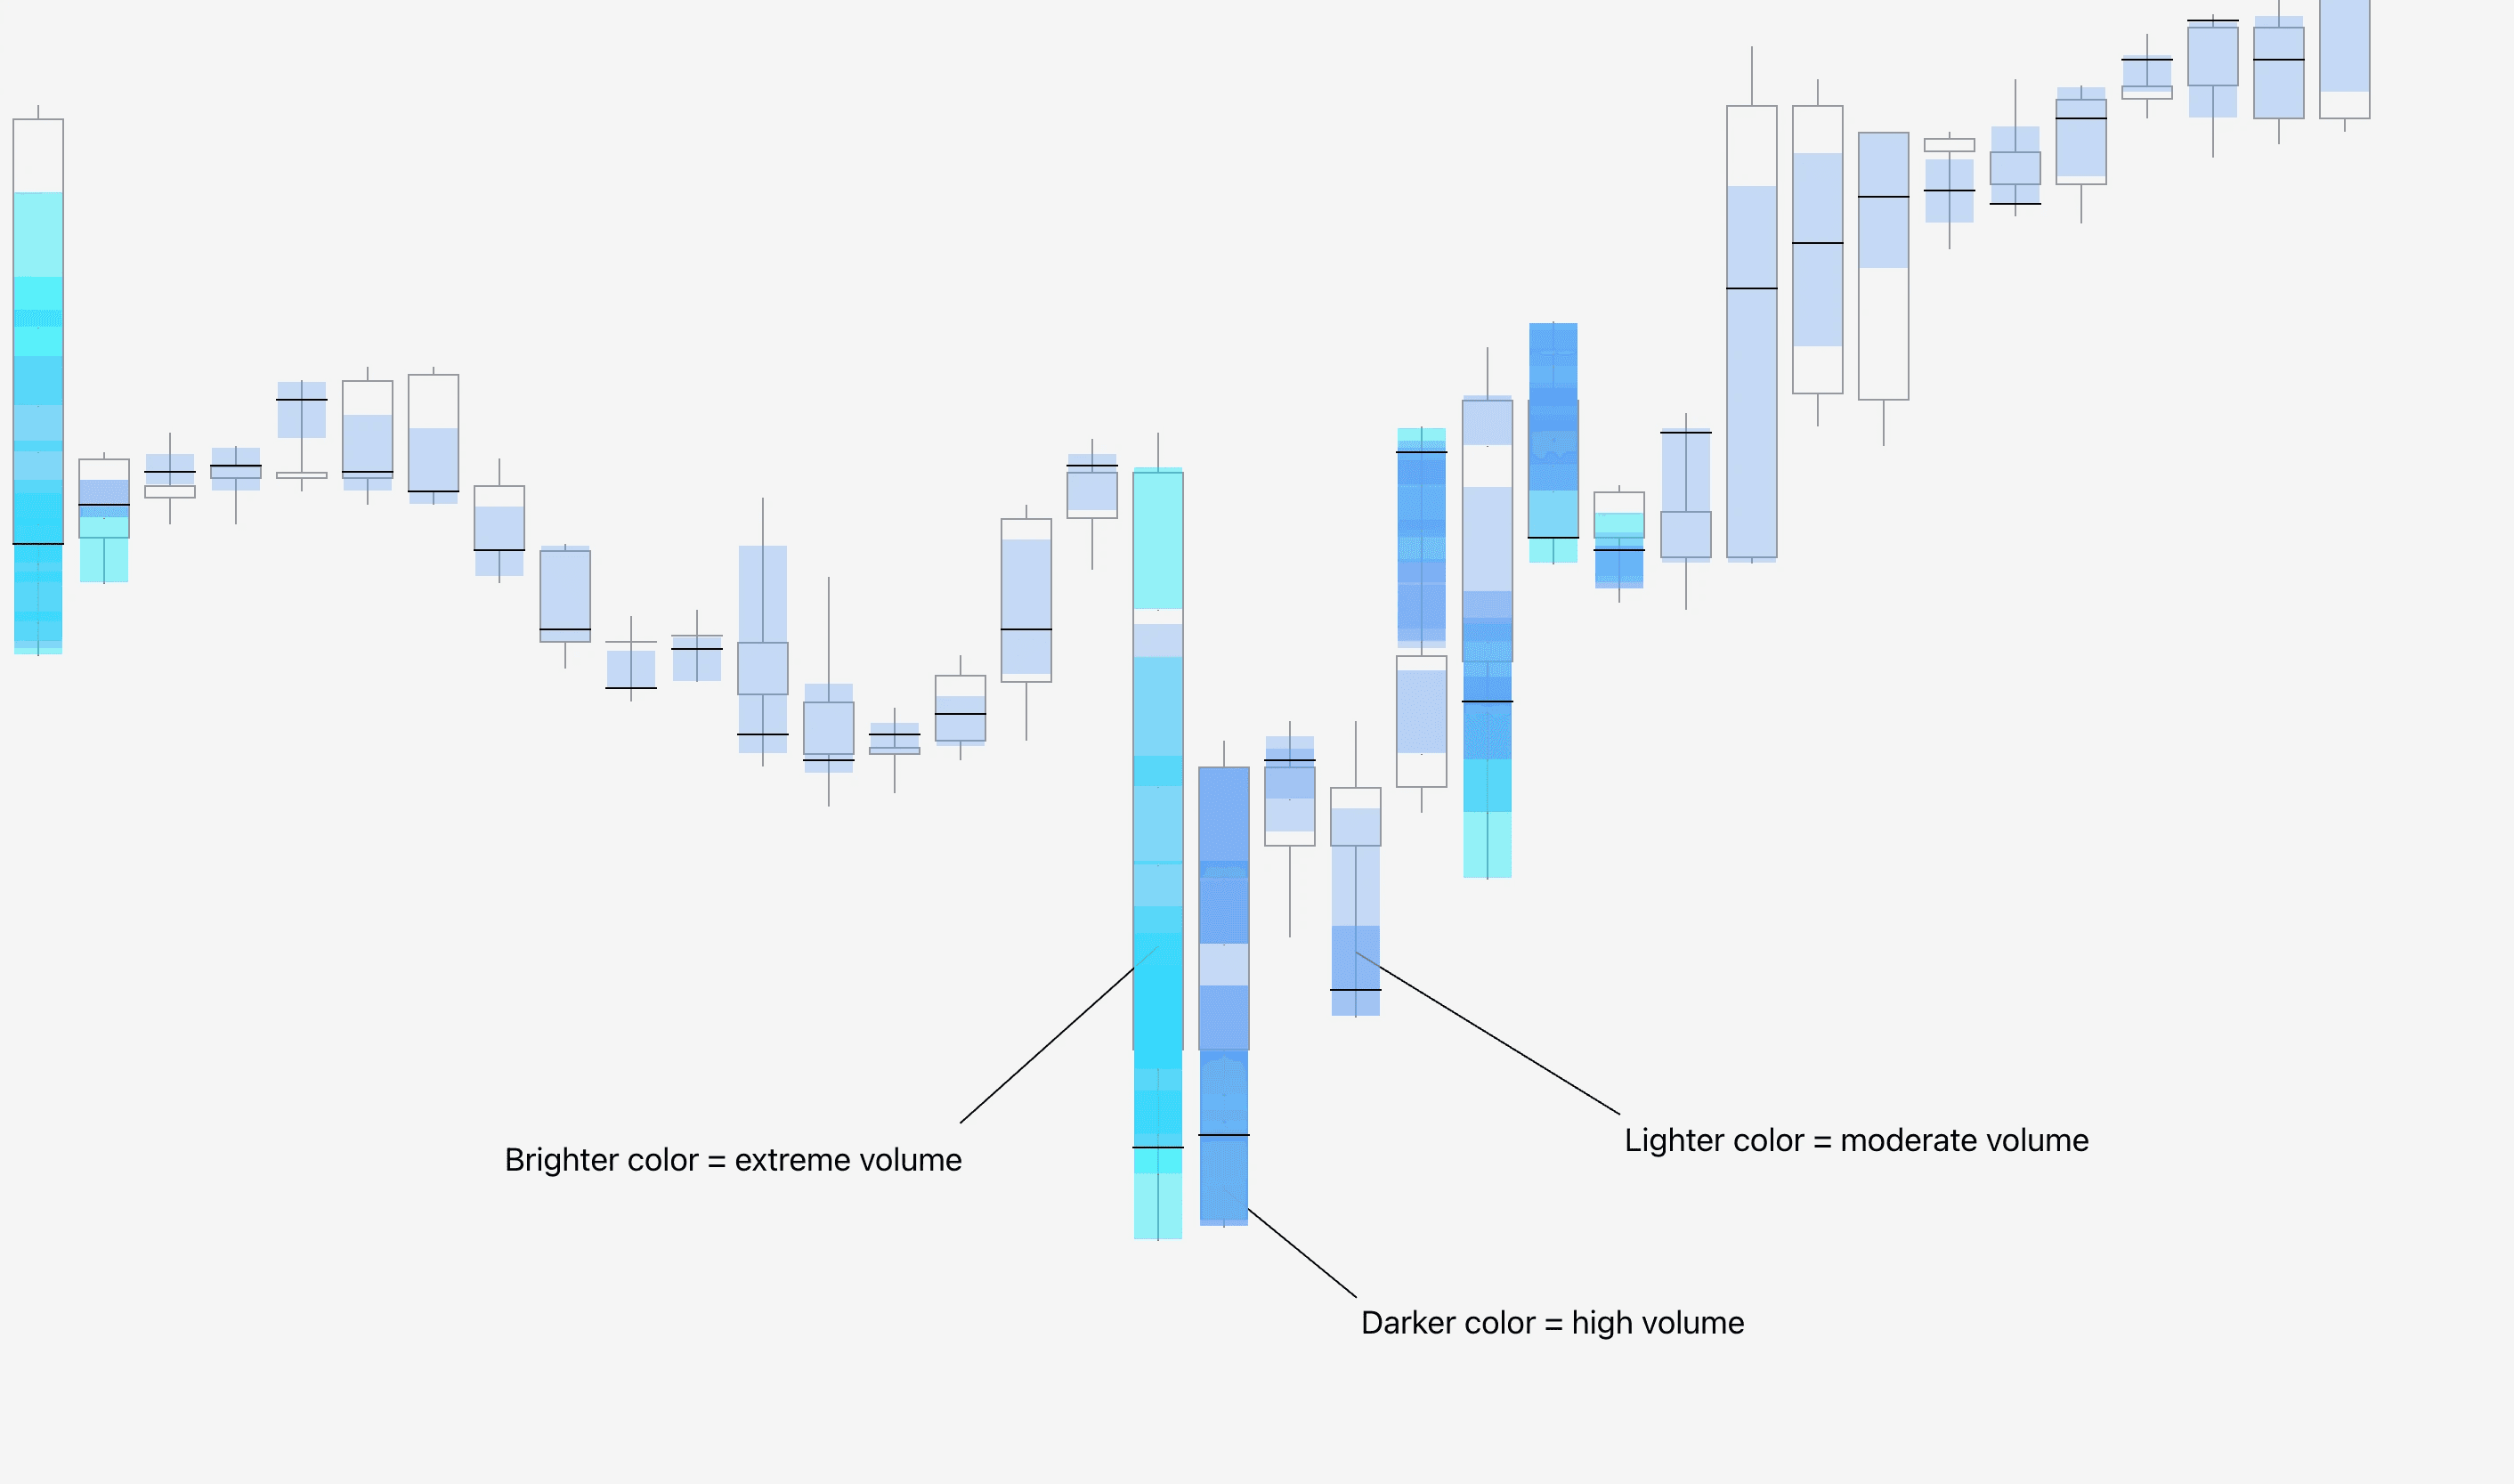
Internal Flow is visualized in an intuitive heatmap style. Brighter colors correspond to higher, more extreme volume.
In this example we can see how moderate, high and extreme volumes are visualized.
Aggressive trading positions exposed
Similarly to Value Area and Point of Control, Internal Flow gives us information about positioning of traders.
Key difference between the two is that instead of revealing where majority of trading interest is located, Internal Flow reveals where aggressive, high value trades are developing.
Internal Flow in SubFlow Terminal
Internal Flow shines an X-ray vision, revealing unusual volume activity and aggressive large trades developing inside candles.
Internal Flow is visualized in an intuitive heatmap style. Brighter colors correspond to higher, more extreme volume.
In this example we can see how moderate, high and extreme volumes are visualized.
Aggressive trading positions exposed
Similarly to Value Area and Point of Control, Internal Flow gives us information about positioning of traders.
Key difference between the two is that instead of revealing where majority of trading interest is located, Internal Flow reveals where aggressive, high value trades are developing.
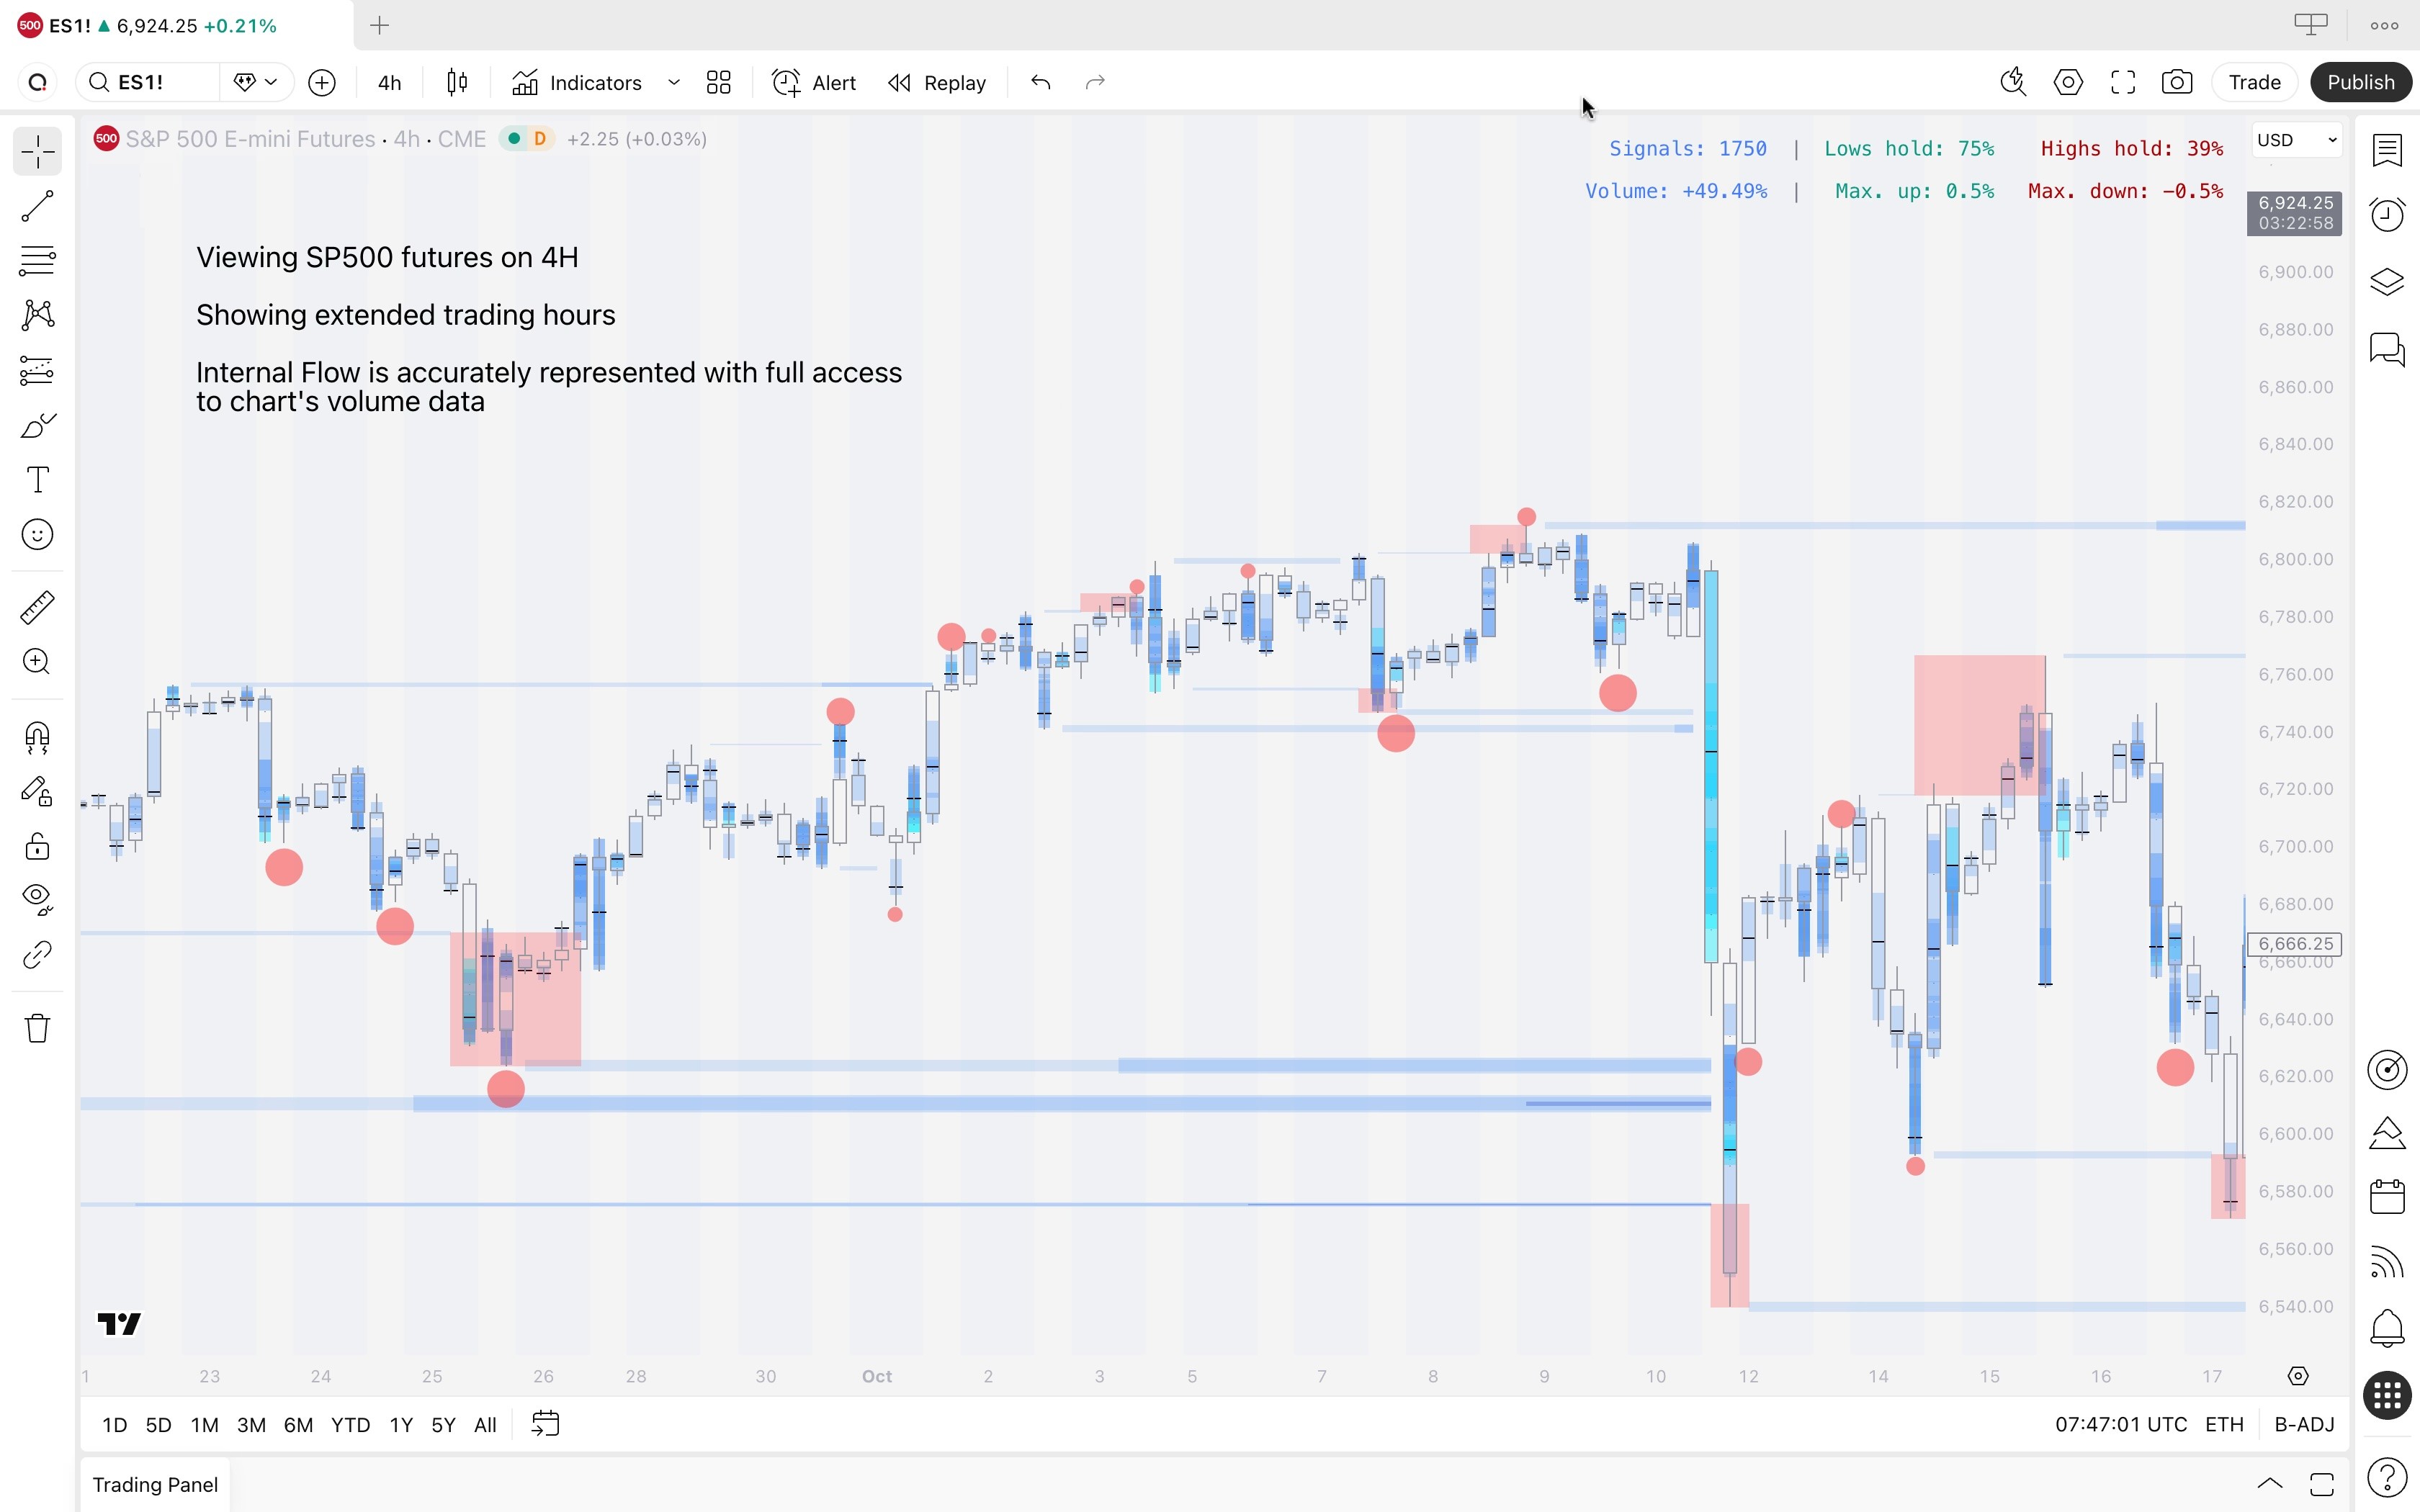
Internal Flow in stock market
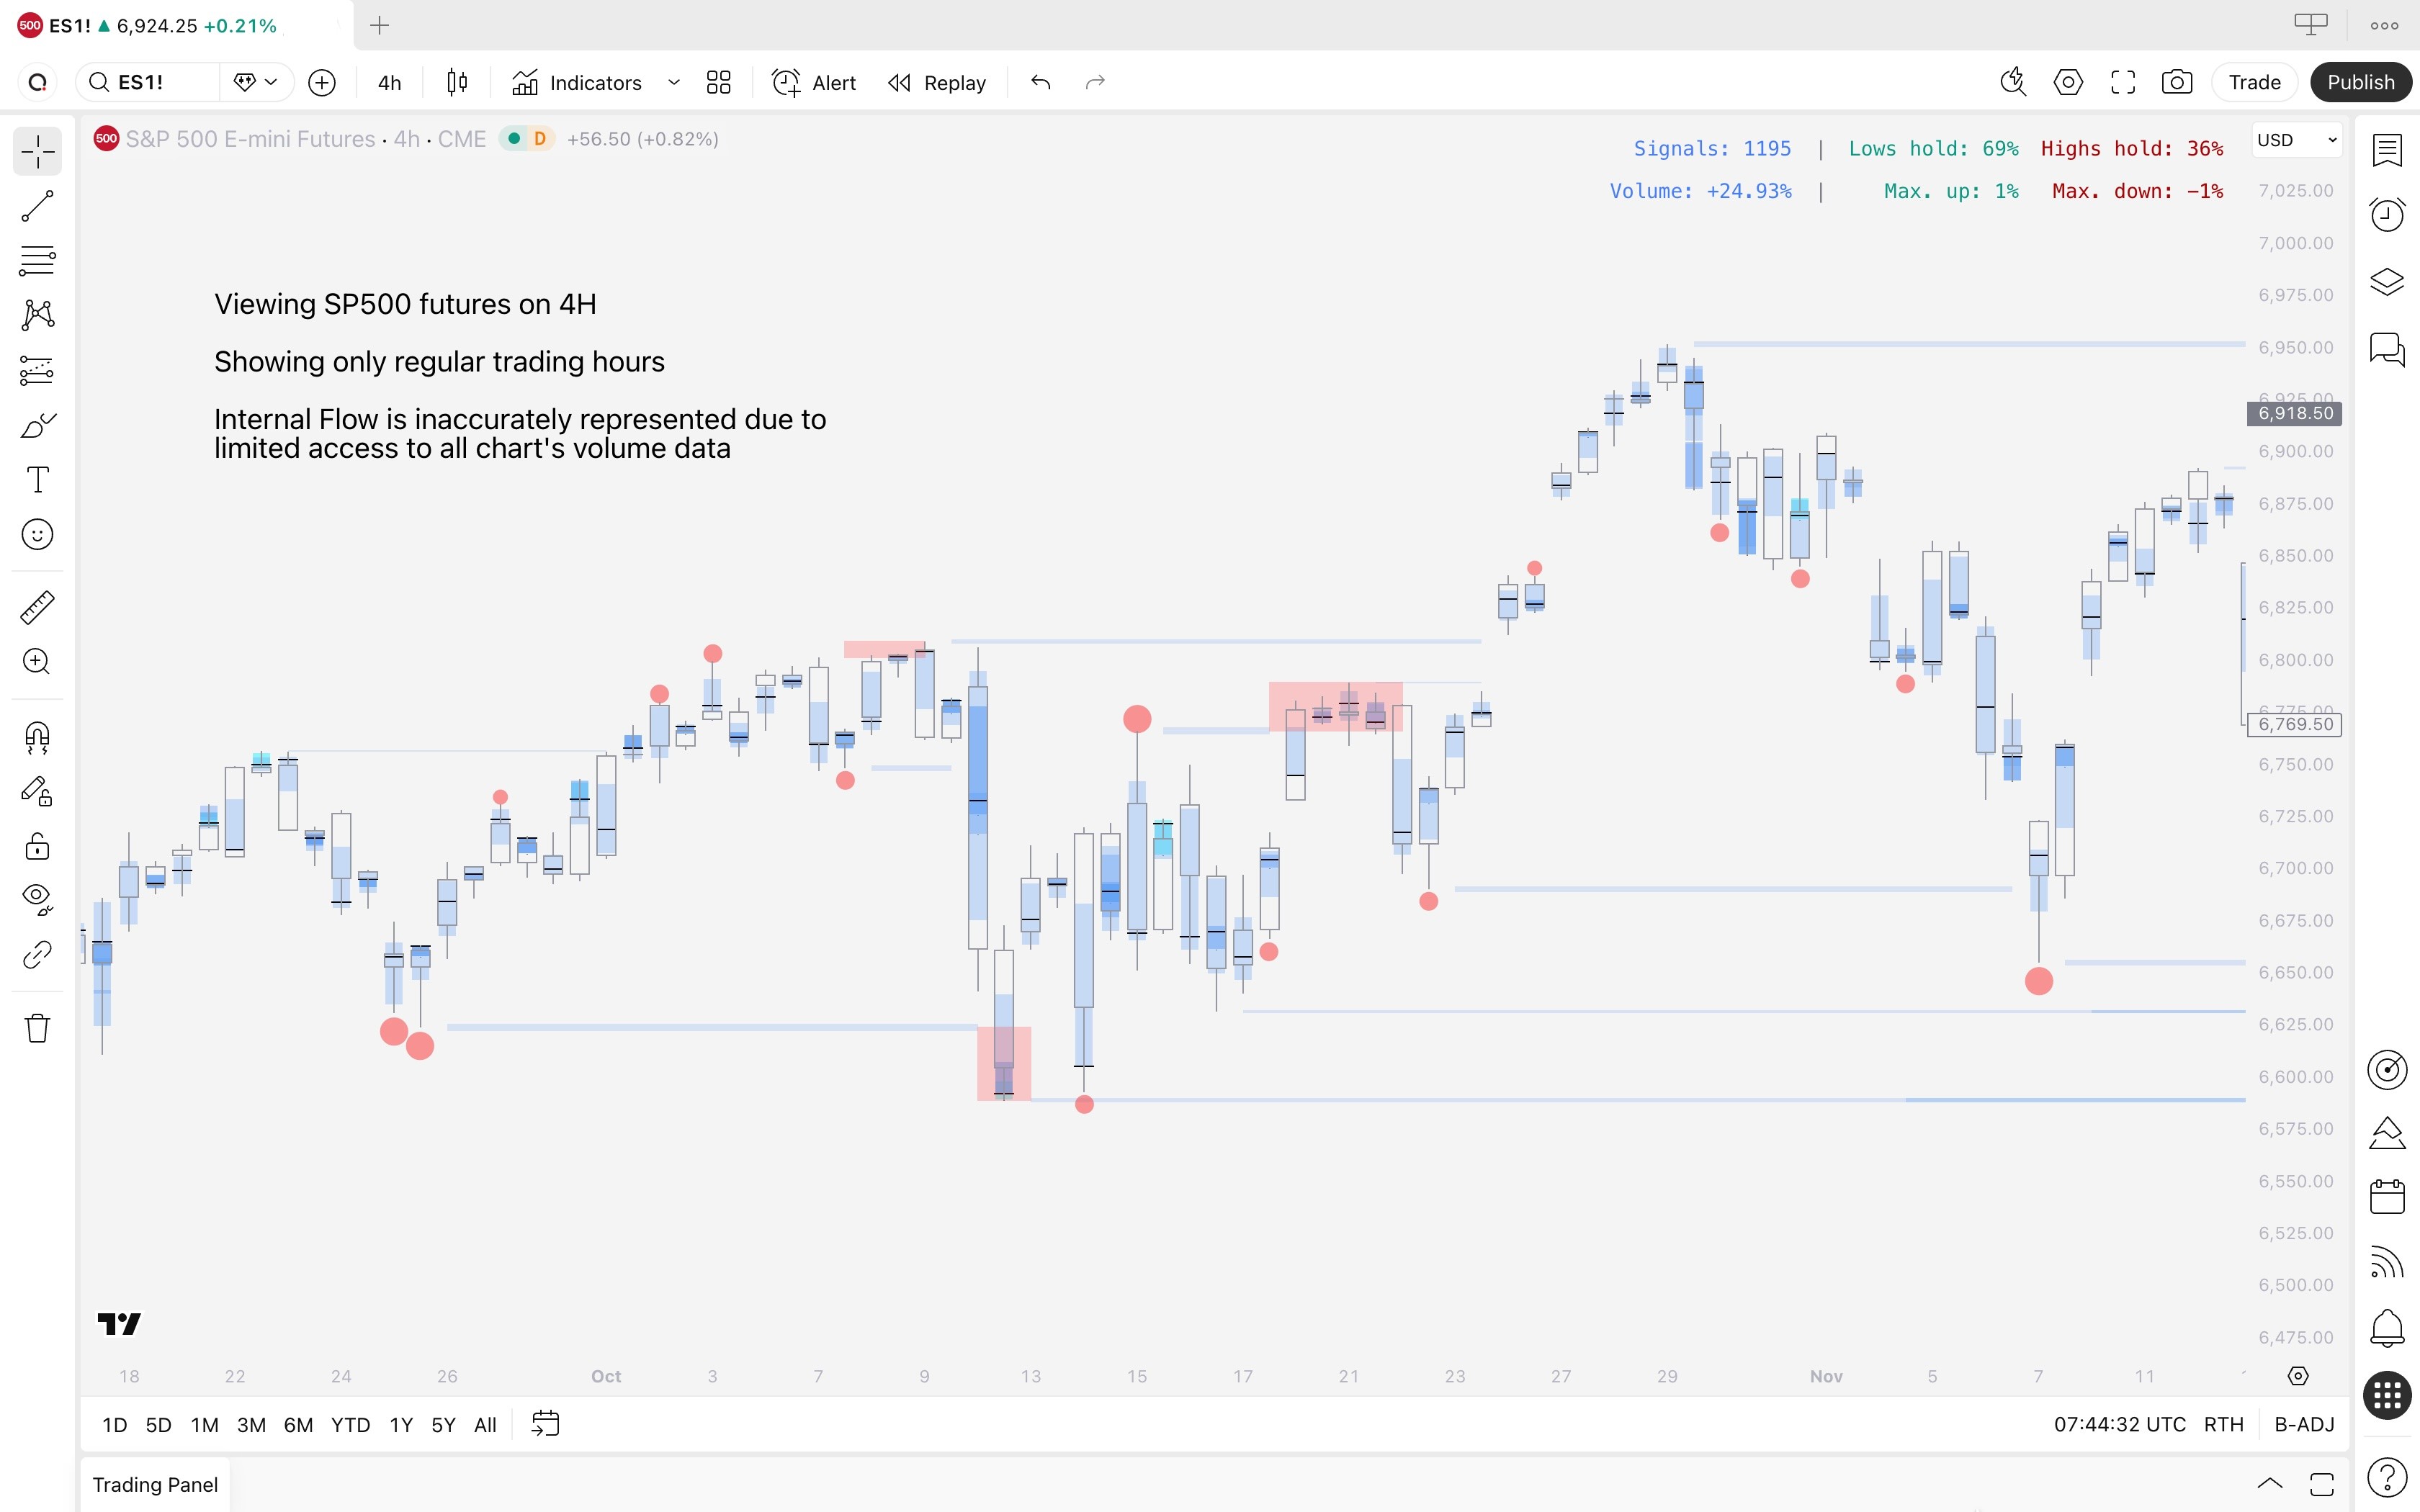
By default, TradingView displays stock market charts only for regular trading hours (when stock market is open).
This means Internal Flow will not have access to all volume data available beyond regular trading hours to determine what "unusual volume" means.
On lower timeframe charts, this leads to sparse and inaccurate data.
Switching to electronic trading hours
Internal Flow will work properly once we switch "Regular trading hours" to "Electronic trading hours" on TradingView's chart settings.
Open any stock chart, right click canvas and select Settings
Navigate to "Data modification" under Symbol tab
Select "Electronic trading hours"
Click "Ok"
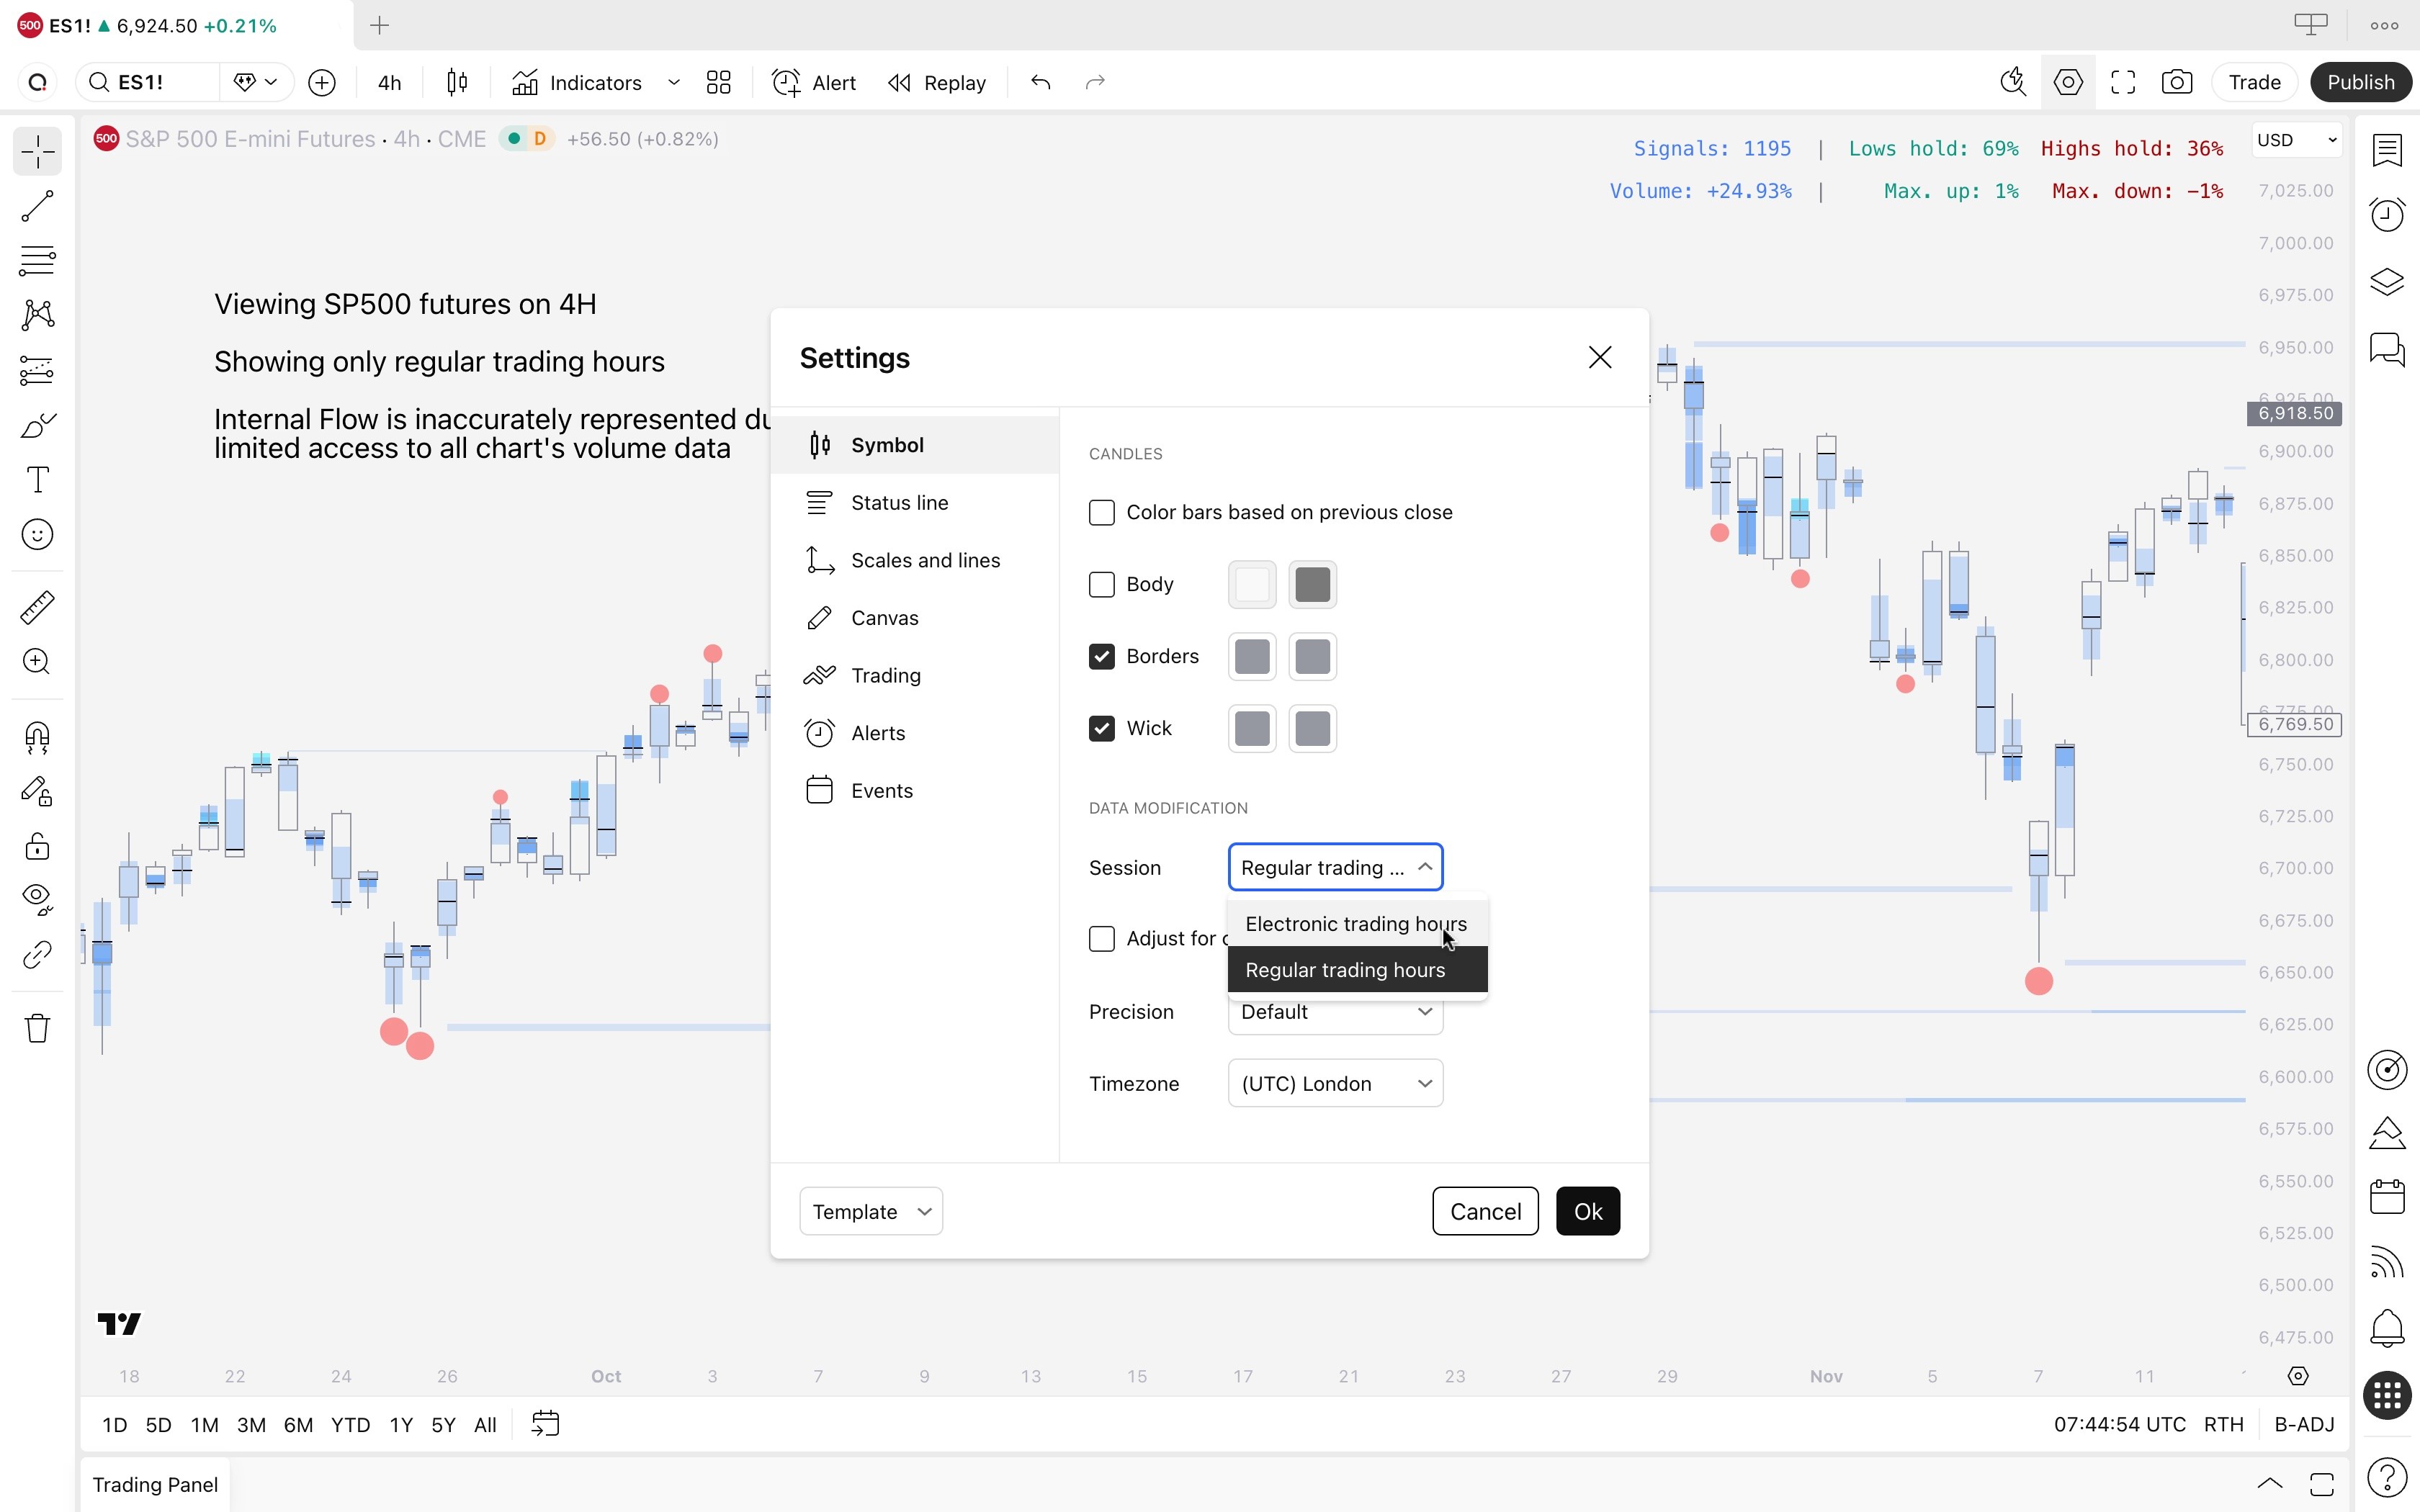
Internal Flow now has access to all volume data on the stock market chart and is represented accurately.
Internal Flow in stock market
By default, TradingView displays stock market charts only for regular trading hours (when stock market is open).
This means Internal Flow will not have access to all volume data available beyond regular trading hours to determine what "unusual volume" means.
On lower timeframe charts, this leads to sparse and inaccurate data.
Switching to electronic trading hours
Internal Flow will work properly once we switch "Regular trading hours" to "Electronic trading hours" on TradingView's chart settings.
Open any stock chart, right click canvas and select Settings
Navigate to "Data modification" under Symbol tab
Select "Electronic trading hours"
Click "Ok"
Internal Flow now has access to all volume data on the stock market chart and is represented accurately.
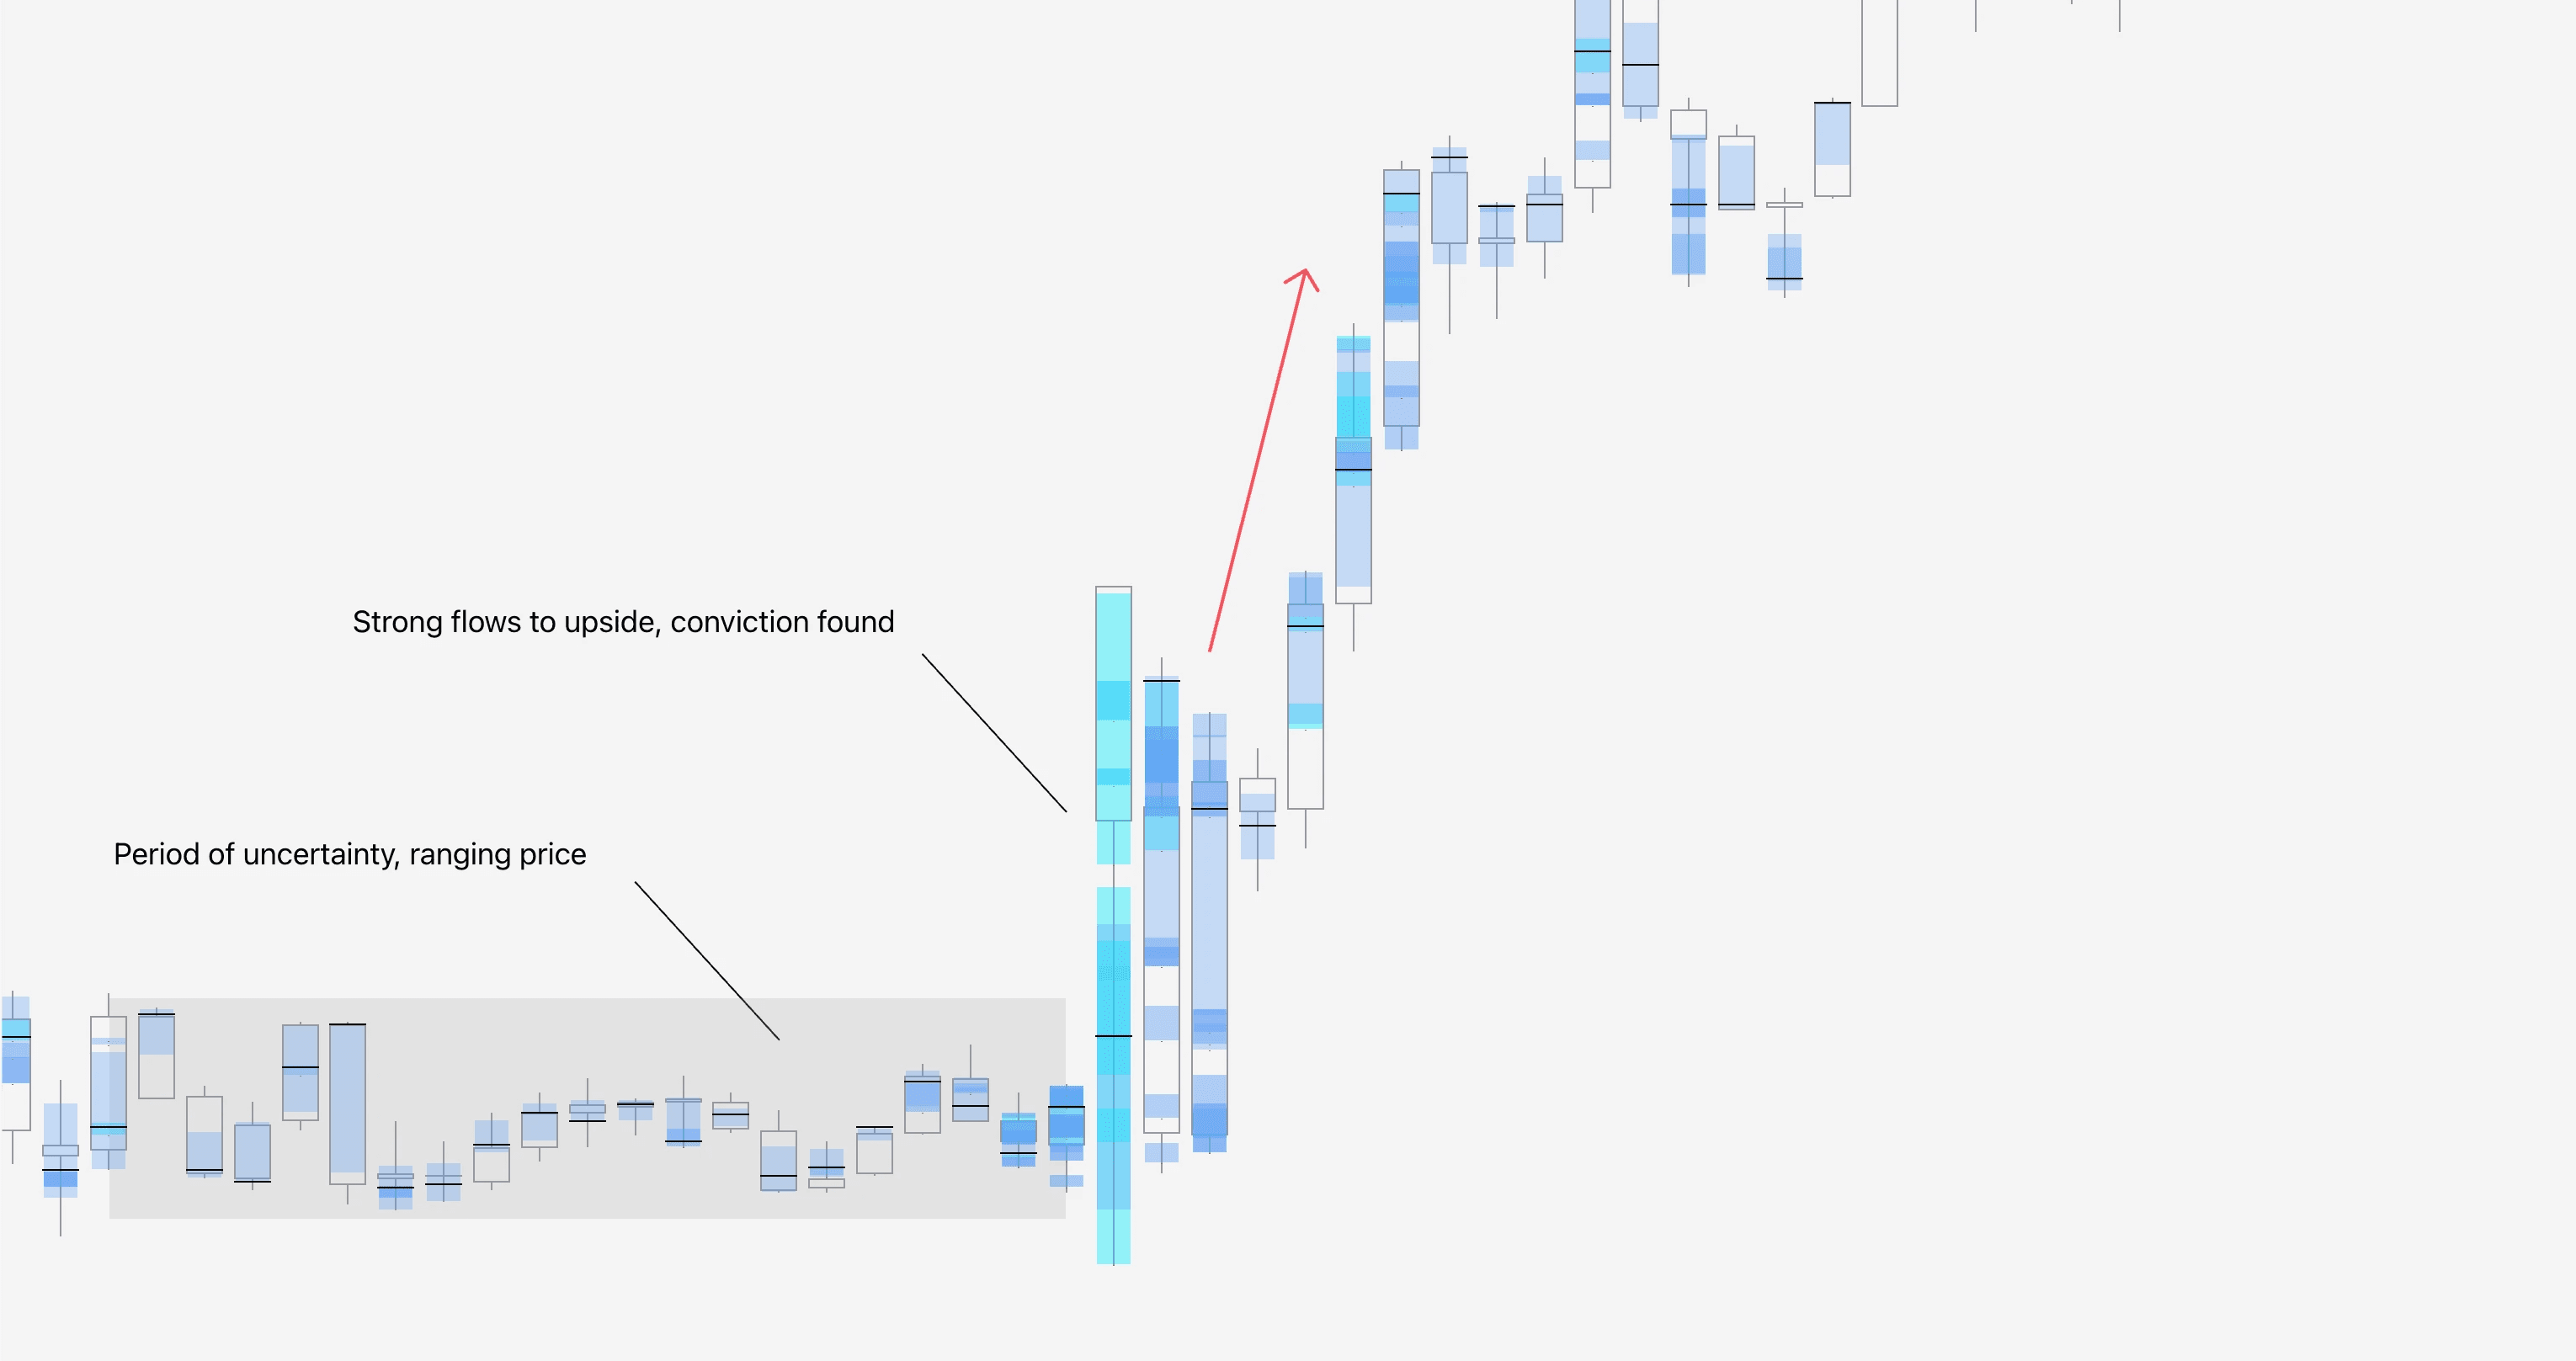
How to trade Internal Flow
When we evaluate Internal Flow with the context of price action, we can detect hidden insights such as where traders were likely liquidated, selling in extreme fear or buying in extreme greed. The dumb money, if you will.
However, Internal Flow can also be used to identify how more informed players have positioned - the smart money.
Consolidating price followed by a sudden move up or down with aggressive flows can indicate strong conviction found after uncertainty in the markets, marking a beginning of a new trend.
That's just one example of trading with Internal Flow. Find more in these playbooks 👇
Mentioned in this section
Dive deeper into topics mentioned
Mentioned in this section
Dive deeper into topics mentioned


You're flowing through the lessons 💪
Internal Flow is fairly easy to understand and identify, the brighter the color, the more extreme activity is taking place inside the candle.
By combining this with price action, we get lots of valuable clues for identifying what the dumb and smart money are doing.
Invest a bit more time to learn how all the other parts move under the hood 👇