AI summary
AI summary
AI summary
This guide troubleshoots common issues with SubFlow Terminal, such as timeframe limitation message, memory limit error and incomplete Internal Flow visualization for the stock market.
This guide troubleshoots common issues with SubFlow Terminal, such as timeframe limitation message, memory limit error and incomplete Internal Flow visualization for the stock market.
This guide troubleshoots common issues with SubFlow Terminal, such as timeframe limitation message, memory limit error and incomplete Internal Flow visualization for the stock market.
Resolving common issues
Resolving common issues
Resolving common issues
Learn how to resolve common issues with our TradingView Indicators
Learn how to resolve common issues with our TradingView Indicators
Learn how to resolve common issues with our TradingView Indicators
🤔
🤔
🤔

Flowly Team
Flowly Team
2 min read
2 min read
Share
Limitations on this timeframe notification
This pop-up notification occurs when SubFlow Terminal is used on 1 minute timeframe. Due to TradingView related limitations Intrabar Heatmap, Value Area and POC can only be used on 1 minute timeframe with Premium or higher TradingView plans.
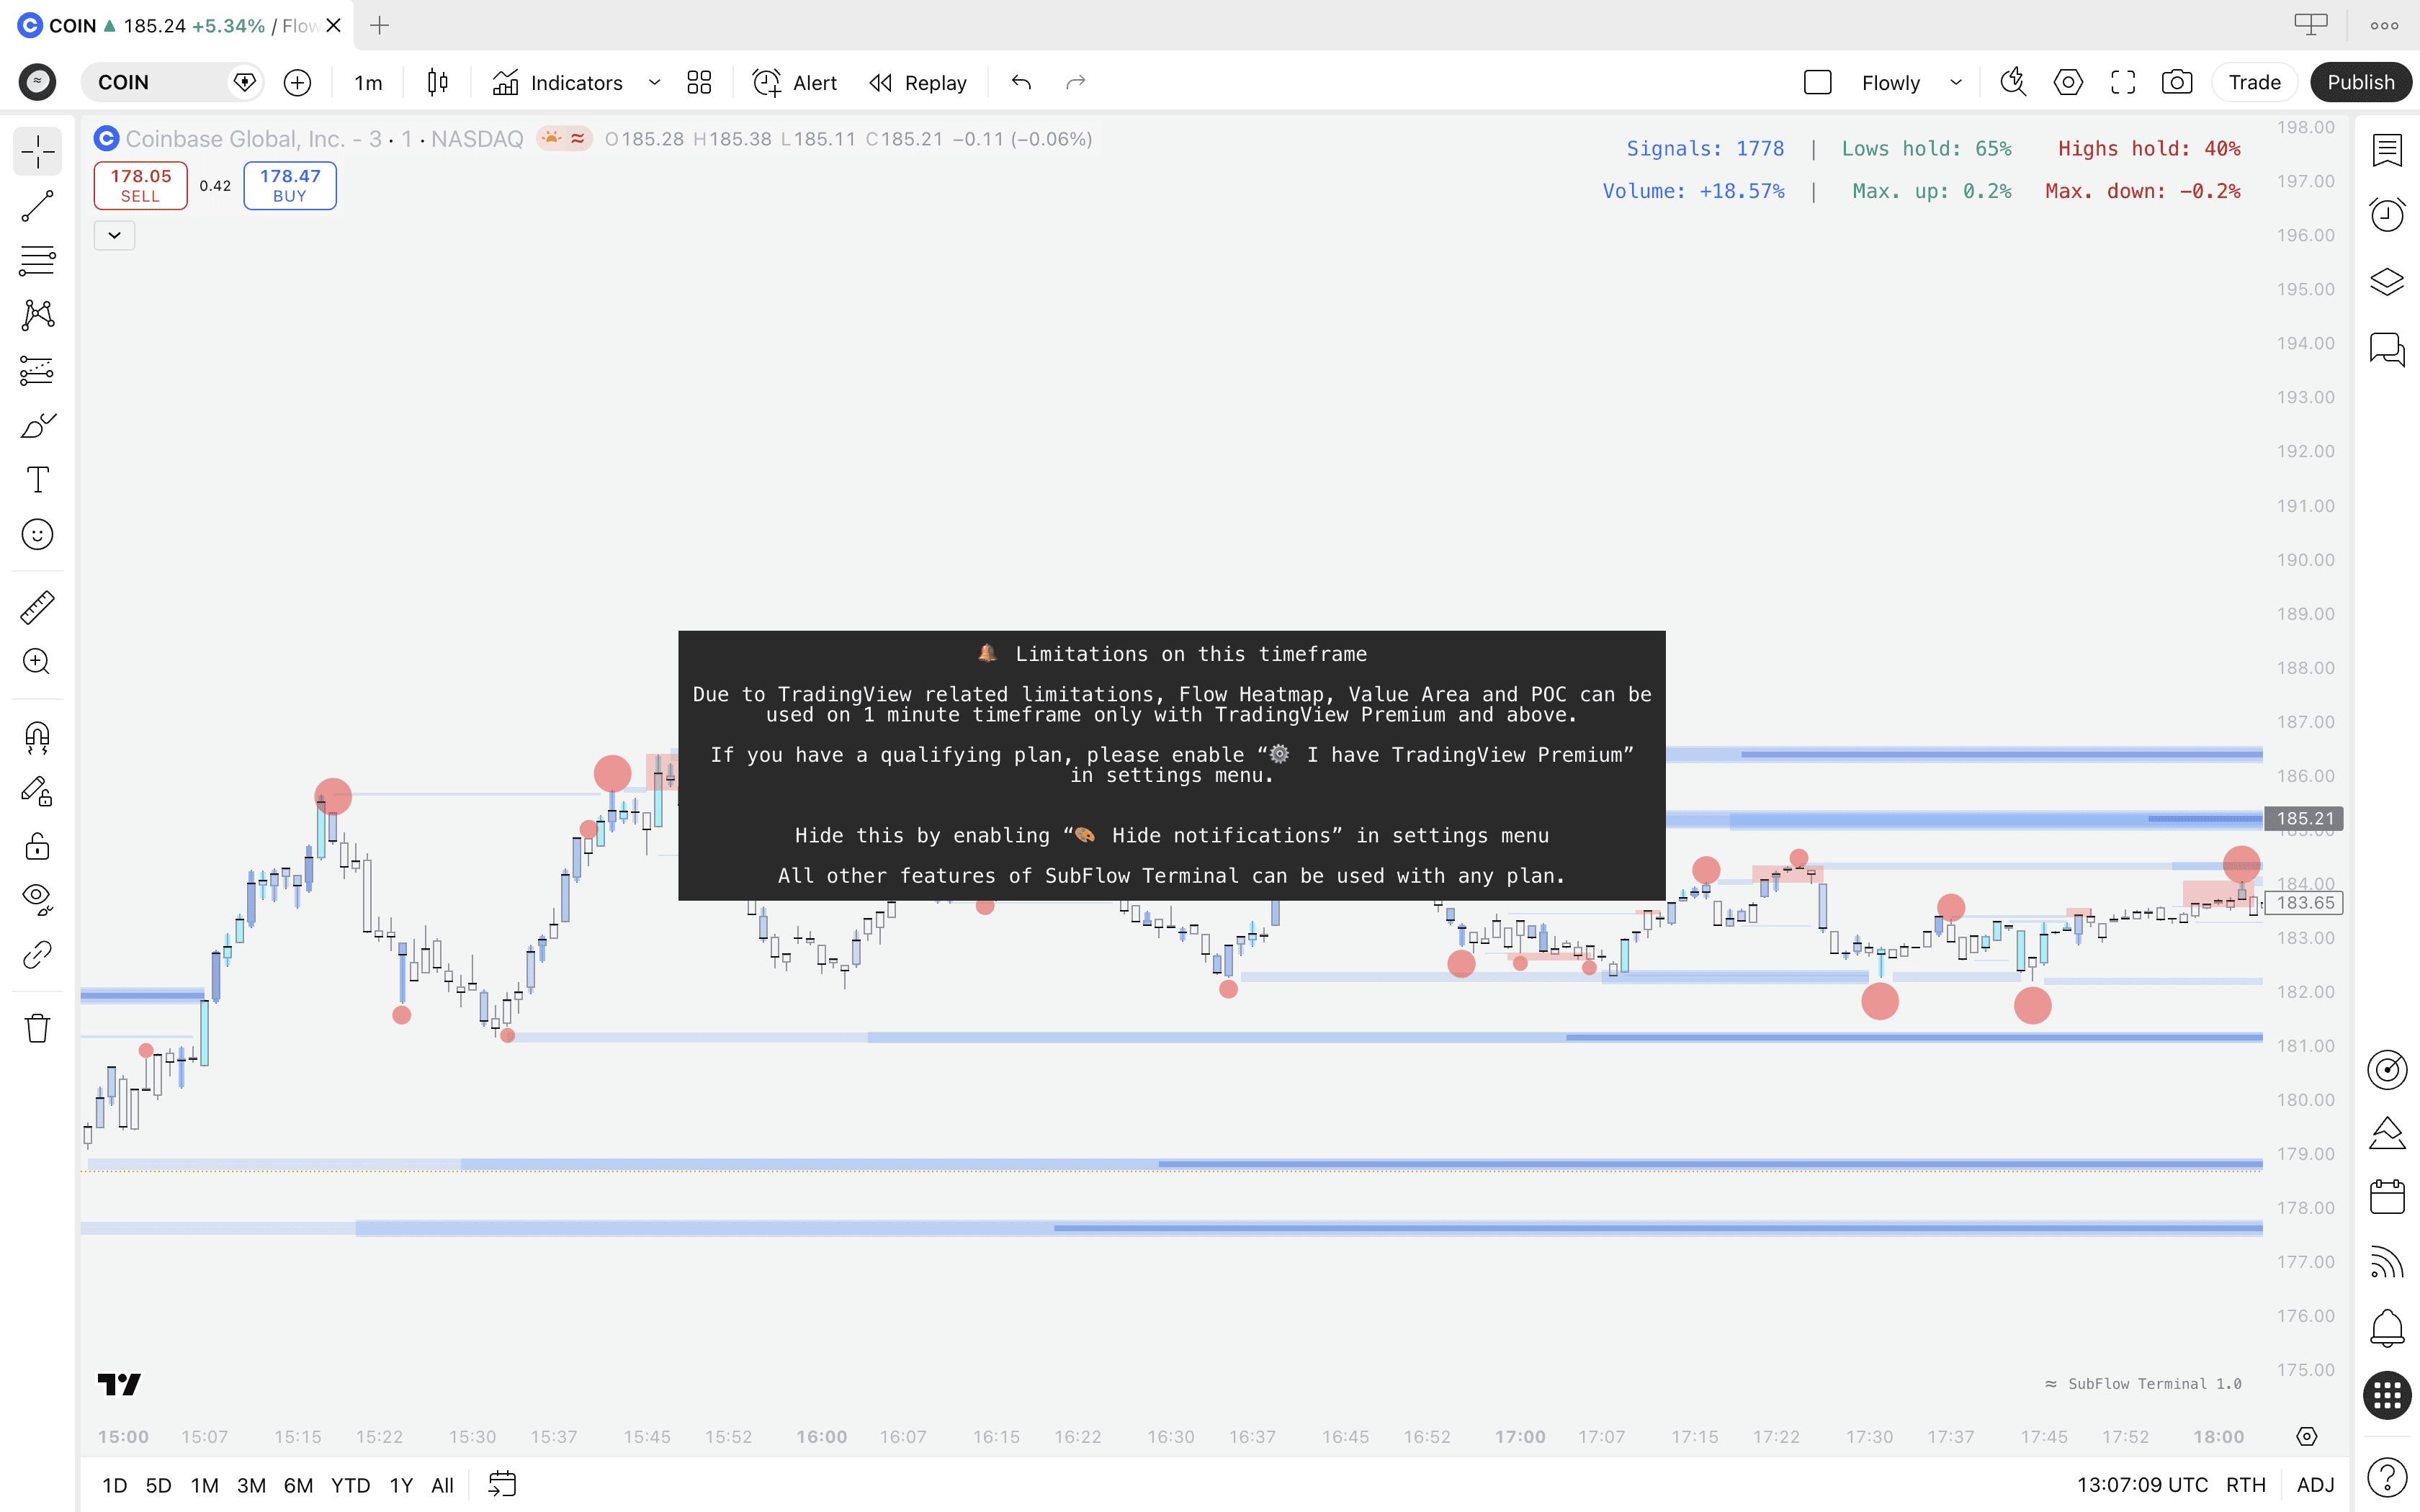
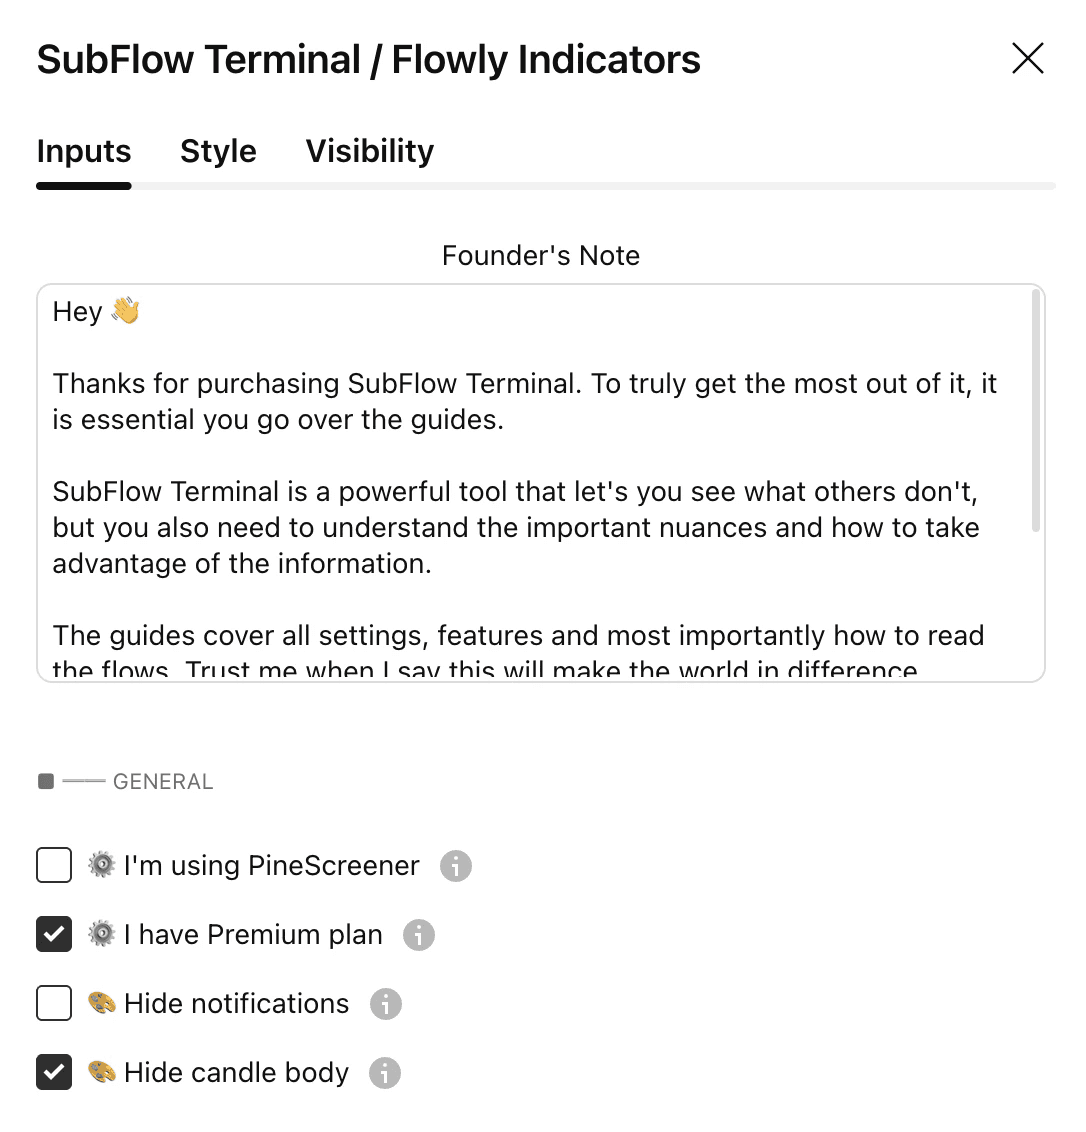
If you have a Premium or higher tier plan on TradingView, enable functionality on 1 minute timeframe by heading to SubFlow Terminal settings and enabling "I have Premium plan"
This script uses seconds-based timeframes which are only available to users with Premium or higher-tier plans
This error occurs when "I have Premium plan" is enabled under settings and user does not have a Premium or higher plan. SubFlow Terminal will attempt to use most accurate data to construct orderflow, which in lower timeframes is seconds-based timeframes, available for paid plans only.
To resolve the error, simply disable "I have Premium plan". Note that limitations on 1 minute timeframe will apply, see "Limitations on this timeframe notification" discussed above.
Memory limit error
While vast majority of the time not an issue, sometimes you might encounter a "Memory limit exceeded" error. Most of our tools are heavily packed with features, taking a toll on computation resources provided by Tradingview.
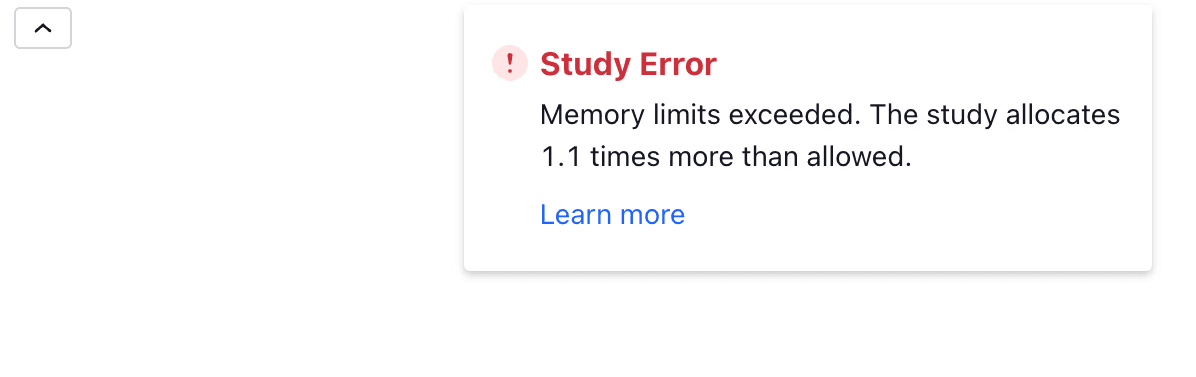
Often these issues are resolved by simply switching to the same symbol provided by another broker. For example, when viewing EURUSD by FXCM, change to EURUSD by OANDA:
Change this EUR/USD chart
To an alternative EUR/USD CHART
Calculation time out
Similarly to memory limit error, some of our more computation intensive tools occasionally hit a calculation time out error. This error is simply fixed by removing indicator and adding it to chart again or changing any setting in the indicator settings. This will cause a recalculation in the indicator, allowing another try for successful loading.
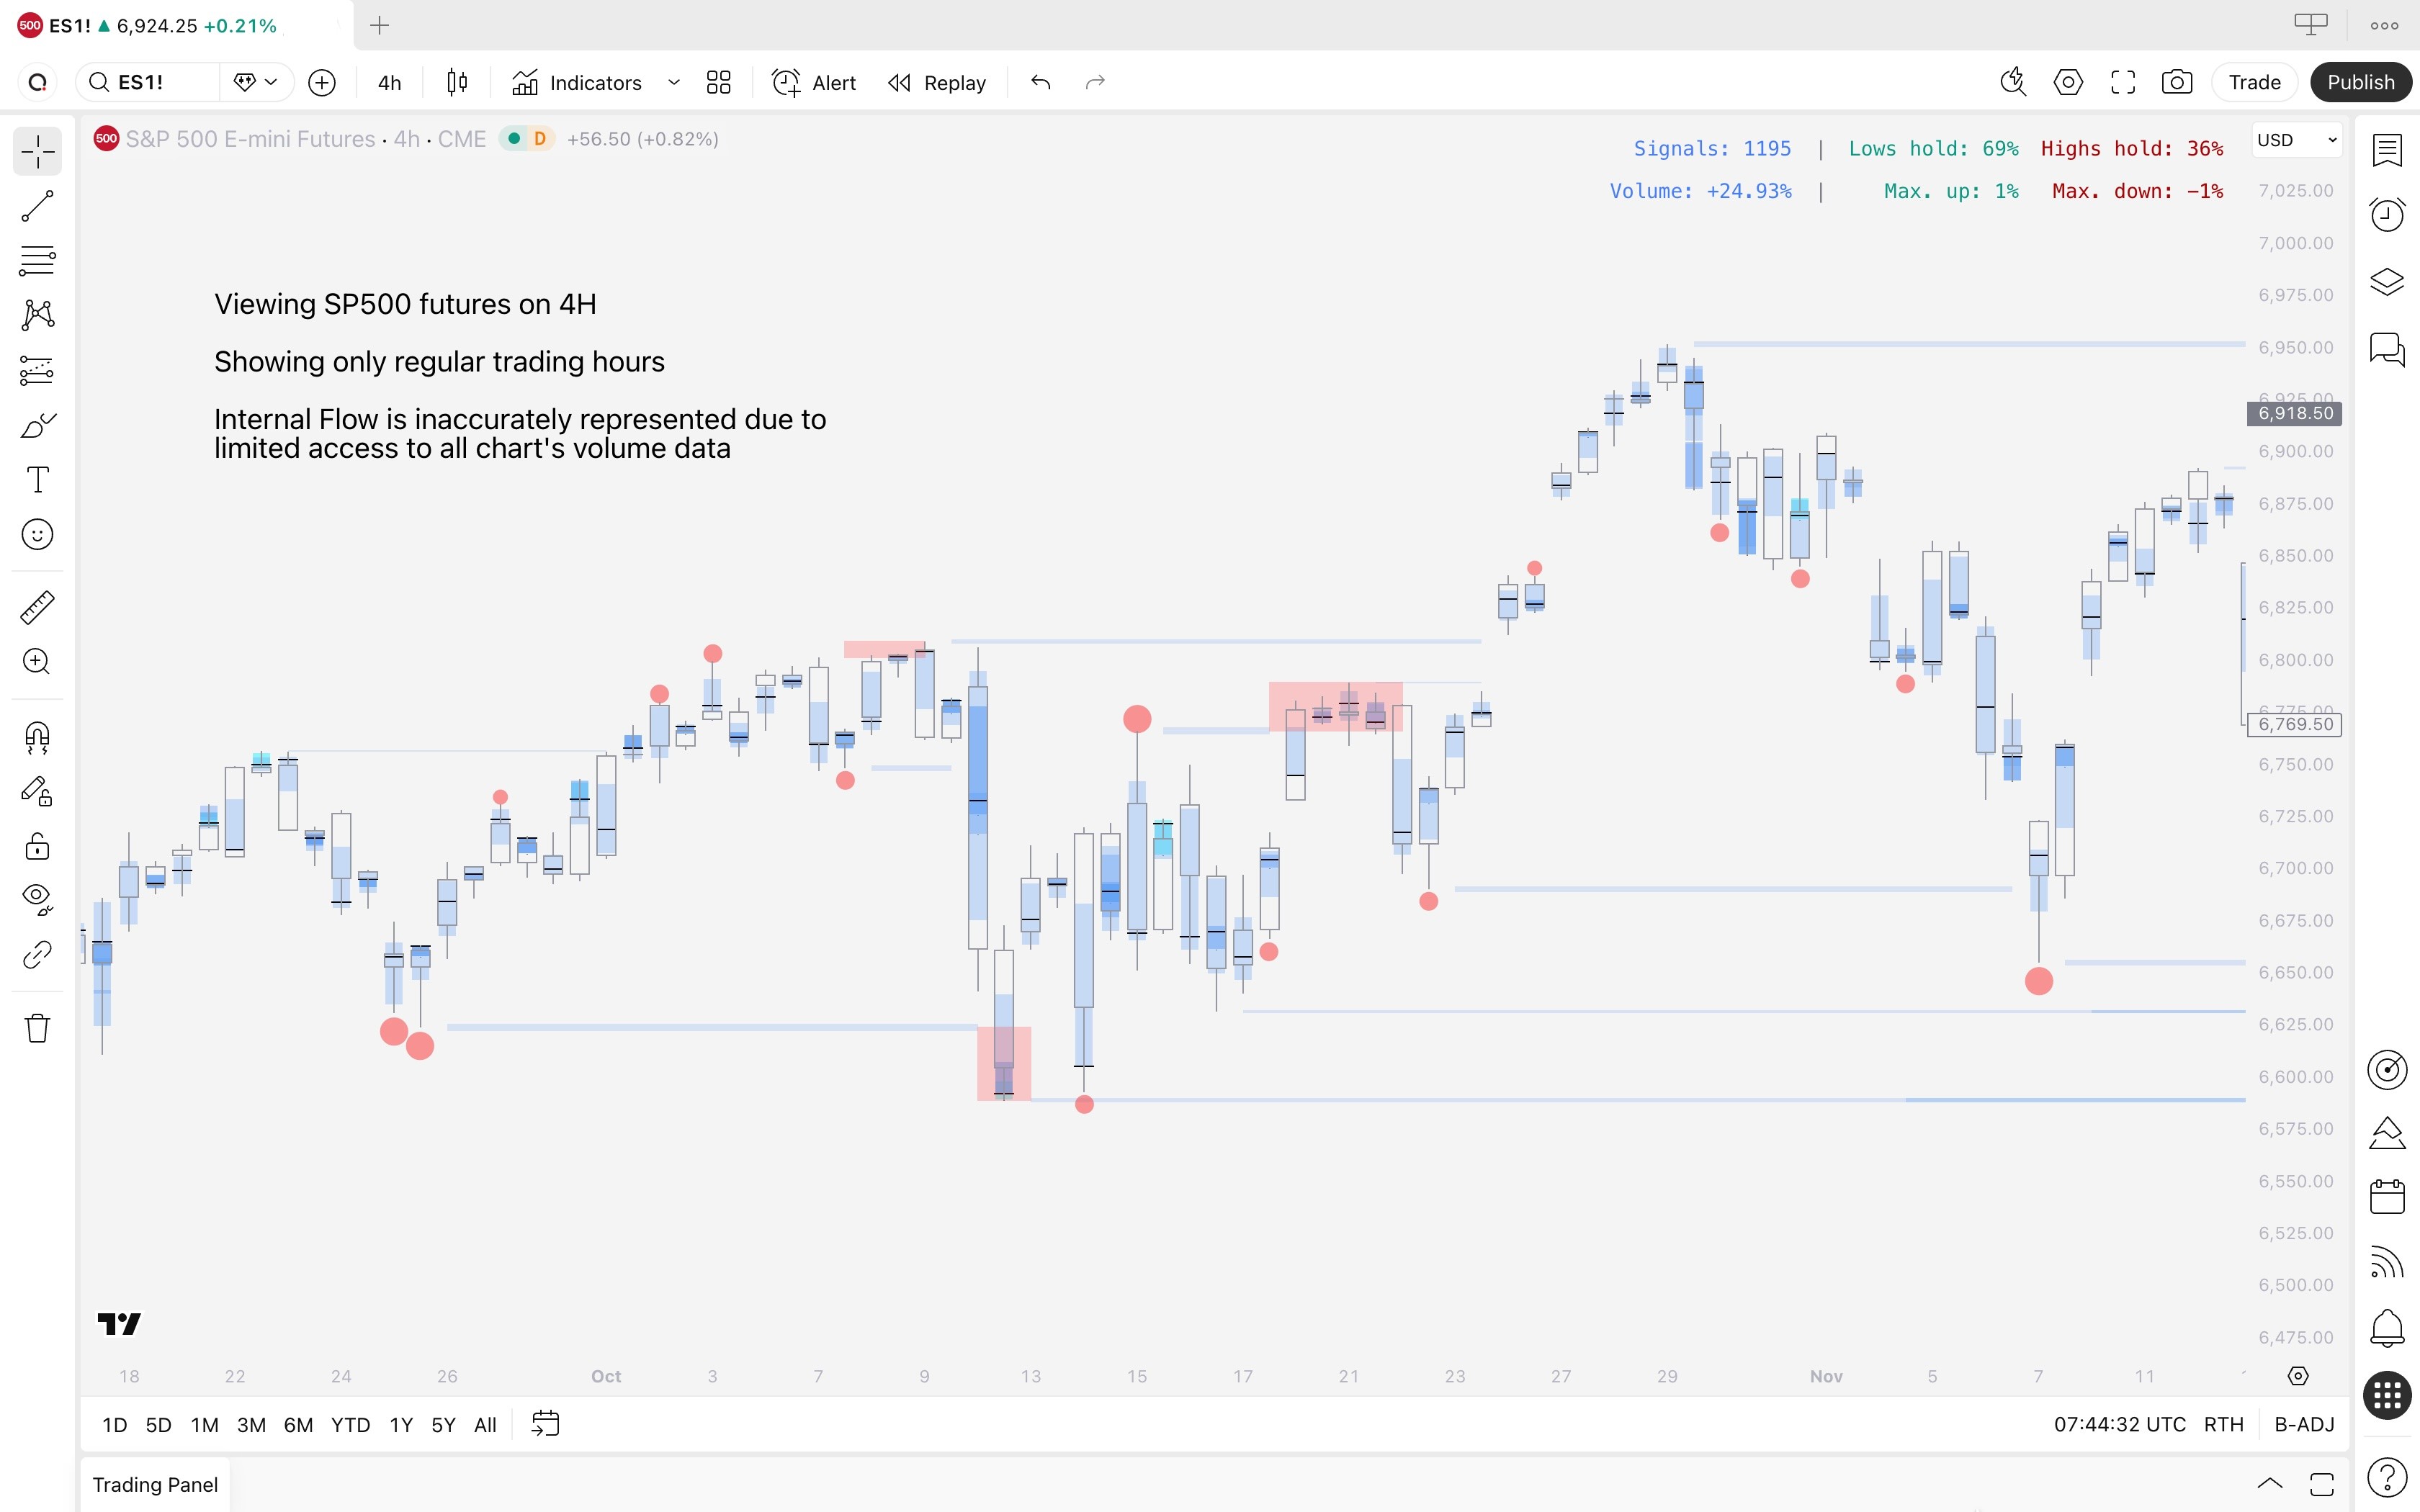
Inaccurate Internal Flow on stock market charts
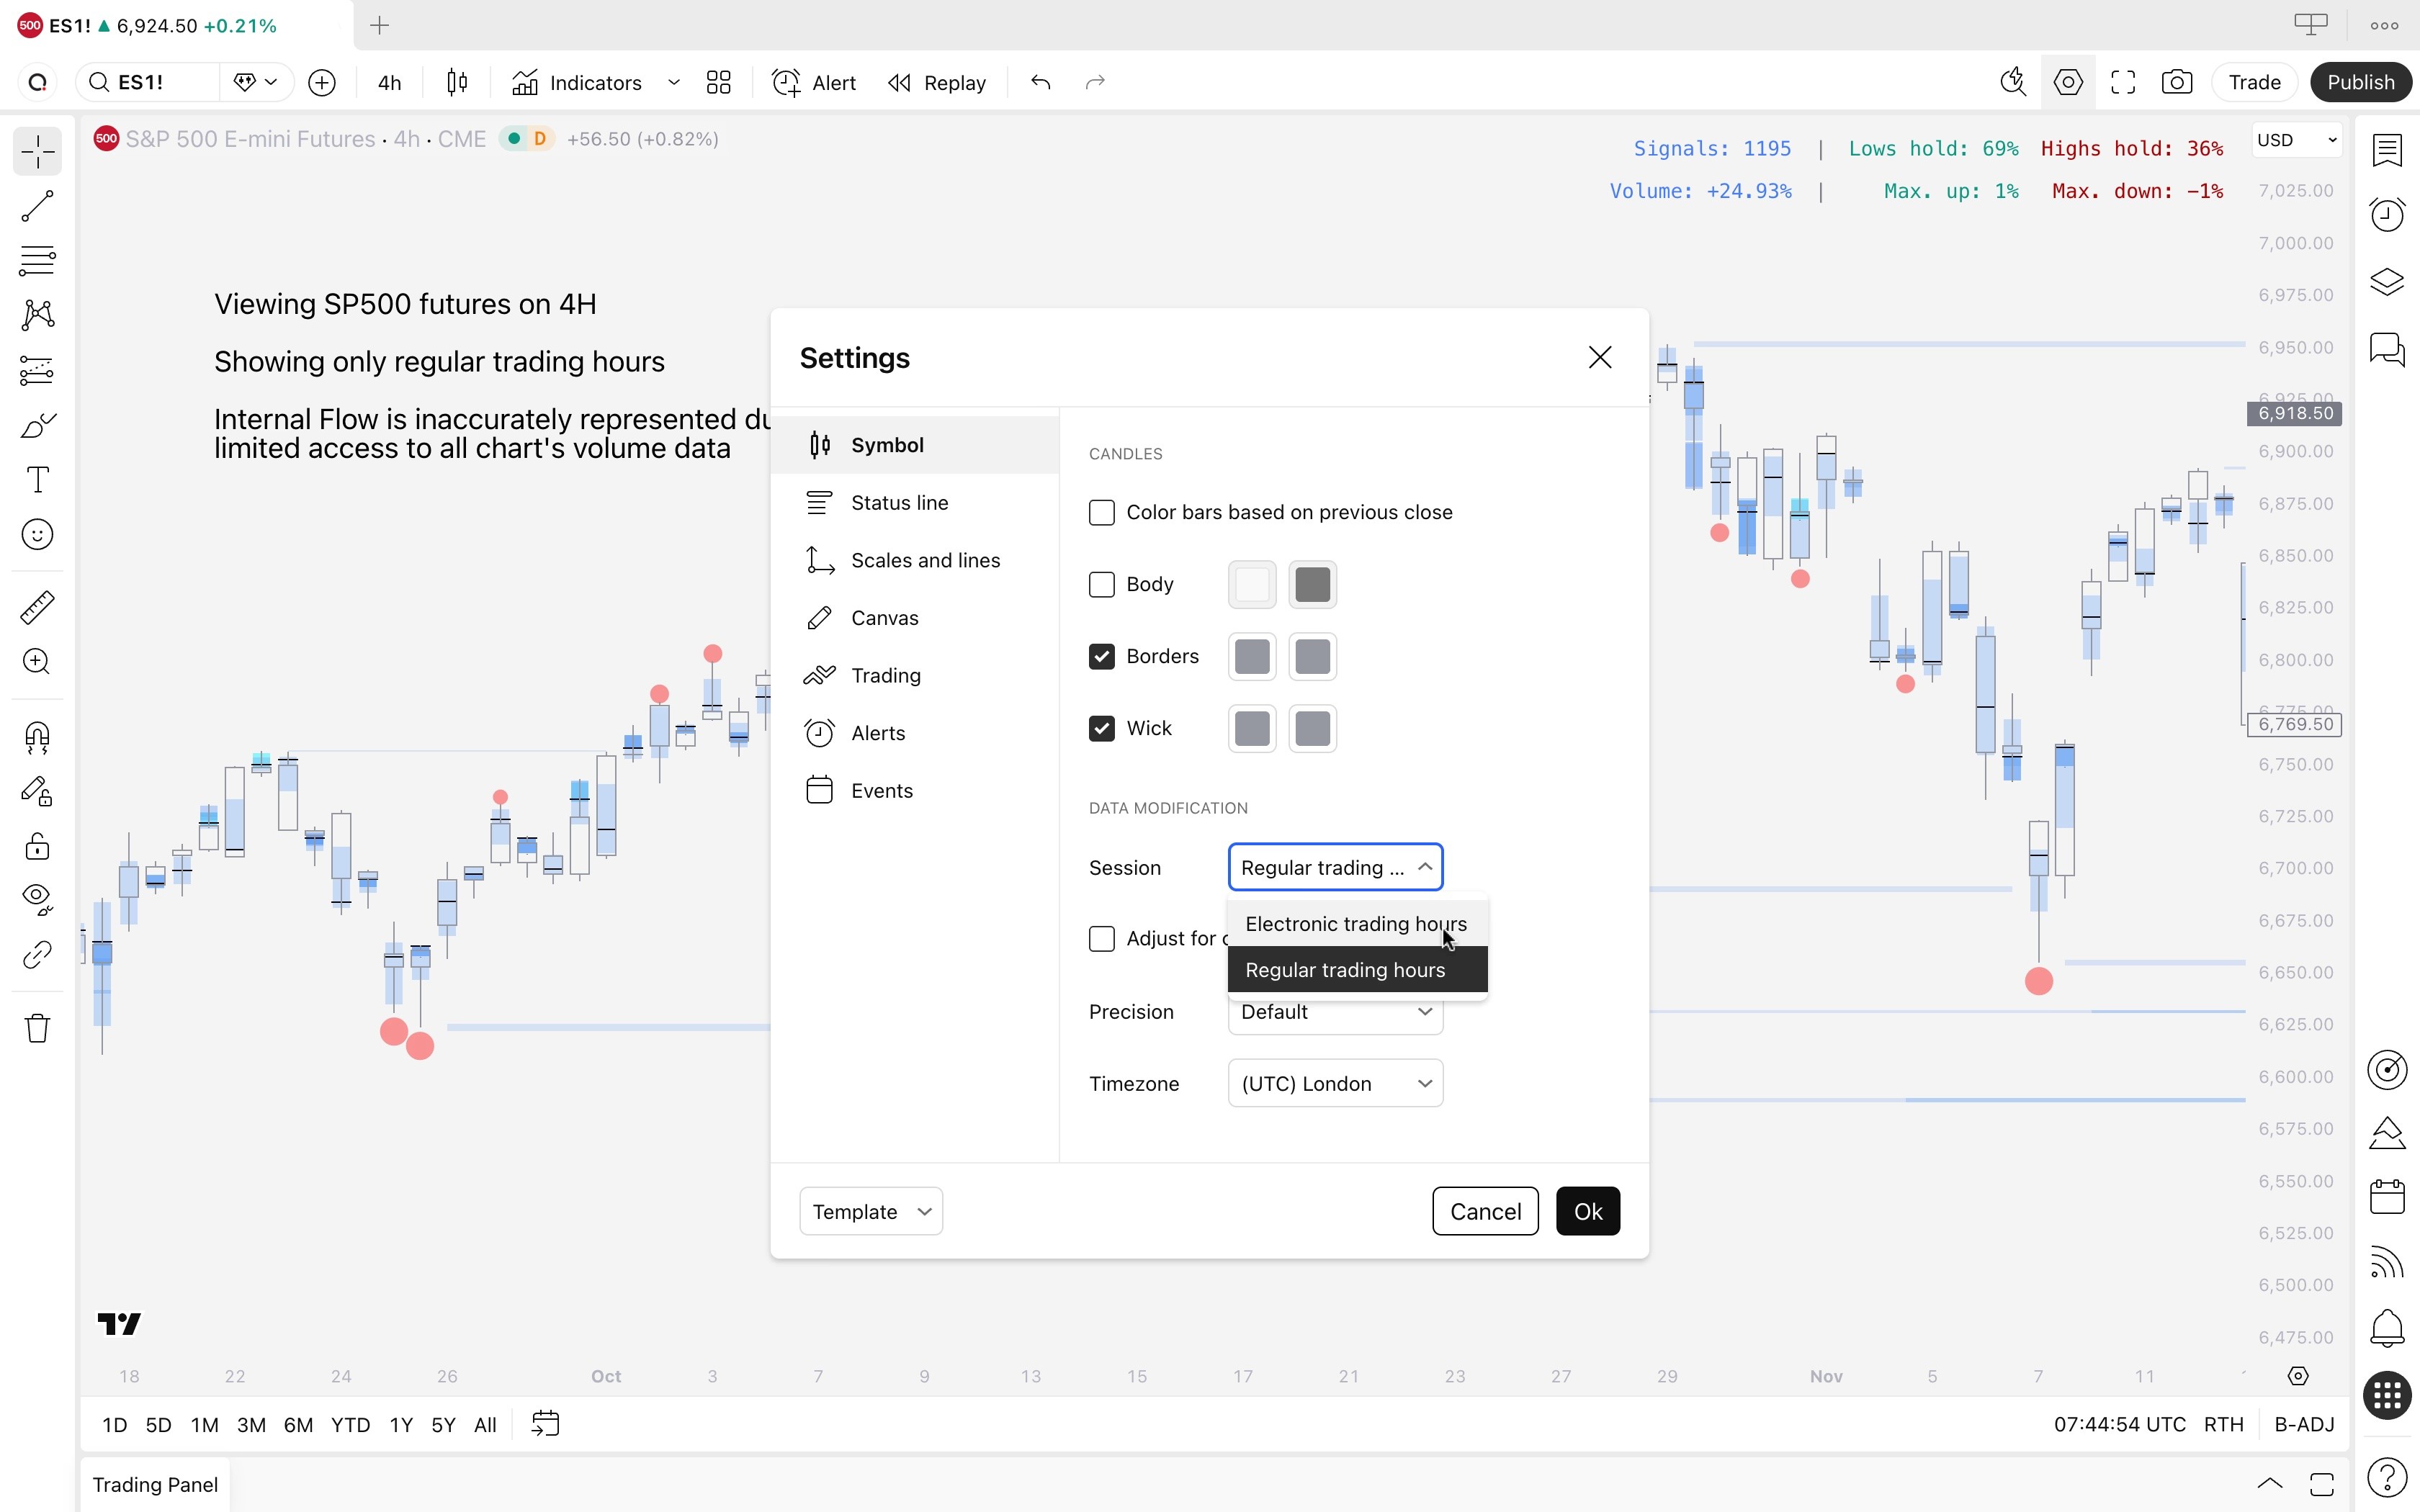
By default, TradingView displays stock market charts only for regular trading hours (when stock market is open).
This means Internal Flow will not have access to all volume data available beyond regular trading hours to determine what "unusual volume" means.
On lower timeframe charts, this leads to sparse and inaccurate data.
Switching to electronic trading hours
Internal Flow will work properly once we switch "Regular trading hours" to "Electronic trading hours" on TradingView's chart settings.
Open any stock chart, right click canvas and select Settings
Navigate to "Data modification" under Symbol tab
Select "Electronic trading hours"
Click "Ok"
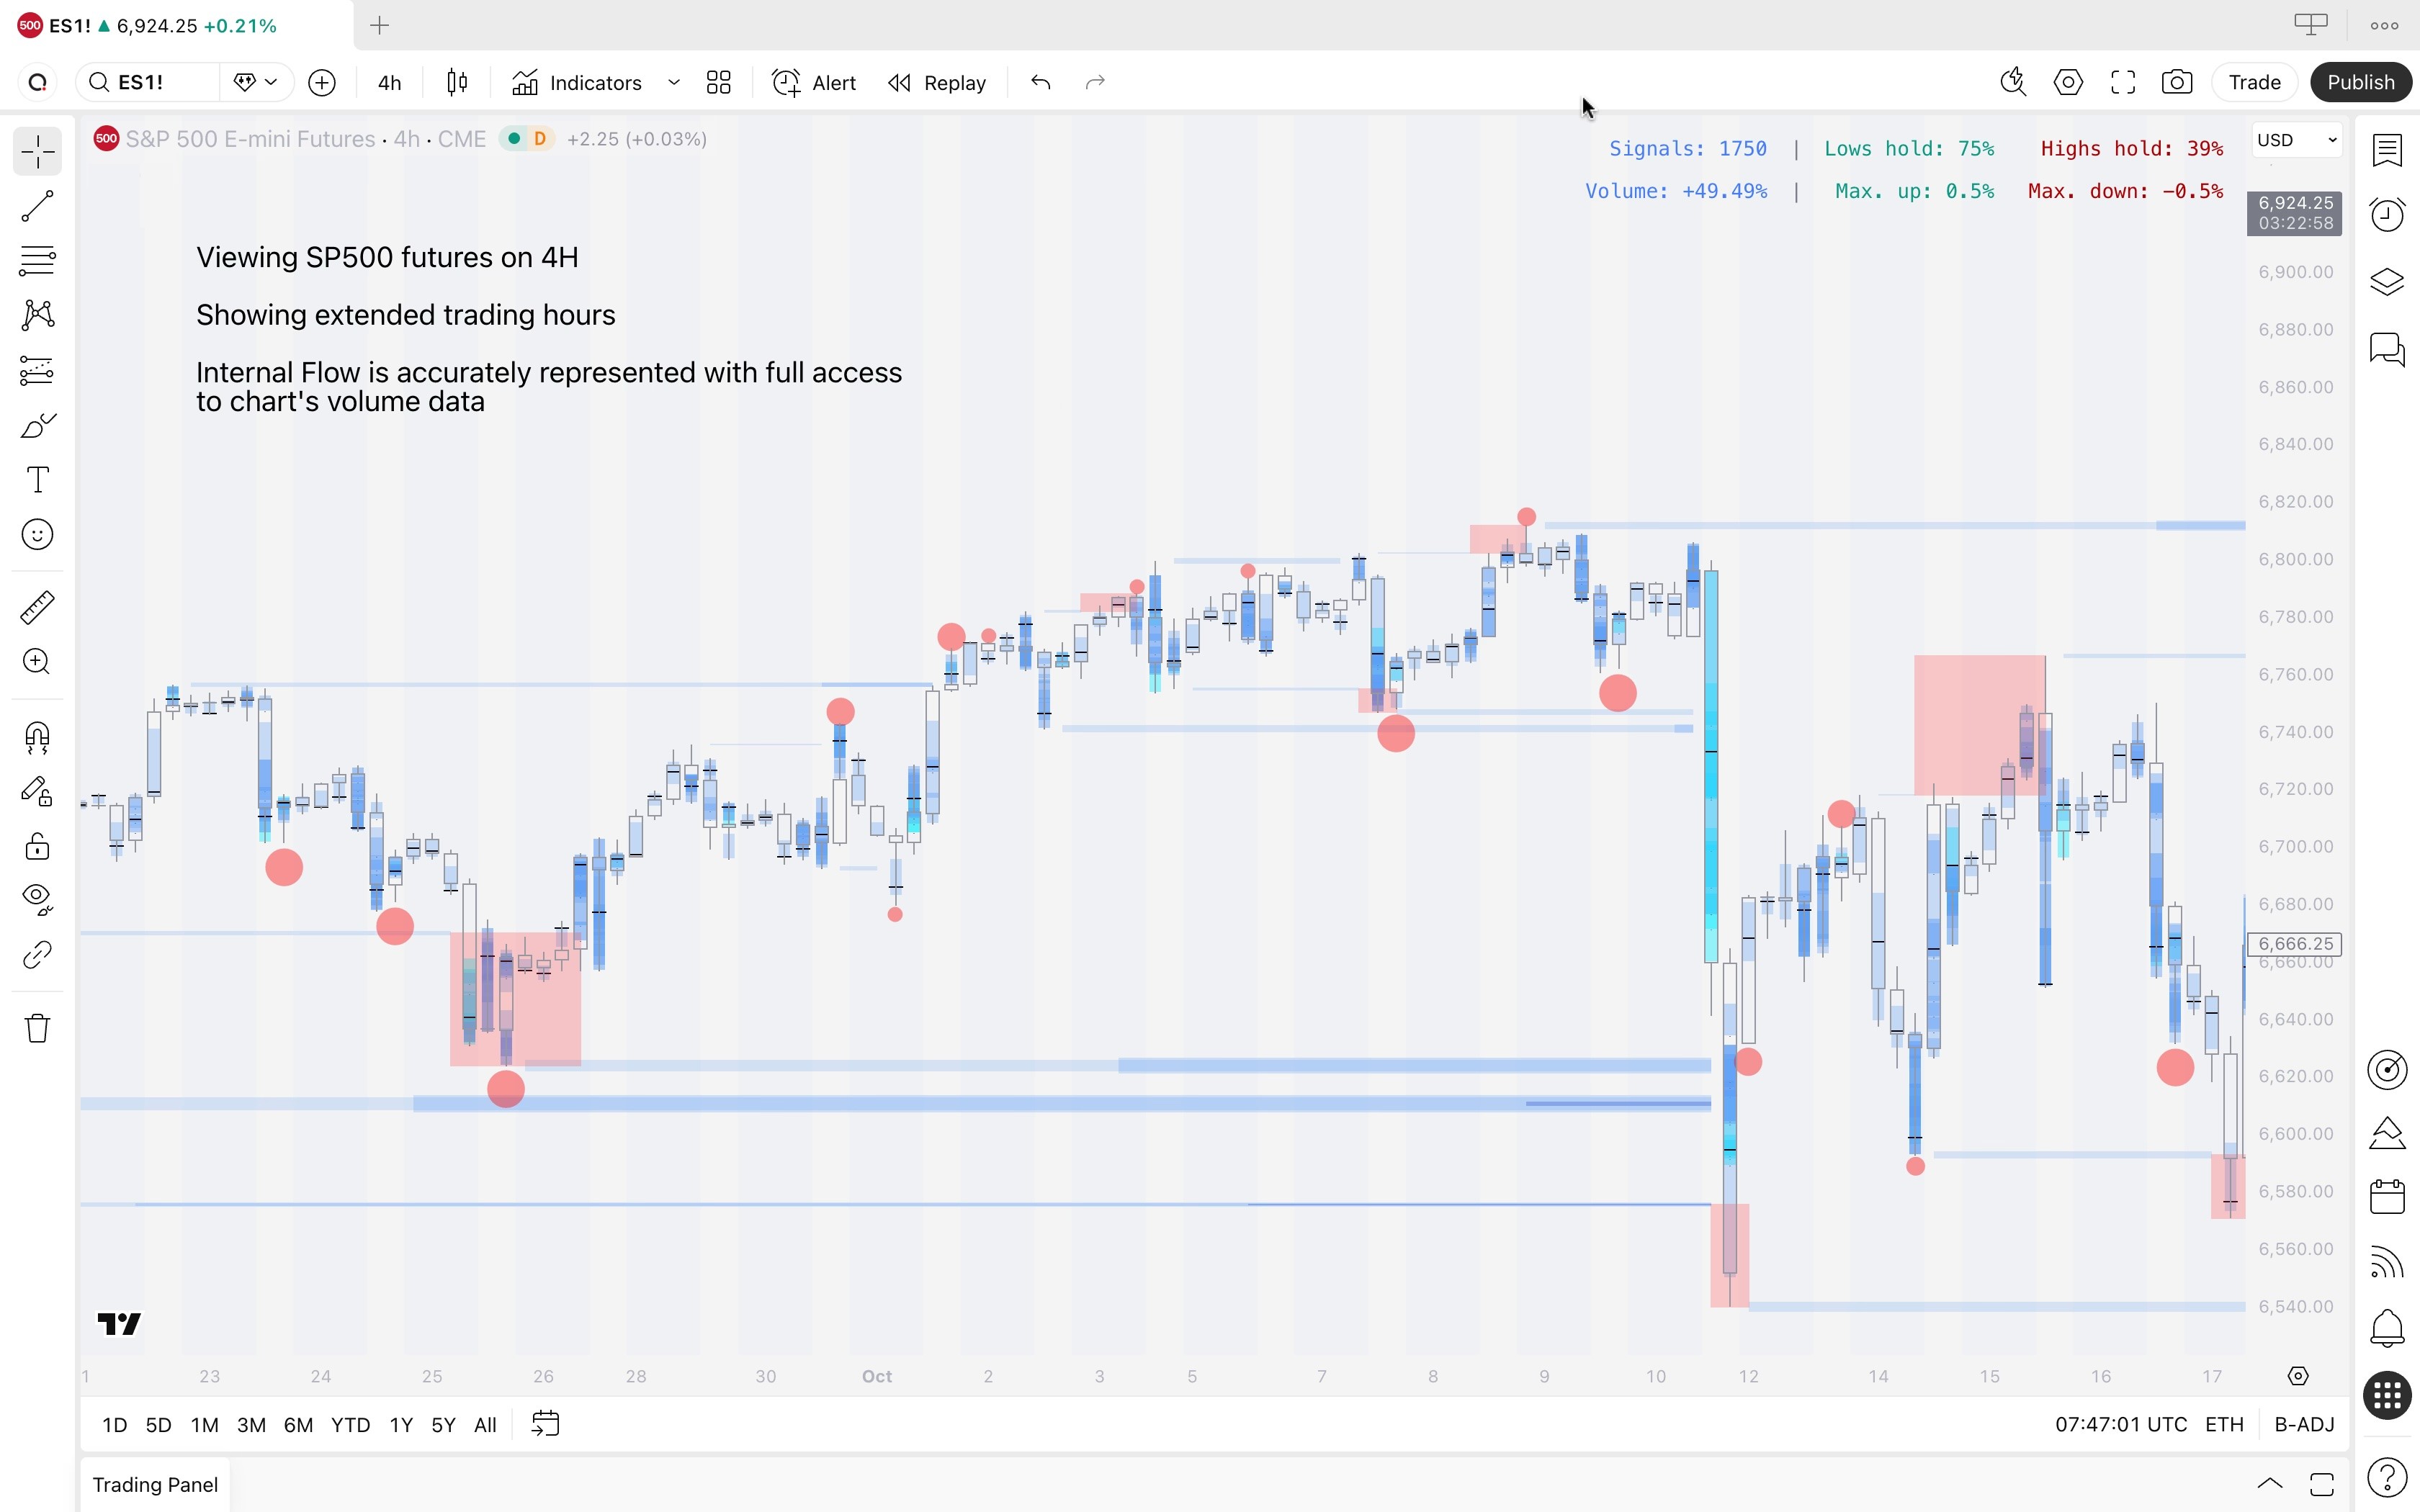
Internal Flow now has access to all volume data on the stock market chart and is represented accurately.
Limitations on this timeframe notification
This pop-up notification occurs when SubFlow Terminal is used on 1 minute timeframe. Due to TradingView related limitations Intrabar Heatmap, Value Area and POC can only be used on 1 minute timeframe with Premium or higher TradingView plans.
If you have a Premium or higher tier plan on TradingView, enable functionality on 1 minute timeframe by heading to SubFlow Terminal settings and enabling "I have Premium plan"
This script uses seconds-based timeframes which are only available to users with Premium or higher-tier plans
This error occurs when "I have Premium plan" is enabled under settings and user does not have a Premium or higher plan. SubFlow Terminal will attempt to use most accurate data to construct orderflow, which in lower timeframes is seconds-based timeframes, available for paid plans only.
To resolve the error, simply disable "I have Premium plan". Note that limitations on 1 minute timeframe will apply, see "Limitations on this timeframe notification" discussed above.
Memory limit error
While vast majority of the time not an issue, sometimes you might encounter a "Memory limit exceeded" error. Most of our tools are heavily packed with features, taking a toll on computation resources provided by Tradingview.
Often these issues are resolved by simply switching to the same symbol provided by another broker. For example, when viewing EURUSD by FXCM, change to EURUSD by OANDA:
Change this EUR/USD chart
To an alternative EUR/USD CHART
Calculation time out
Similarly to memory limit error, some of our more computation intensive tools occasionally hit a calculation time out error. This error is simply fixed by removing indicator and adding it to chart again or changing any setting in the indicator settings. This will cause a recalculation in the indicator, allowing another try for successful loading.
Inaccurate Internal Flow on stock market charts
By default, TradingView displays stock market charts only for regular trading hours (when stock market is open).
This means Internal Flow will not have access to all volume data available beyond regular trading hours to determine what "unusual volume" means.
On lower timeframe charts, this leads to sparse and inaccurate data.
Switching to electronic trading hours
Internal Flow will work properly once we switch "Regular trading hours" to "Electronic trading hours" on TradingView's chart settings.
Open any stock chart, right click canvas and select Settings
Navigate to "Data modification" under Symbol tab
Select "Electronic trading hours"
Click "Ok"
Internal Flow now has access to all volume data on the stock market chart and is represented accurately.
🤖
🤖
Indicators
Indicators
TradingView Indicators
TradingView Indicators

TradingView Orderflow Indicator: SubFlow Terminal
Orderflow
Premium
SubFlow Terminal is an orderflow indicator for TradingView featuring liquidity heatmaps, value area, point of control, liquidations, manipulations and backtesting.

TradingView Price Action Indicator: Imbalances
Price Action
Imbalances is a TradingView indicator highlighting areas of inefficient and one sided transacting, prone to filling sooner or later.

TradingView Volume Indicator: Volume Composition
Orderflow
Free
Volume composition is a TradingView volume indicator breaking volume down into volume delta, active/passive volume, relative volume and more.

TradingView Band Indicator: Fair Value Bands
Orderflow
Free
Fair value bands is a TradingView band indicator that displays dynamic risk levels and metrics for assessing liquidity traded at them.

TradingView Orderflow Indicator: Time & Volume POC
Orderflow
Free
Time & volume POC is a TradingView orderflow indicator that displays Time Point of Control (TPOC) and Volume Point of Control (VPOC) for each candle.

TradingView Orderflow Indicator: Open Interest Flow
Orderflow
Free
Open interest flow is a TradingView orderflow indicator displays long/short inflows and outflows using open interest and displays their magnitude in an easy-to-read way.
Load More
TradingView Orderflow Indicator: SubFlow Terminal
Orderflow
Premium
SubFlow Terminal is an orderflow indicator for TradingView featuring liquidity heatmaps, value area, point of control, liquidations, manipulations and backtesting.
TradingView Price Action Indicator: Imbalances
Price Action
Imbalances is a TradingView indicator highlighting areas of inefficient and one sided transacting, prone to filling sooner or later.
TradingView Volume Indicator: Volume Composition
Orderflow
Free
Volume composition is a TradingView volume indicator breaking volume down into volume delta, active/passive volume, relative volume and more.
Load More
🗞️
🗞️
Articles
Articles
Good reads on markets
Good reads on markets

TradingView Volume Footprint: Complete Guide for 2026
Orderflow
⏱️ 9 min
Learn how to use and trade TradingView's Volume Footprint - POC, Value Area, templates, settings and an honest look at whether it's worth TradingView Premium.

Introducing enhanced backtesting for Subflow Terminal
Update
⏱️ 3 min
SubFlow Terminal gets new backtesting features. Create custom backtests on selected time range, test short and long term performance and read results in a human friendly way.

Is TradingView orderflow accurate?
Orderflow
⏱️ 8 min
Is TradingView's orderflow accurate enough to trade with? Breaking down how the data is calculated, what you can trust and where native platforms still win.

quantify.tools is now Flowly Indicators
Announcement
⏱️ 4 min
We are now called Flowly Indicators. A new phase in quantified indicators, firmly rooted in theory of volume and orderflow. Here's our journey.
TradingView Volume Footprint: Complete Guide for 2026
Orderflow
⏱️ 9 min
Learn how to use and trade TradingView's Volume Footprint - POC, Value Area, templates, settings and an honest look at whether it's worth TradingView Premium.
Introducing enhanced backtesting for Subflow Terminal
Update
⏱️ 3 min
SubFlow Terminal gets new backtesting features. Create custom backtests on selected time range, test short and long term performance and read results in a human friendly way.
Is TradingView orderflow accurate?
Orderflow
⏱️ 8 min
Is TradingView's orderflow accurate enough to trade with? Breaking down how the data is calculated, what you can trust and where native platforms still win.
Load More
Flowly Indicators
See through trading charts with orderflow
FlowLetter
Stay in loop
Sign up

Disclaimer
We are an independent script vendor on TradingView and have no affiliation with them. All content provided by us are strictly for educational purposes and should not be construed as financial advice.
Hypothetical or simulated performance shown does not represent actual trading and past results do not guarantee future performance. By using our content for decision making, you do it at your own risk and fully acknowledge that you alone are responsible for your own research and financial decisions.
© 2026 Flowly Indicators. All rights reserved.
Flowly Indicators
See through trading charts with orderflow
FlowLetter
Stay in loop
Sign up
Disclaimer
We are an independent script vendor on TradingView and have no affiliation with them. All content provided by us are strictly for educational purposes and should not be construed as financial advice.
Hypothetical or simulated performance shown does not represent actual trading and past results do not guarantee future performance. By using our content for decision making, you do it at your own risk and fully acknowledge that you alone are responsible for your own research and financial decisions.
© 2026 Flowly Indicators. All rights reserved.
Flowly Indicators
See through trading charts with orderflow
Join FlowLetter
Disclaimer
We are an independent script vendor on TradingView and have no affiliation with them. All content provided by us are strictly for educational purposes and should not be construed as financial advice.
Hypothetical or simulated performance shown does not represent actual trading and past results do not guarantee future performance. By using our content for decision making, you do it at your own risk and fully acknowledge that you alone are responsible for your own research and financial decisions.
© 2026 Flowly Indicators. All rights reserved.