What's new
Our previous heatmap, although powerful, was fairly minimal. Our liquidity pool detection algorithm did quite well at assessing where liquidity forms (as evidenced by backtest metrics), but visualization did not convey the difference of depth between levels to an equal degree. Here’s what our old liquidity heatmap looks like on NVDA 4H.

We can tell the bottom and the top are bigger levels than the rest, but we cannot, for example, tell if the top or bottom pool is larger. The pools in between are a bit muddled too.
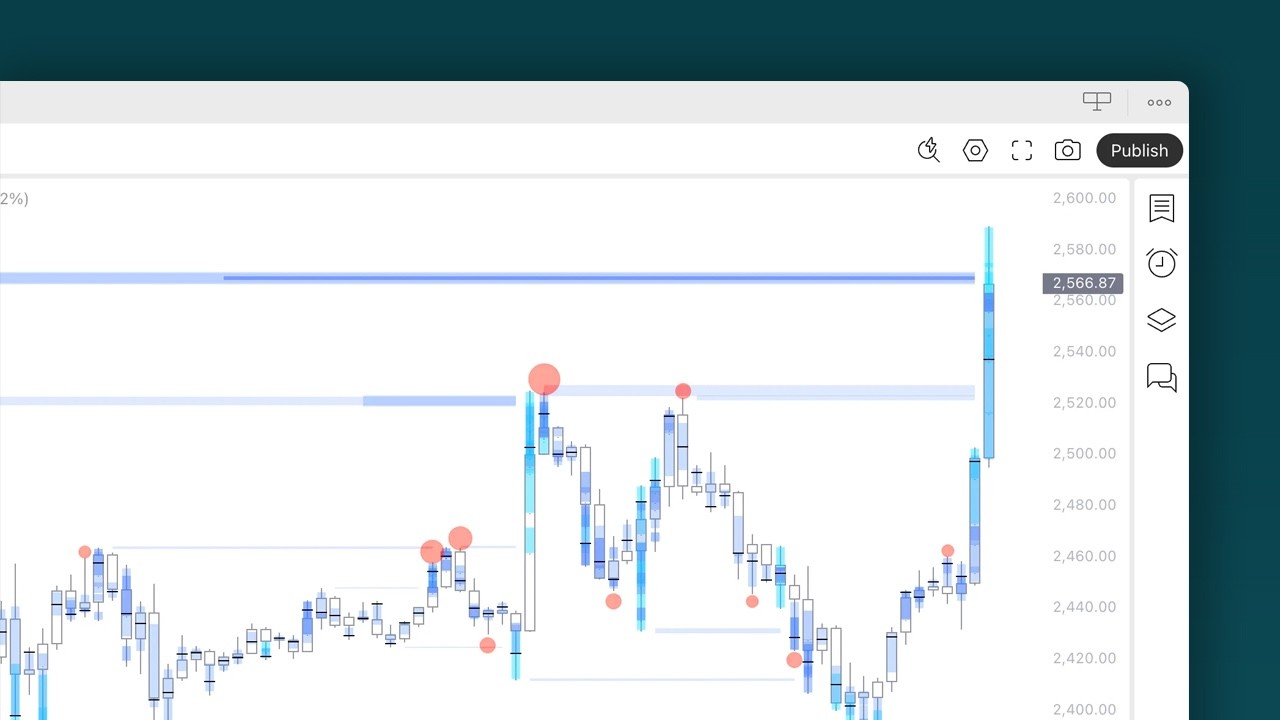
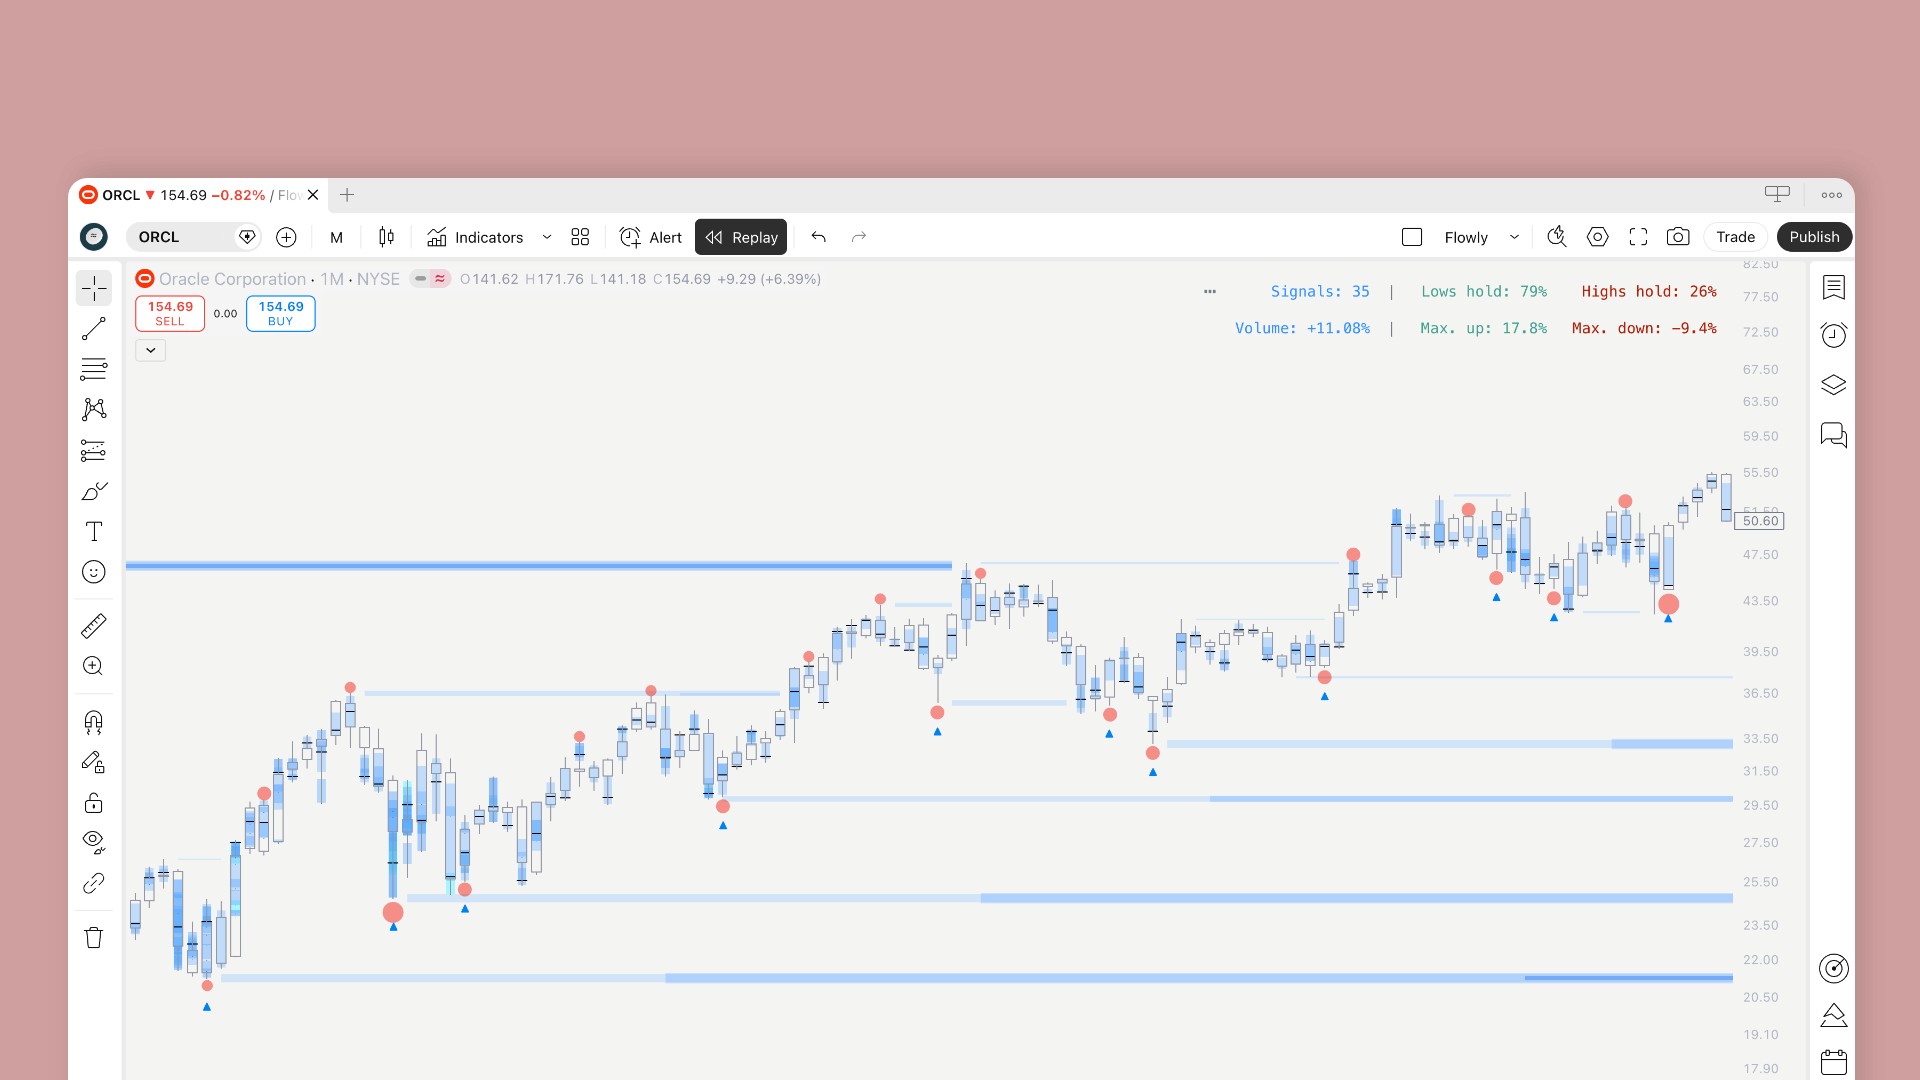
Our new heatmap addresses this with intuitive clustering and brightness to match the underlying pool strength. And it looks much nicer too, right?

But the changes we made are not purely visual. We spent a lot of time observing price action patterns and their relation to orderbook anomalies to understand what signals stronger market participant interest, and built what we learned into our new ranking engine.
The new engine takes into account multiple factors from volume and price patterns associated with liquidity depth, ranked in terms of their extremity and context to market regime.
How to read it
Reading the heatmap is simple. Faint color means there is some liquidity, bright color means there is a lot of it. The wider the band, the stronger the level. When a band ends, price has taken the liquidity. Just like you would expect from a heatmap.
Levels at full strength get a core line, which glows brighter (orange in the image), indicating extreme liquidity where we can expect “max pain” for traders positioned there. Max pain levels are natural targets where we can expect some kind of funny business to happen.
Funny business usually means a sharp reversal, or price cutting through like butter and running further. Max pain levels are valuable data to keep track of.
FAQ
Do my alerts change? No. Same events, same setup, just cleaner sweeps.
Do manipulation signals work the same? Yes. Once a level is swept and price closes back in, it’ll be a manipulation level the same way as before.
Do I need to do anything? Remove and add SubFlow Terminal to your chart again to make sure the update has kicked in.
Does it repaint? No. Levels only form on confirmed candles.
What's new
Our previous heatmap, although powerful, was fairly minimal. Our liquidity pool detection algorithm did quite well at assessing where liquidity forms (as evidenced by backtest metrics), but visualization did not convey the difference of depth between levels to an equal degree. Here’s what our old liquidity heatmap looks like on NVDA 4H.
We can tell the bottom and the top are bigger levels than the rest, but we cannot, for example, tell if the top or bottom pool is larger. The pools in between are a bit muddled too.
Our new heatmap addresses this with intuitive clustering and brightness to match the underlying pool strength. And it looks much nicer too, right?
But the changes we made are not purely visual. We spent a lot of time observing price action patterns and their relation to orderbook anomalies to understand what signals stronger market participant interest, and built what we learned into our new ranking engine.
The new engine takes into account multiple factors from volume and price patterns associated with liquidity depth, ranked in terms of their extremity and context to market regime.
How to read it
Reading the heatmap is simple. Faint color means there is some liquidity, bright color means there is a lot of it. The wider the band, the stronger the level. When a band ends, price has taken the liquidity. Just like you would expect from a heatmap.
Levels at full strength get a core line, which glows brighter (orange in the image), indicating extreme liquidity where we can expect “max pain” for traders positioned there. Max pain levels are natural targets where we can expect some kind of funny business to happen.
Funny business usually means a sharp reversal, or price cutting through like butter and running further. Max pain levels are valuable data to keep track of.
FAQ
Do my alerts change? No. Same events, same setup, just cleaner sweeps.
Do manipulation signals work the same? Yes. Once a level is swept and price closes back in, it’ll be a manipulation level the same way as before.
Do I need to do anything? Remove and add SubFlow Terminal to your chart again to make sure the update has kicked in.
Does it repaint? No. Levels only form on confirmed candles.