

Key features and settings
This tool provides market breadth for US equities (based on NYSE advancers - decliners) and ability to build two custom breadth baskets with up to 39 symbols included in each. Market breadth can be customized with variety of smoothing options, weighting and threshold modes to find most optimal rules for trend following.

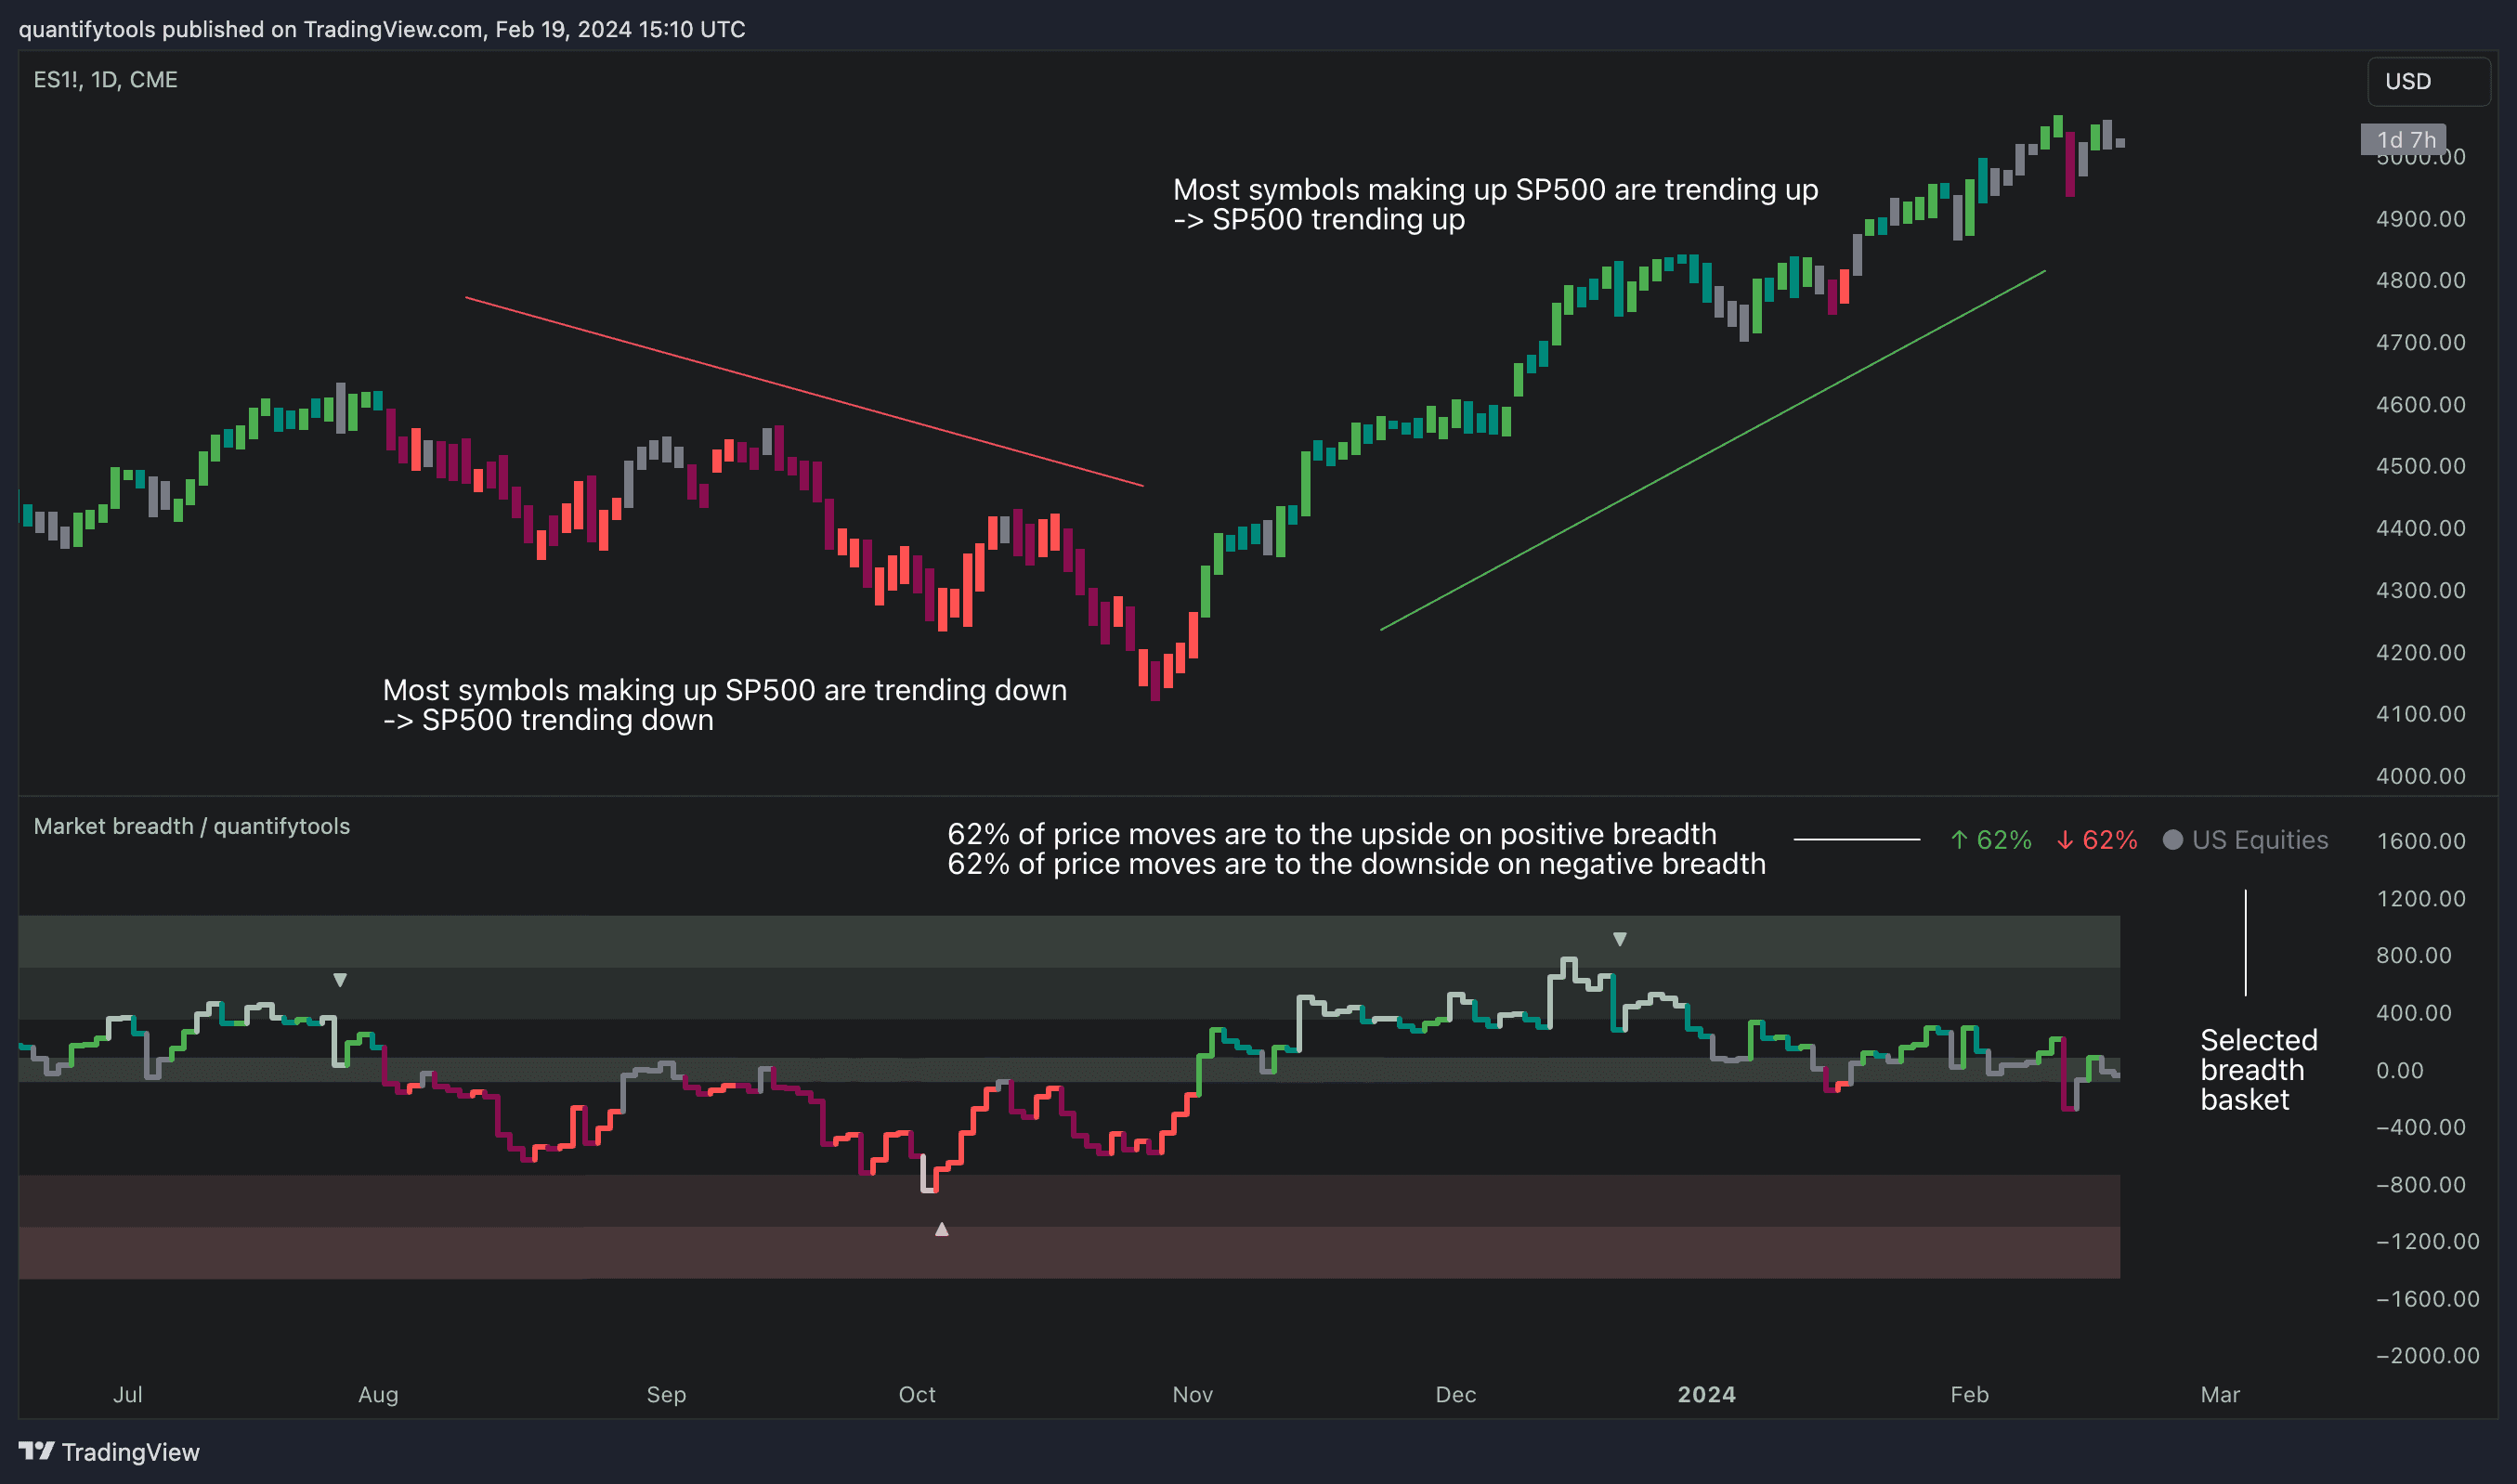
Backtesting market breadth
Performance of the model is reflected on metrics showing percentage of up/down moves during bullish/bearish states.
Example
↑ 63% = 63% of price moves during positive breadth state are to the upside
↓ 59% = 59% of price moves during negative breadth state are to the downside
Building custom market breadth index
By default, market breadth is calculated based on NYSE advancers - decliners, usable for all major indices that depict broad markets in US equities (SP500, QQQ, IWM). Users can also build 2 custom breadth baskets consisting of up to 39 symbols for defining broad market on other asset classes, such as cryptocurrencies. Custom baskets are suitable for any chart that fairly represents a market as a whole.
Example
Basket consisting of cryptocurrencies = Use on TOTAL (all cryptocurrencies aggregated)
Basket consisting of healthcare stocks = Use on XLV (healthcare sector ETF)

Customizing market breadth index
Breadth line can be further refined using various smoothing options (SMA, EMA, HMA, RMA, WMA), threshold method and weights. By default, threshold (dividing line between bullish and bearish states) is set to fixed at 0, depicting an equilibrium where equal amount of symbols are going up and down.
Fixed and dynamic threshold
Threshold mode can also be set to Dynamic, switching threshold to a moving average of the breadth line. Fundamental functionality still remains, breadth line above threshold marks bullish state and below threshold marks bearish state. Difference here is that the threshold no longer depicts a point of equilibrium, but simply a smoothed version of the breadth line itself, which can catch turns in broad market trend earlier.

Volatility adjusted market breadth
Breadth basket can be adjusted to volatility of the viewed chart, causing an overstating of breadth on high volatility and understating on low volatility. Weighting takes into account magnitude of up/down moves, which can provide better relevance for trend following purposes.

Key features and settings
This tool provides market breadth for US equities (based on NYSE advancers - decliners) and ability to build two custom breadth baskets with up to 39 symbols included in each. Market breadth can be customized with variety of smoothing options, weighting and threshold modes to find most optimal rules for trend following.
Backtesting market breadth
Performance of the model is reflected on metrics showing percentage of up/down moves during bullish/bearish states.
Example
↑ 63% = 63% of price moves during positive breadth state are to the upside
↓ 59% = 59% of price moves during negative breadth state are to the downside
Building custom market breadth index
By default, market breadth is calculated based on NYSE advancers - decliners, usable for all major indices that depict broad markets in US equities (SP500, QQQ, IWM). Users can also build 2 custom breadth baskets consisting of up to 39 symbols for defining broad market on other asset classes, such as cryptocurrencies. Custom baskets are suitable for any chart that fairly represents a market as a whole.
Example
Basket consisting of cryptocurrencies = Use on TOTAL (all cryptocurrencies aggregated)
Basket consisting of healthcare stocks = Use on XLV (healthcare sector ETF)
Customizing market breadth index
Breadth line can be further refined using various smoothing options (SMA, EMA, HMA, RMA, WMA), threshold method and weights. By default, threshold (dividing line between bullish and bearish states) is set to fixed at 0, depicting an equilibrium where equal amount of symbols are going up and down.
Fixed and dynamic threshold
Threshold mode can also be set to Dynamic, switching threshold to a moving average of the breadth line. Fundamental functionality still remains, breadth line above threshold marks bullish state and below threshold marks bearish state. Difference here is that the threshold no longer depicts a point of equilibrium, but simply a smoothed version of the breadth line itself, which can catch turns in broad market trend earlier.
Volatility adjusted market breadth
Breadth basket can be adjusted to volatility of the viewed chart, causing an overstating of breadth on high volatility and understating on low volatility. Weighting takes into account magnitude of up/down moves, which can provide better relevance for trend following purposes.
How to use Broad market index in trading
The utility of market breadth is based on the idea that markets correlate and individual symbols making up the market will eventually join the broad market trend. With this in mind, going against broad market is like swimming upstream, it's going to be the hard way.
Trend following with market breadth
A well performing basket with clear skew for upside and downside on respective breadth states can be used to form directional bias for trades and risk on/off regimes for investing.

Spotting broad market reversals
Thrusts signify two things: a historical extreme in breadth and an aggressive move to the opposite direction. Thrusts are valuable clues for exhaustion in broad market trend, potentially leading to a reversal.

Weak market momentum using divergences
Market breadth and price diverging signify events where most symbols that make up the market are going one way but a few high weight symbols (big tech for SP500) are going the other way. In other words, only a few symbols are moving the market while general interest and intention is to the other direction. Divergences in breadth and price are not ideal for sustainable trend and can be expected to eventually revert to the direction of broad market.

How to use Broad market index in trading
The utility of market breadth is based on the idea that markets correlate and individual symbols making up the market will eventually join the broad market trend. With this in mind, going against broad market is like swimming upstream, it's going to be the hard way.
Trend following with market breadth
A well performing basket with clear skew for upside and downside on respective breadth states can be used to form directional bias for trades and risk on/off regimes for investing.
Spotting broad market reversals
Thrusts signify two things: a historical extreme in breadth and an aggressive move to the opposite direction. Thrusts are valuable clues for exhaustion in broad market trend, potentially leading to a reversal.
Weak market momentum using divergences
Market breadth and price diverging signify events where most symbols that make up the market are going one way but a few high weight symbols (big tech for SP500) are going the other way. In other words, only a few symbols are moving the market while general interest and intention is to the other direction. Divergences in breadth and price are not ideal for sustainable trend and can be expected to eventually revert to the direction of broad market.
Get Broad market index on TradingView
Find TradingView indicators easily by opening up any chart on TradingView (e.g. TSLA) and clicking Indicators tab on top menu. To find all our tools, search "quantifytools" and click an indicator to add to your chart.
TradingView page
Broad market index on TradingView ↗


