

Stochastic RSI heatmap
The heatmap color visible on bands is applied using the following rules, based on stochastic RSI:
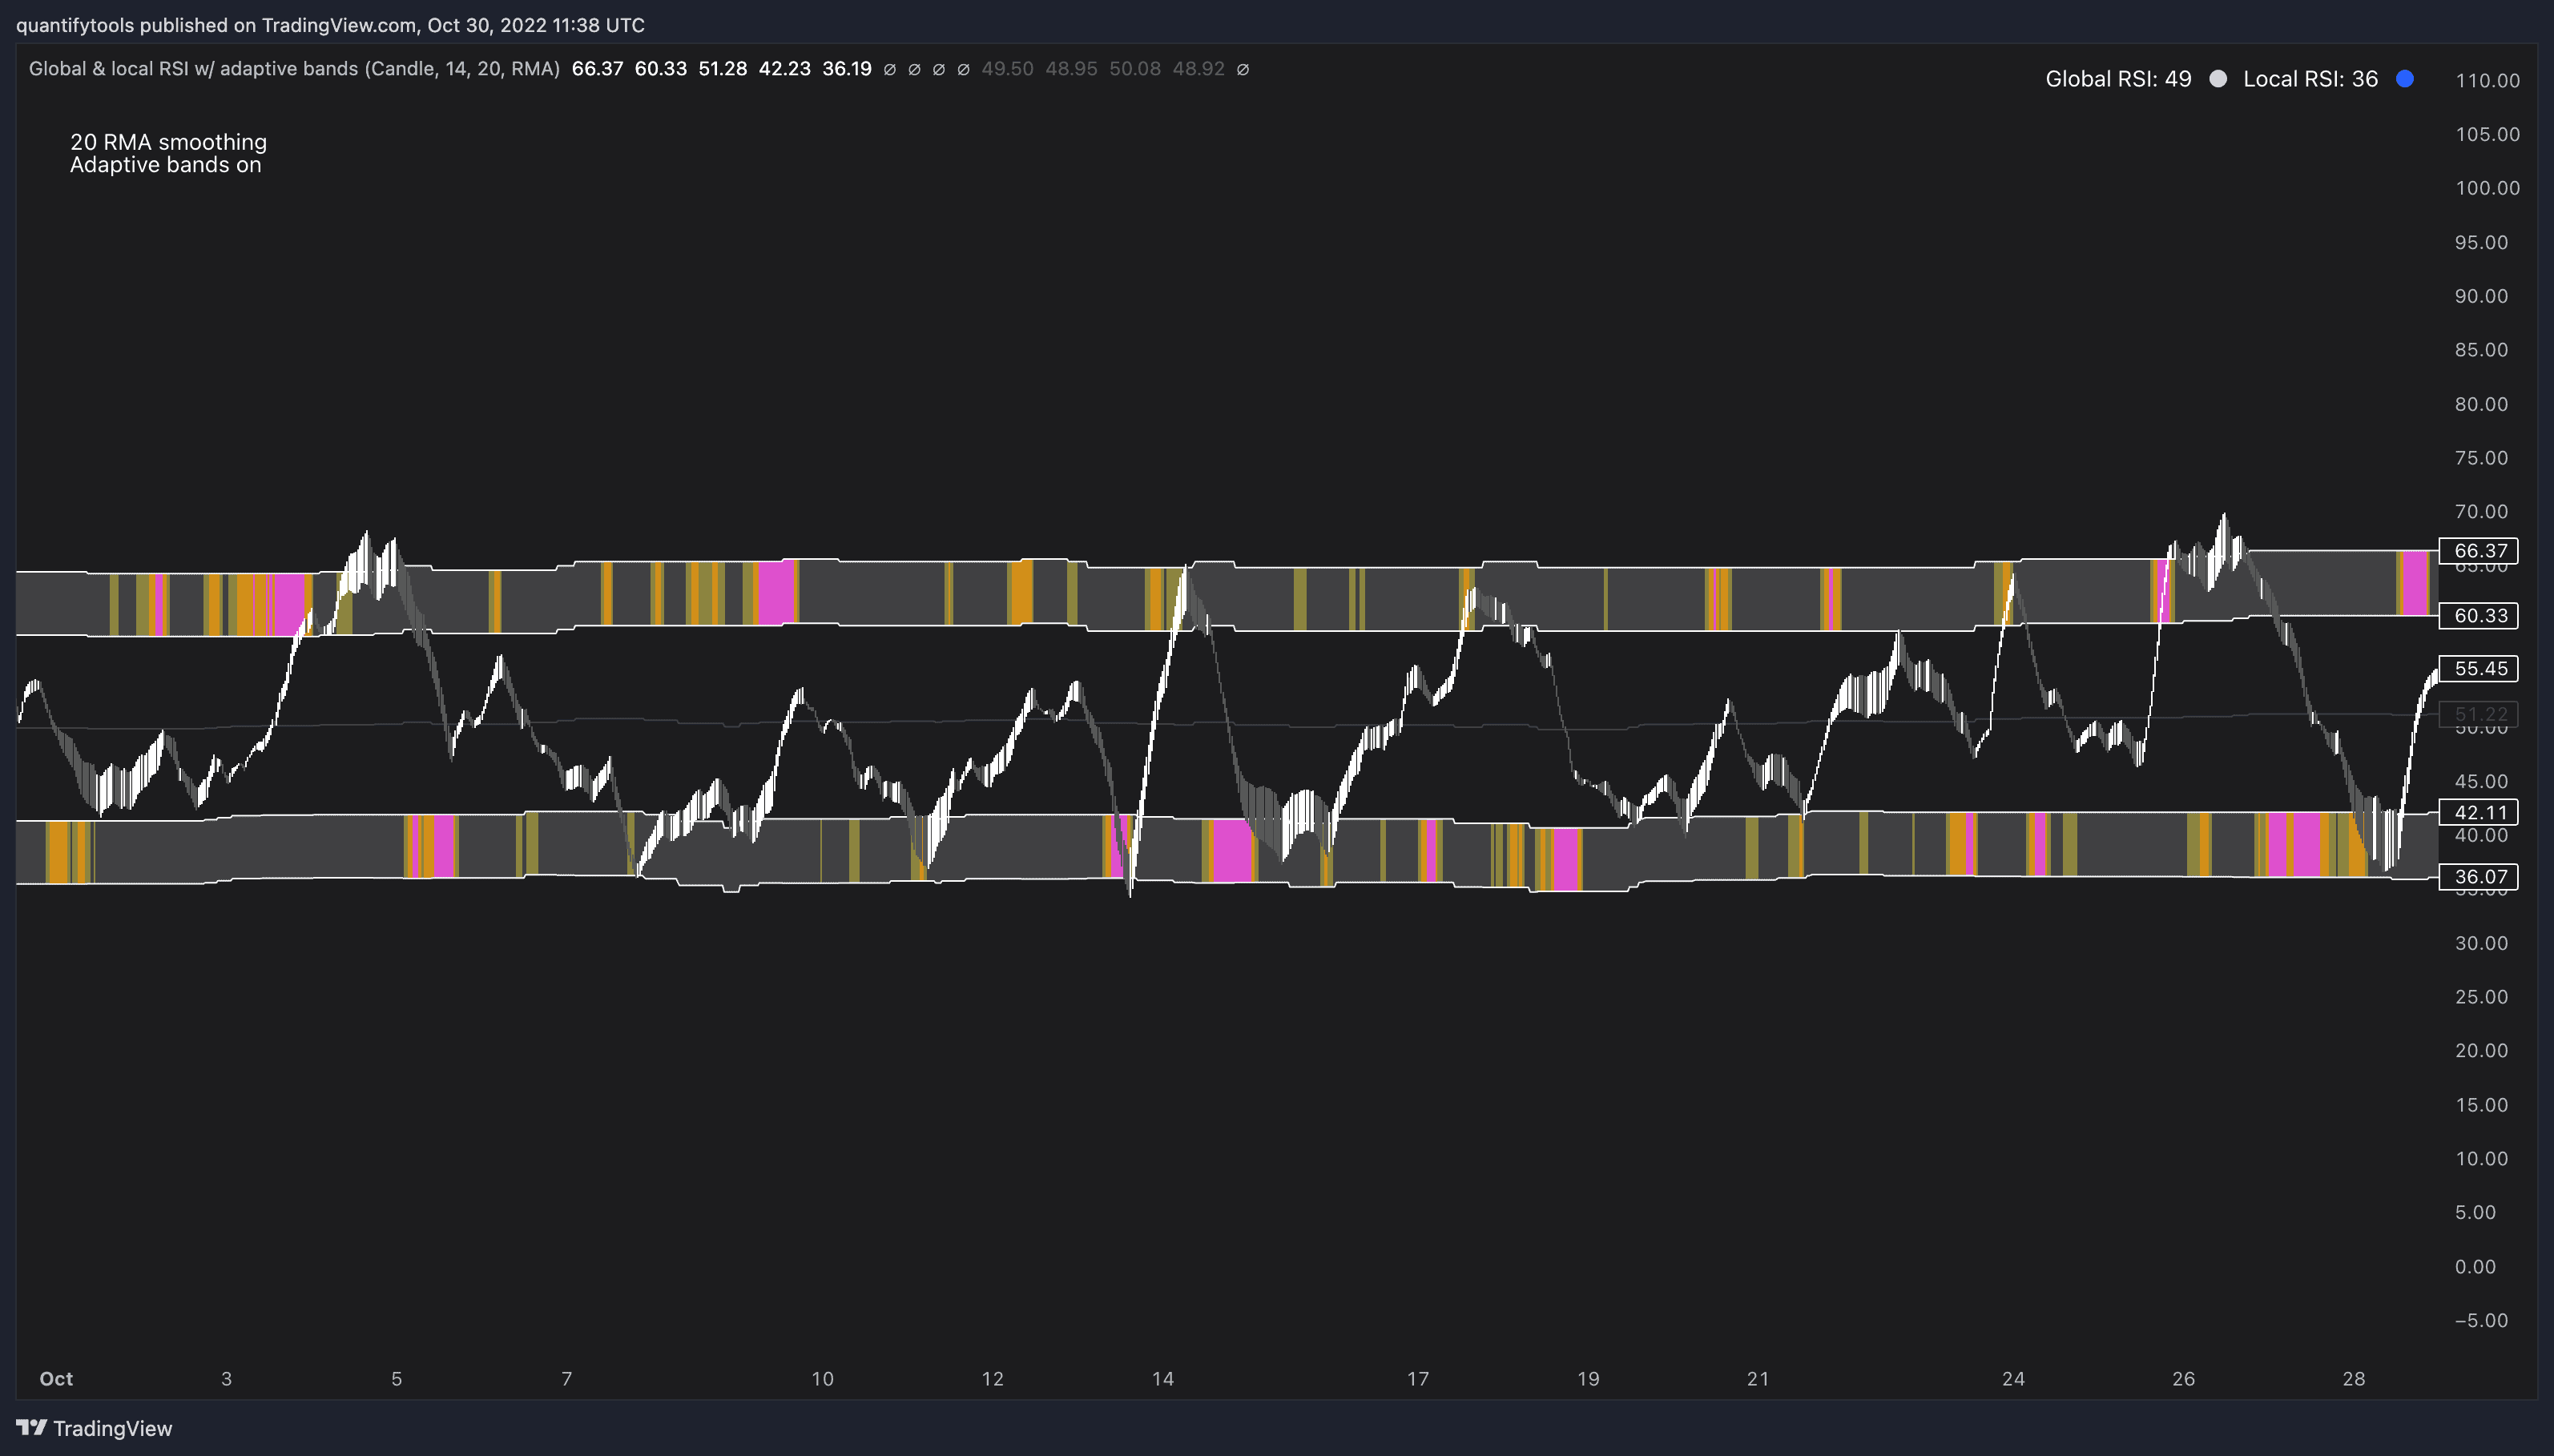
Stochastic RSI >= 75 = yellow
Stochastic RSI >= 87 = orange
Stochastic RSI >= 100 = pink
Adaptive bands
Users also have the ability smooth the RSI with their preferred smoothing method ( SMA , EMA , HMA , RMA, WMA ) and length. This leads to different behavior in RSI, rendering the typical RSI extremes (> 70 or < 30) suboptimal or even useless.
By enabling adaptive bands, the extremes are readjusted based on typical RSI pivot points (median pivots ), which gives much more relevant reference points for oversold/overbought conditions in both global and local RSI. This feature can be used without smoothing, but it rarely provides a meaningful difference, unless the RSI calculation length is messed with.
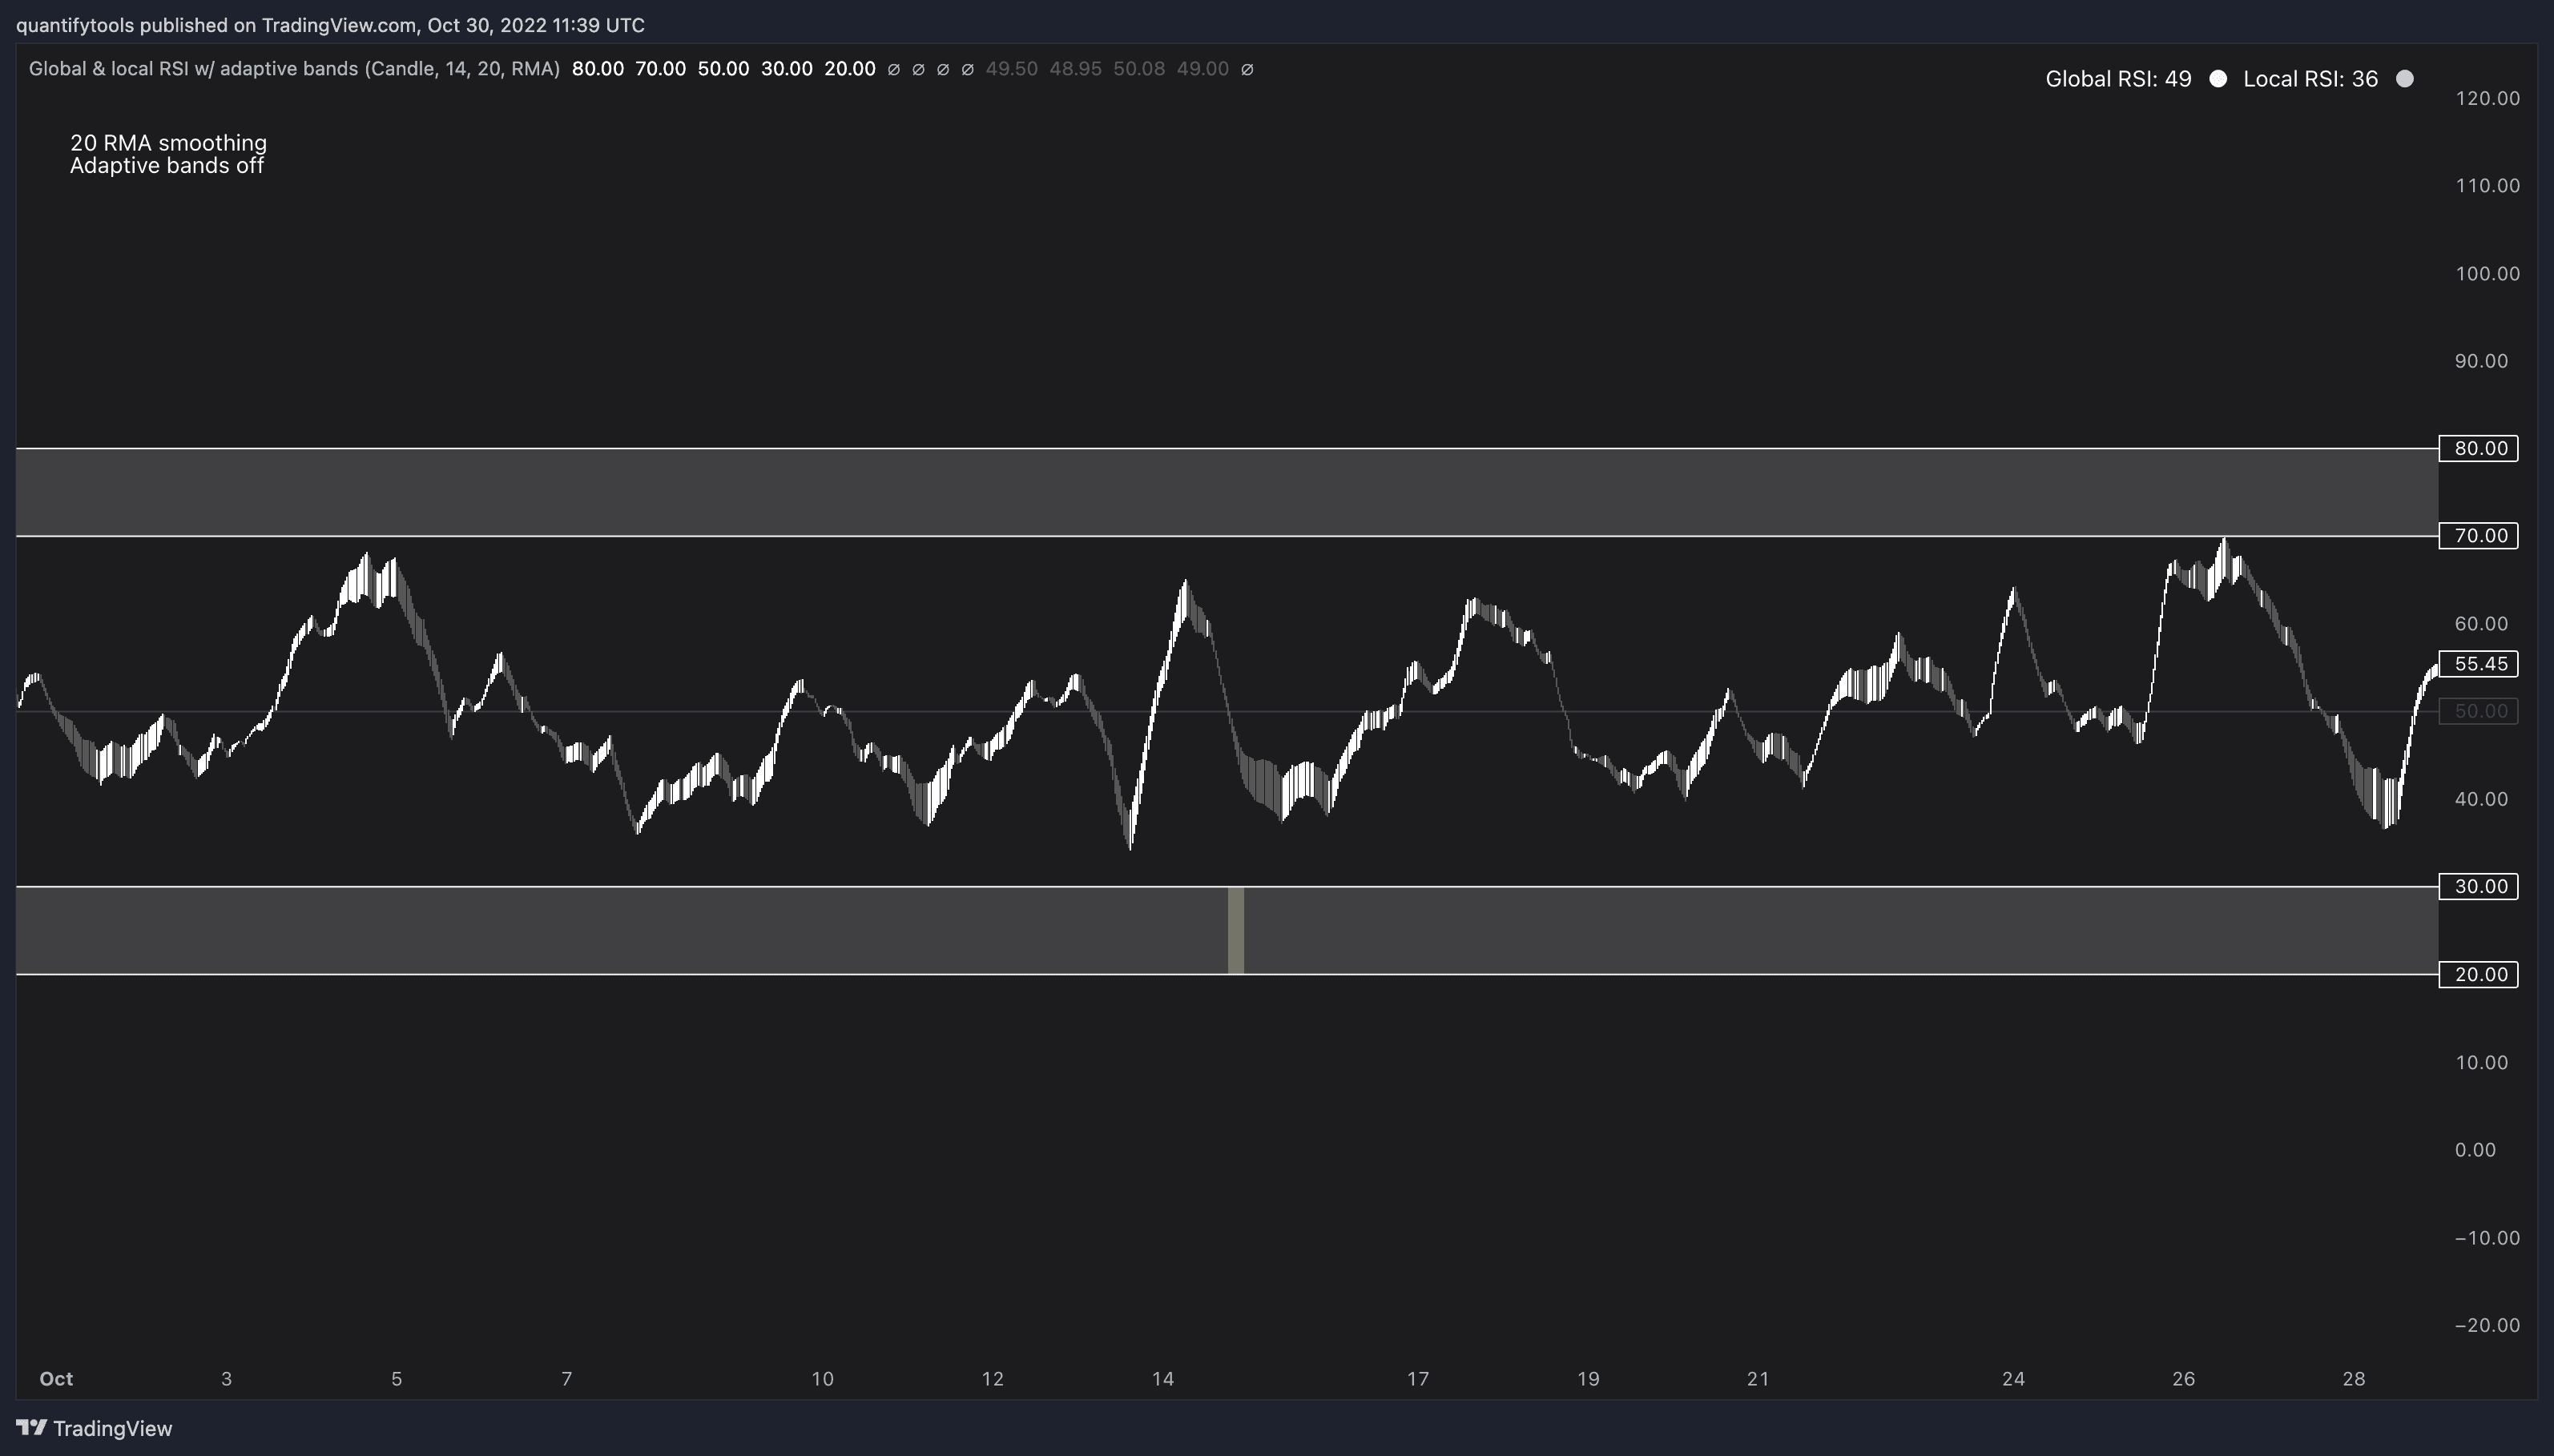
Adaptive bands disabled
When adaptive bands are disabled, extremes in RSI are static, but with smoothing on they might not be relevant.
Adaptive bands enabled
Enabling adaptive bands fixed the issue by learning how smoothed RSI has historically moved, identifying the extremes much better.
Stochastic RSI heatmap
The heatmap color visible on bands is applied using the following rules, based on stochastic RSI:
Stochastic RSI >= 75 = yellow
Stochastic RSI >= 87 = orange
Stochastic RSI >= 100 = pink
Adaptive bands
Users also have the ability smooth the RSI with their preferred smoothing method ( SMA , EMA , HMA , RMA, WMA ) and length. This leads to different behavior in RSI, rendering the typical RSI extremes (> 70 or < 30) suboptimal or even useless.
By enabling adaptive bands, the extremes are readjusted based on typical RSI pivot points (median pivots ), which gives much more relevant reference points for oversold/overbought conditions in both global and local RSI. This feature can be used without smoothing, but it rarely provides a meaningful difference, unless the RSI calculation length is messed with.
Adaptive bands disabled
When adaptive bands are disabled, extremes in RSI are static, but with smoothing on they might not be relevant.
Adaptive bands enabled
Enabling adaptive bands fixed the issue by learning how smoothed RSI has historically moved, identifying the extremes much better.
Using Global & local RSI in trading
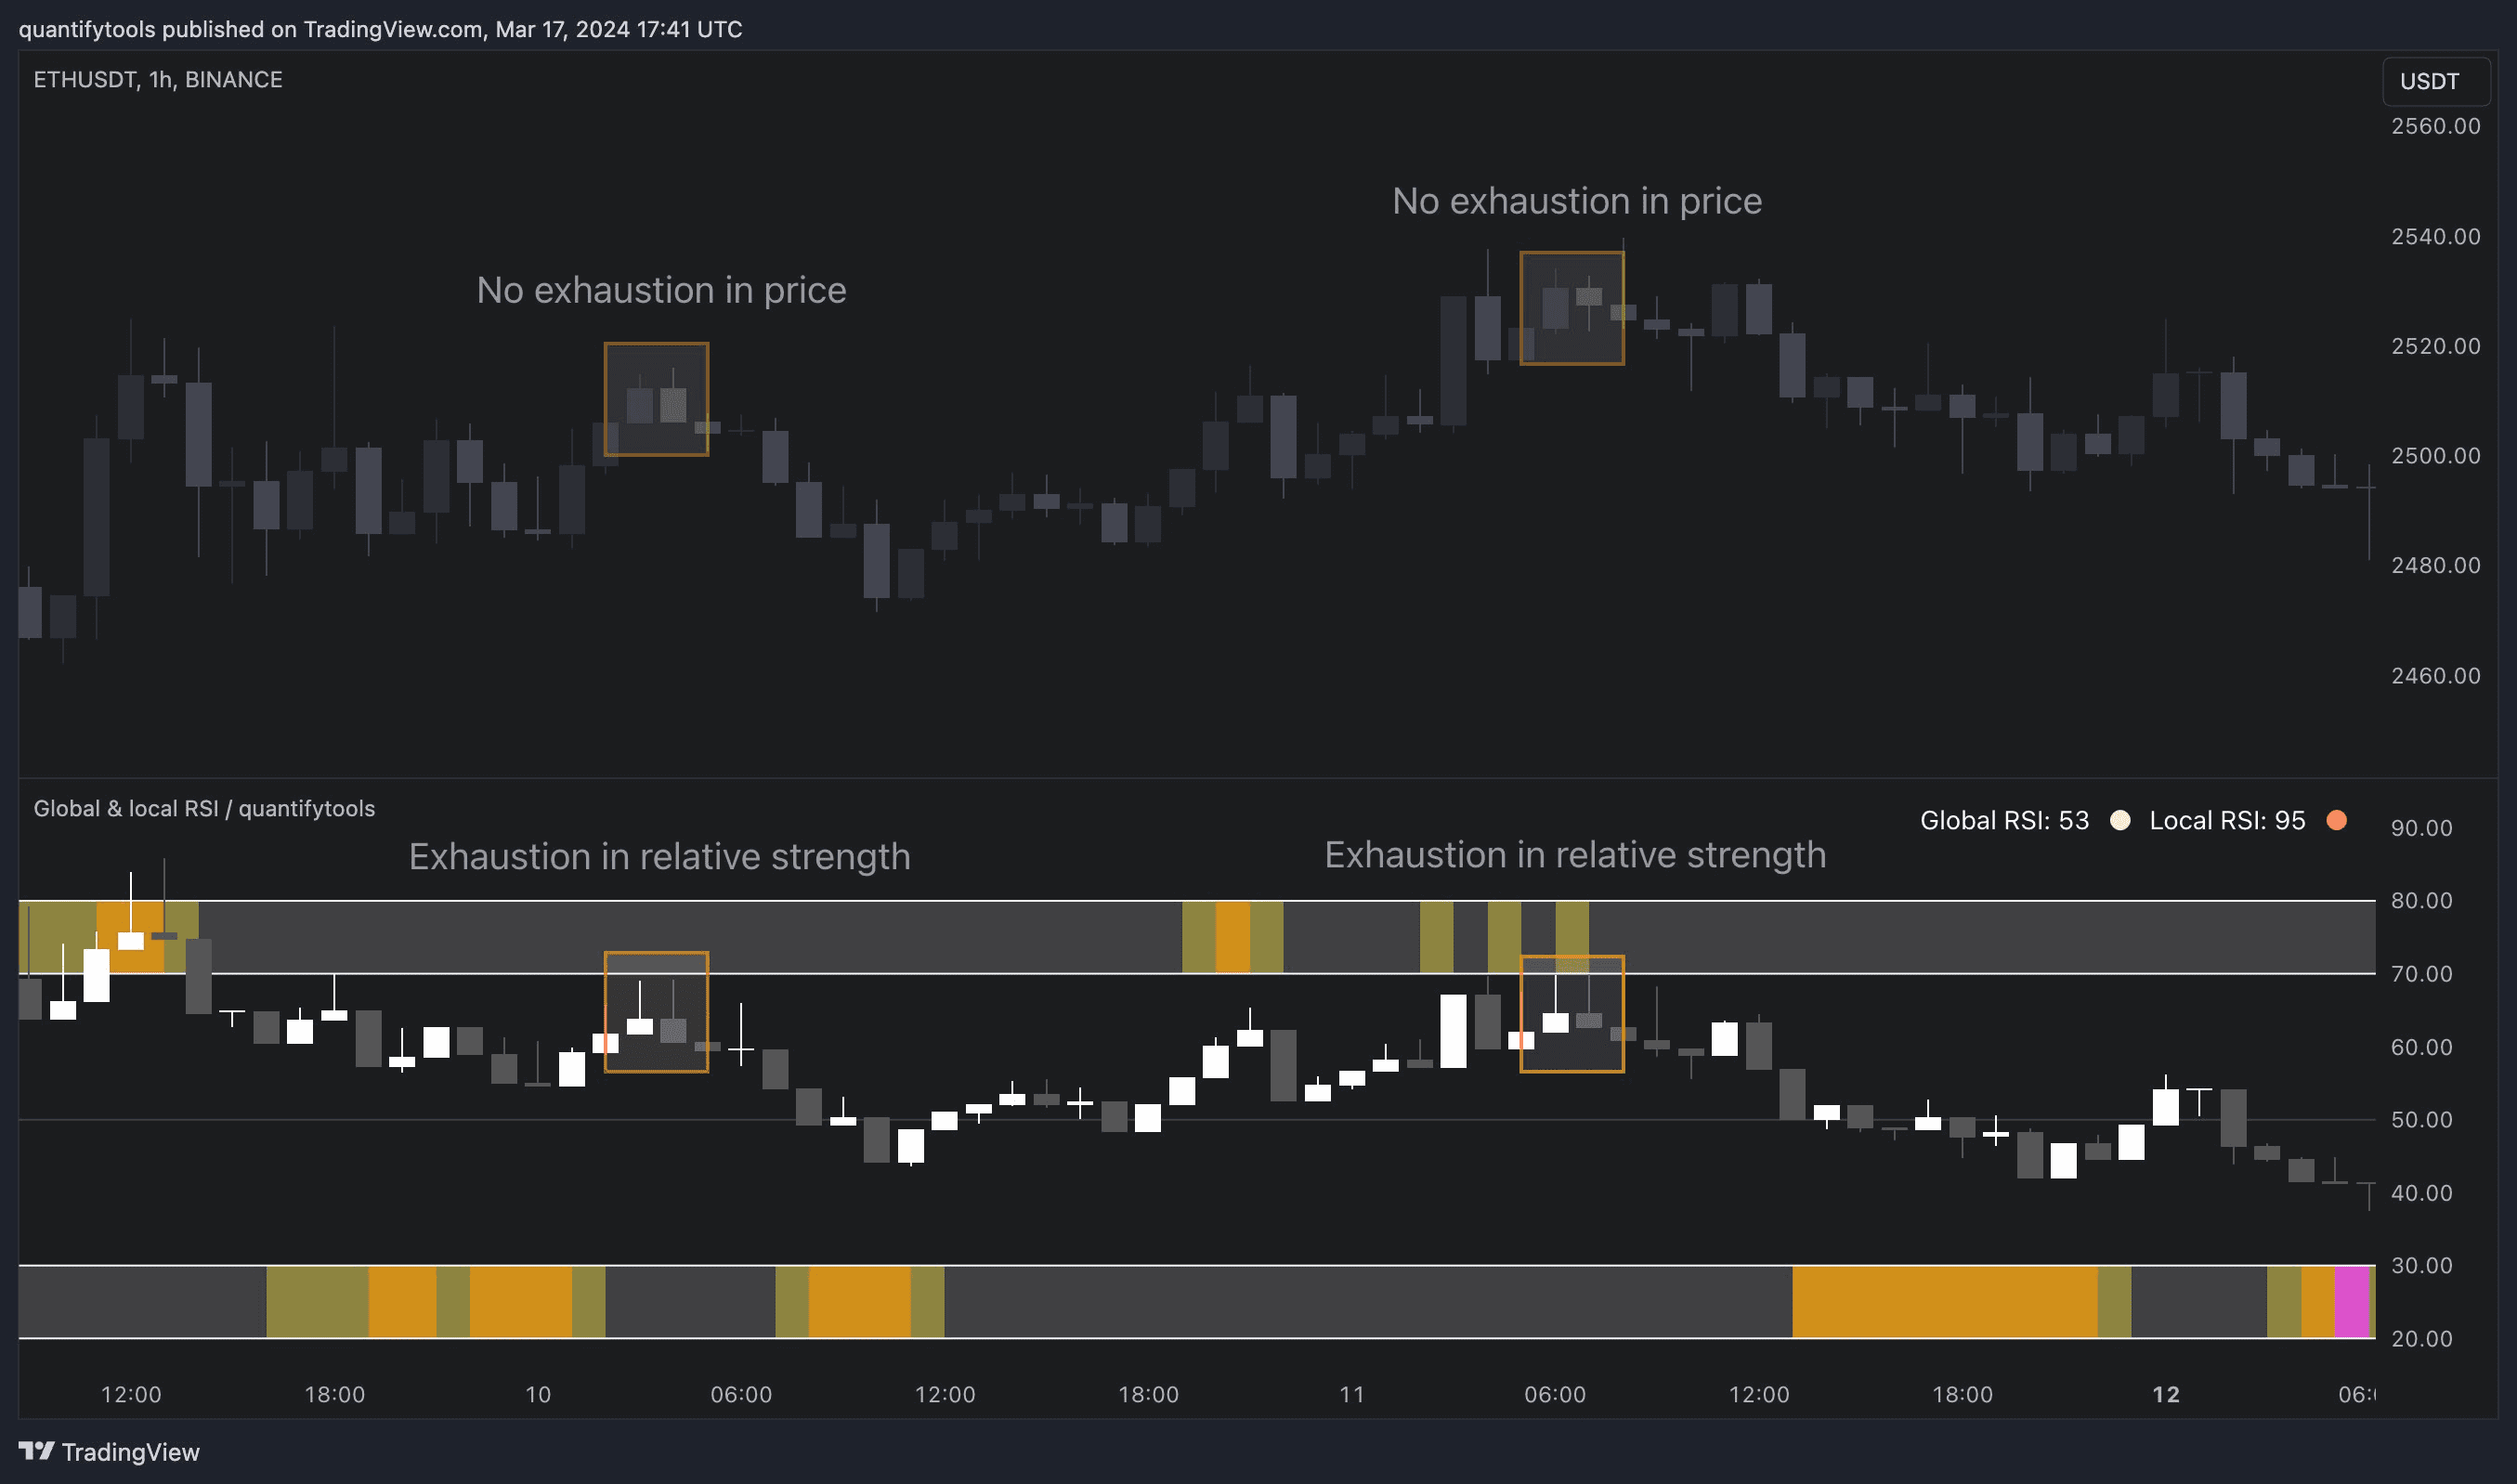
Global RSI can be plotted as candles, bars or a line. Candles and bars can be useful for detecting rejections (wicks) in relative strength, the same you would with OHLC data. Sometimes there are "hidden rejections" that are visible in relative strength but not on OHLC data, which naturally gives an advantage.
Using Global & local RSI in trading
Global RSI can be plotted as candles, bars or a line. Candles and bars can be useful for detecting rejections (wicks) in relative strength, the same you would with OHLC data. Sometimes there are "hidden rejections" that are visible in relative strength but not on OHLC data, which naturally gives an advantage.
Get Global & local RSI on TradingView
Find TradingView indicators easily by opening up any chart on TradingView (e.g. TSLA) and clicking Indicators tab on top menu. To find all our tools, search "quantifytools" and click an indicator to add to your chart.
TradingView page
Global & local RSI on TradingView ↗


