

Key features and settings
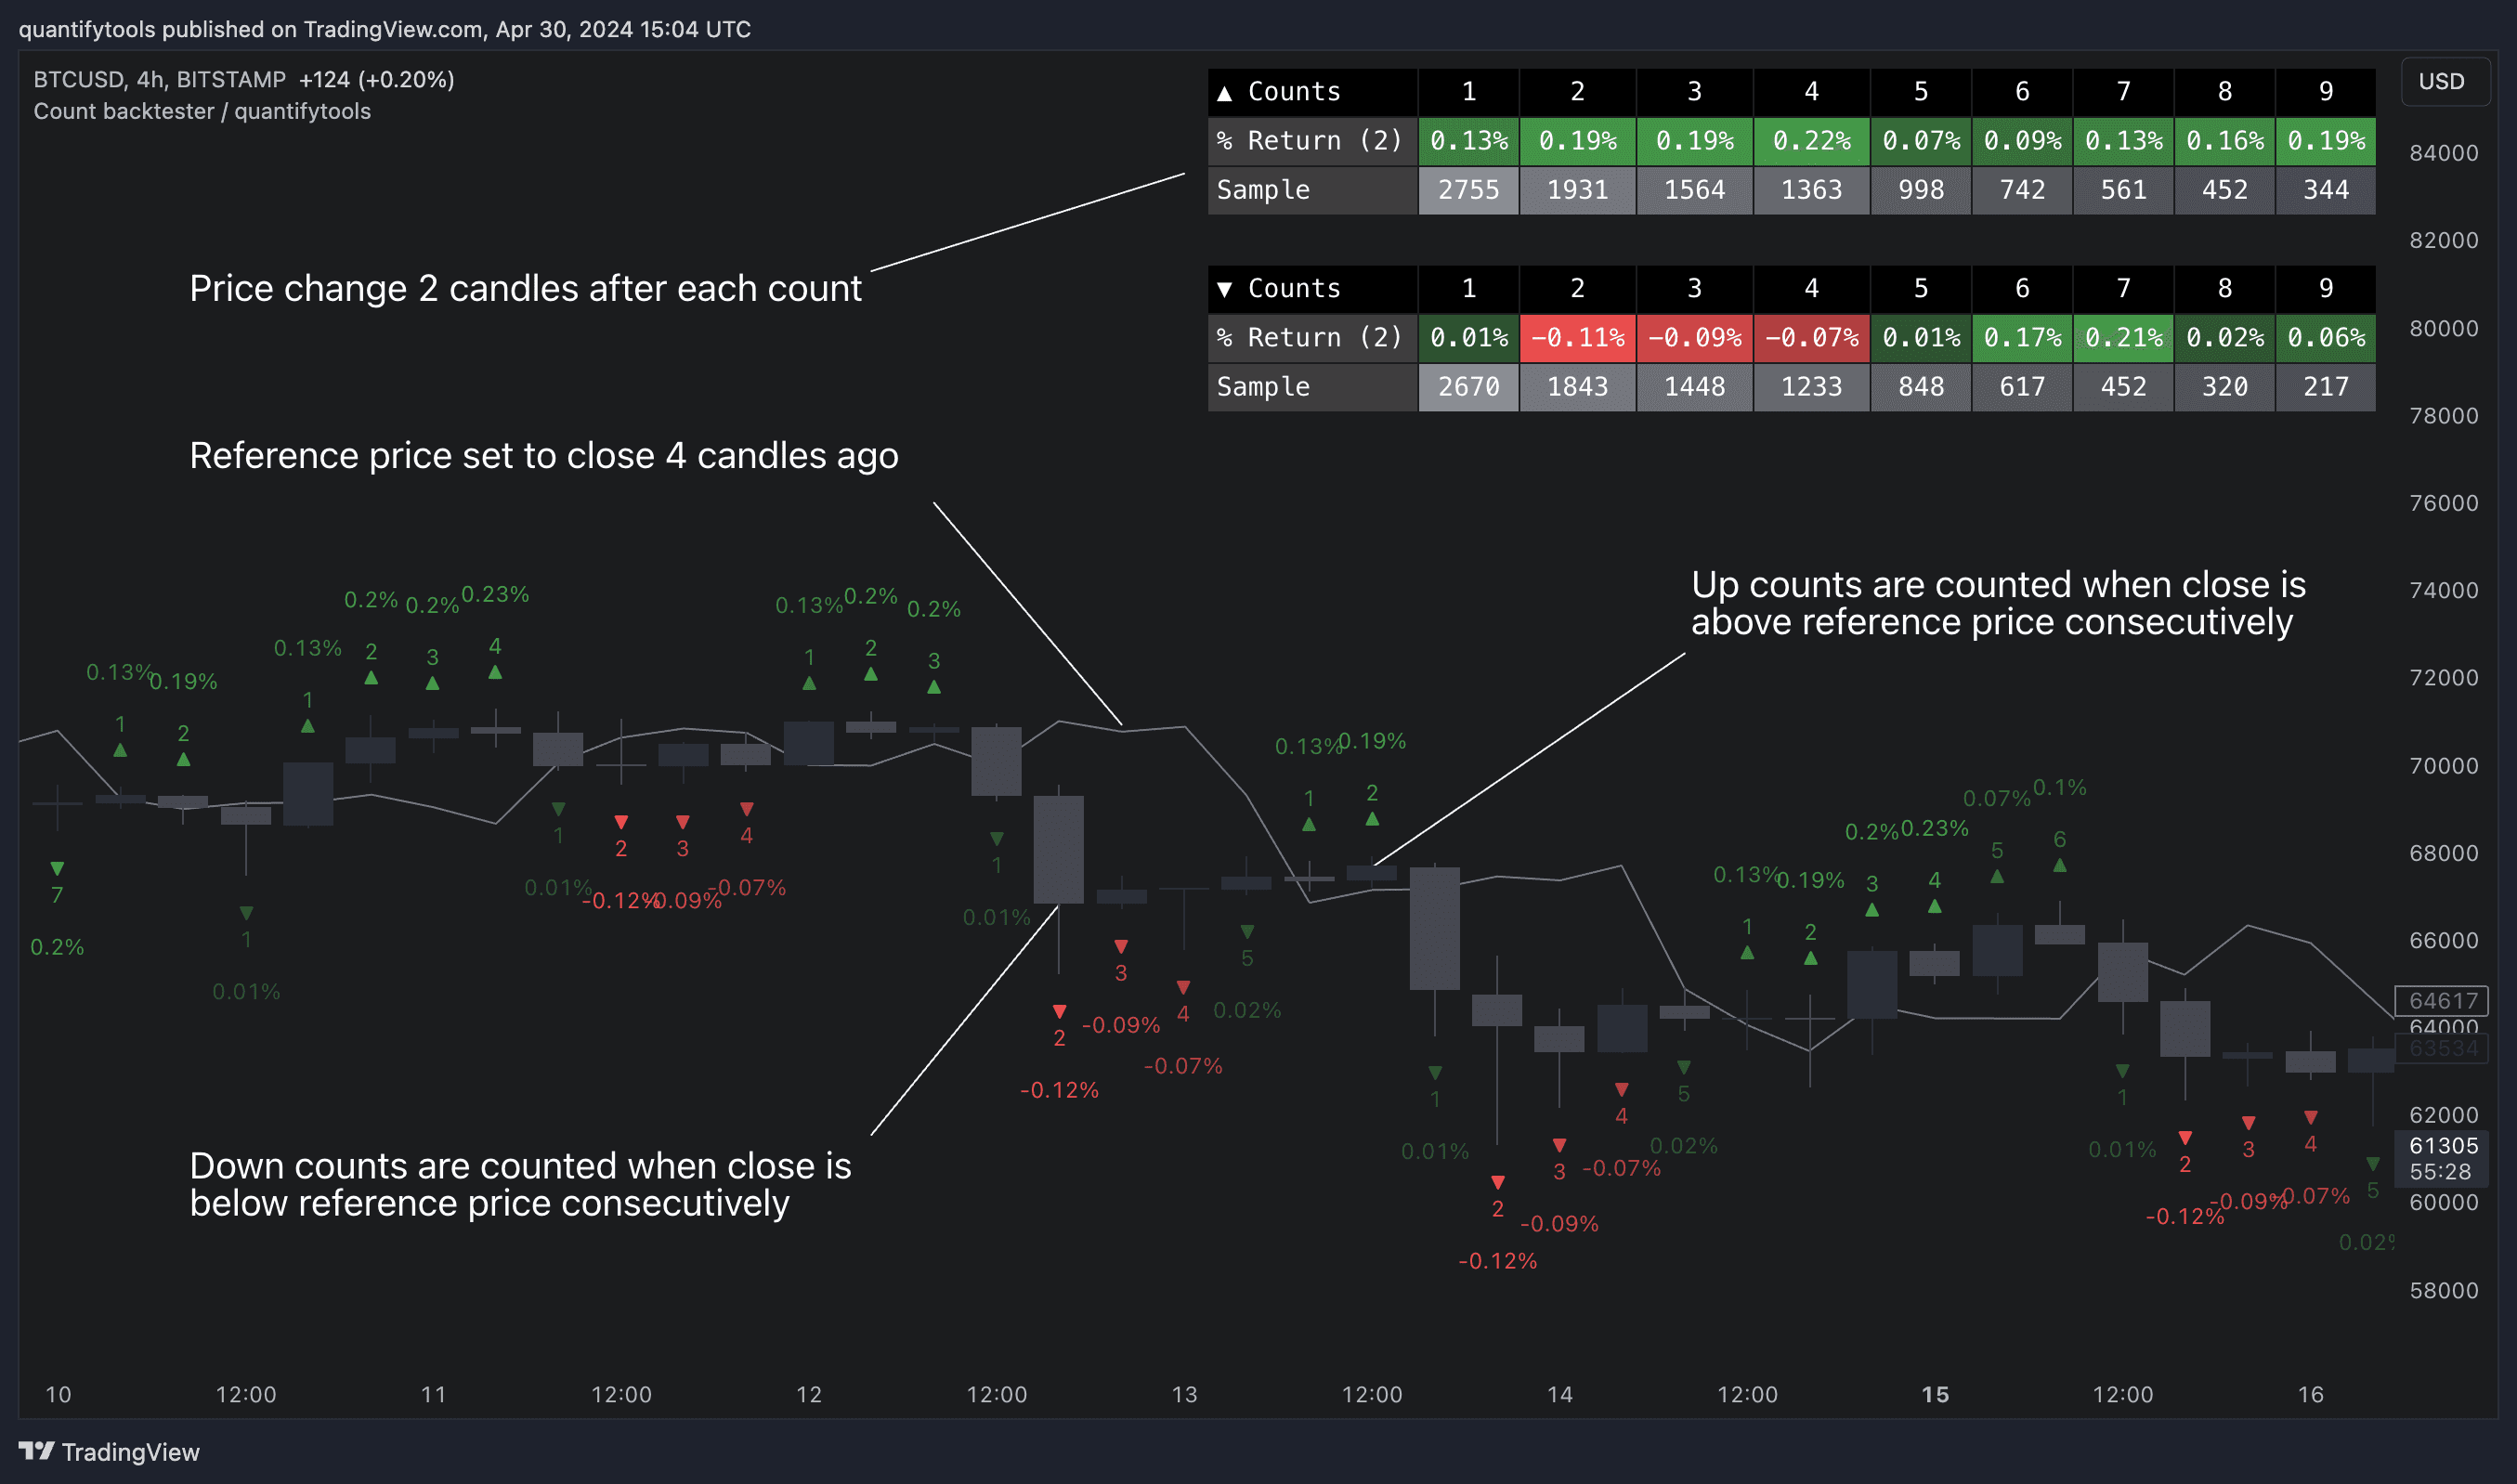
This tool provides the means to backtest each count by measuring % change in price after each count (e.g. % gain 2 candles after a given count).
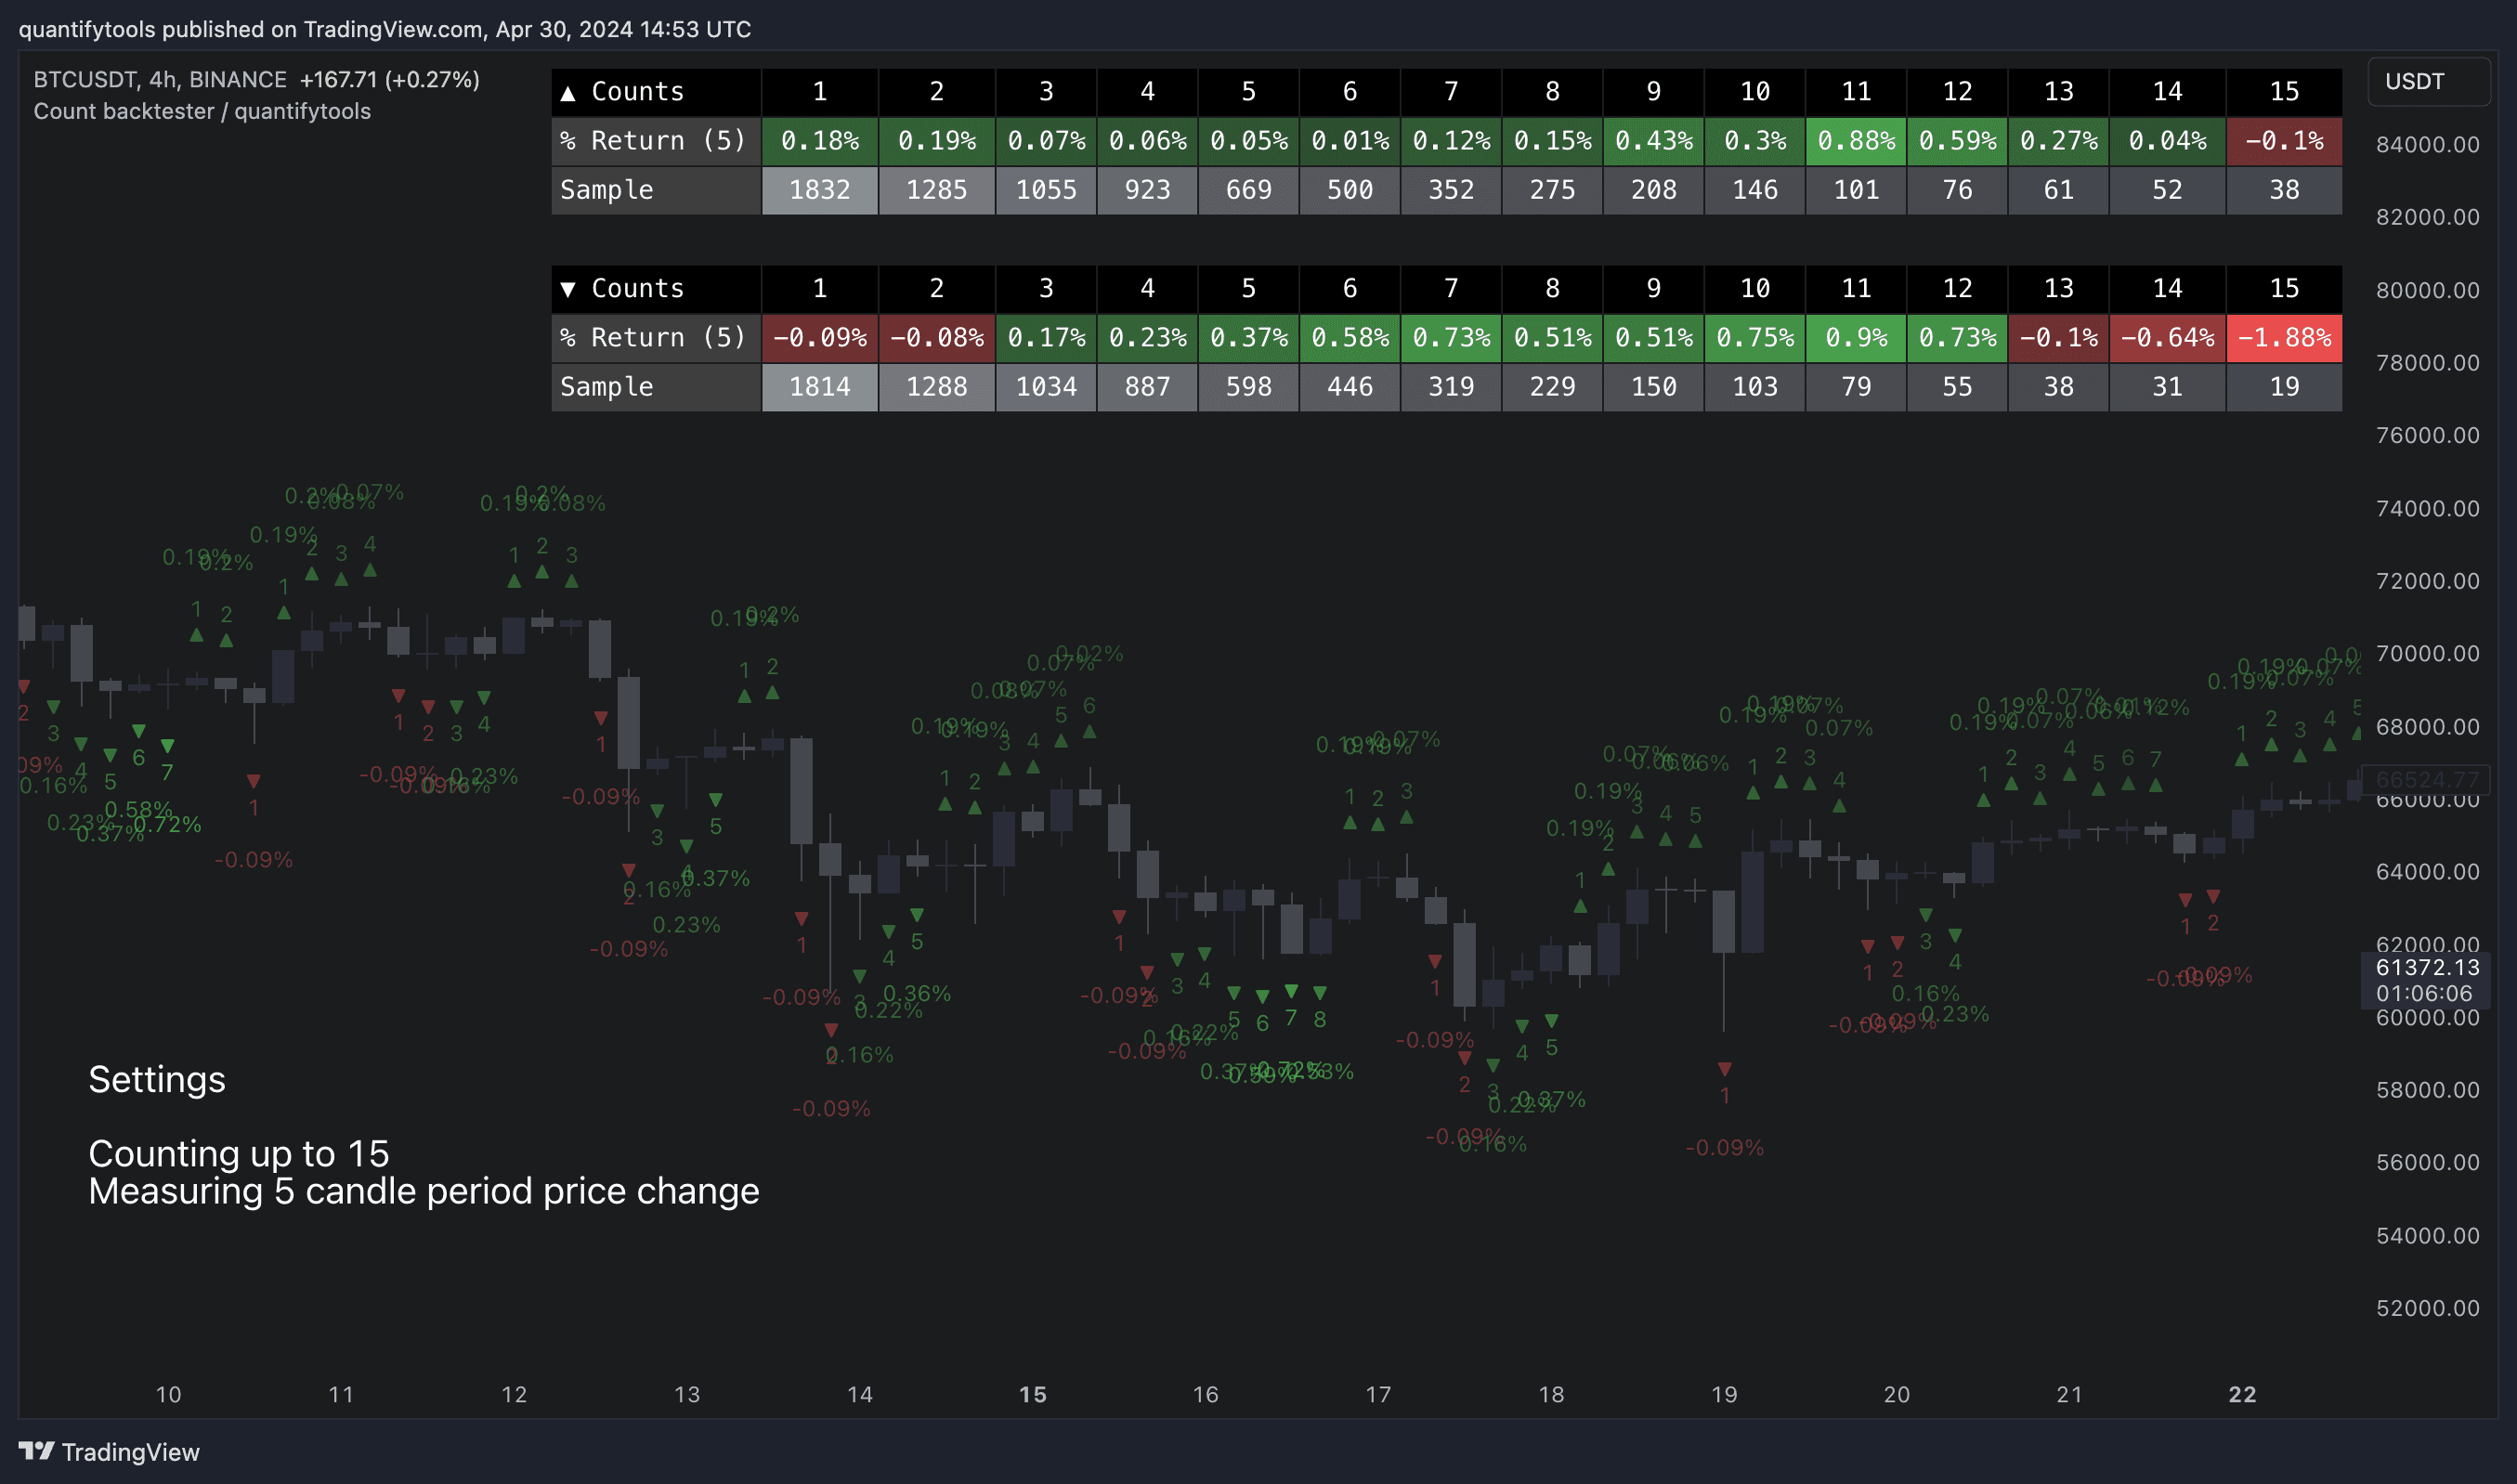
Customize maximum count
Users can define reference source that starts the consecutive count (e.g. close 4 candles ago), maximum count where counter resets (e.g. after 9th count) and backtesting period (e.g. price change 2 candles after count).
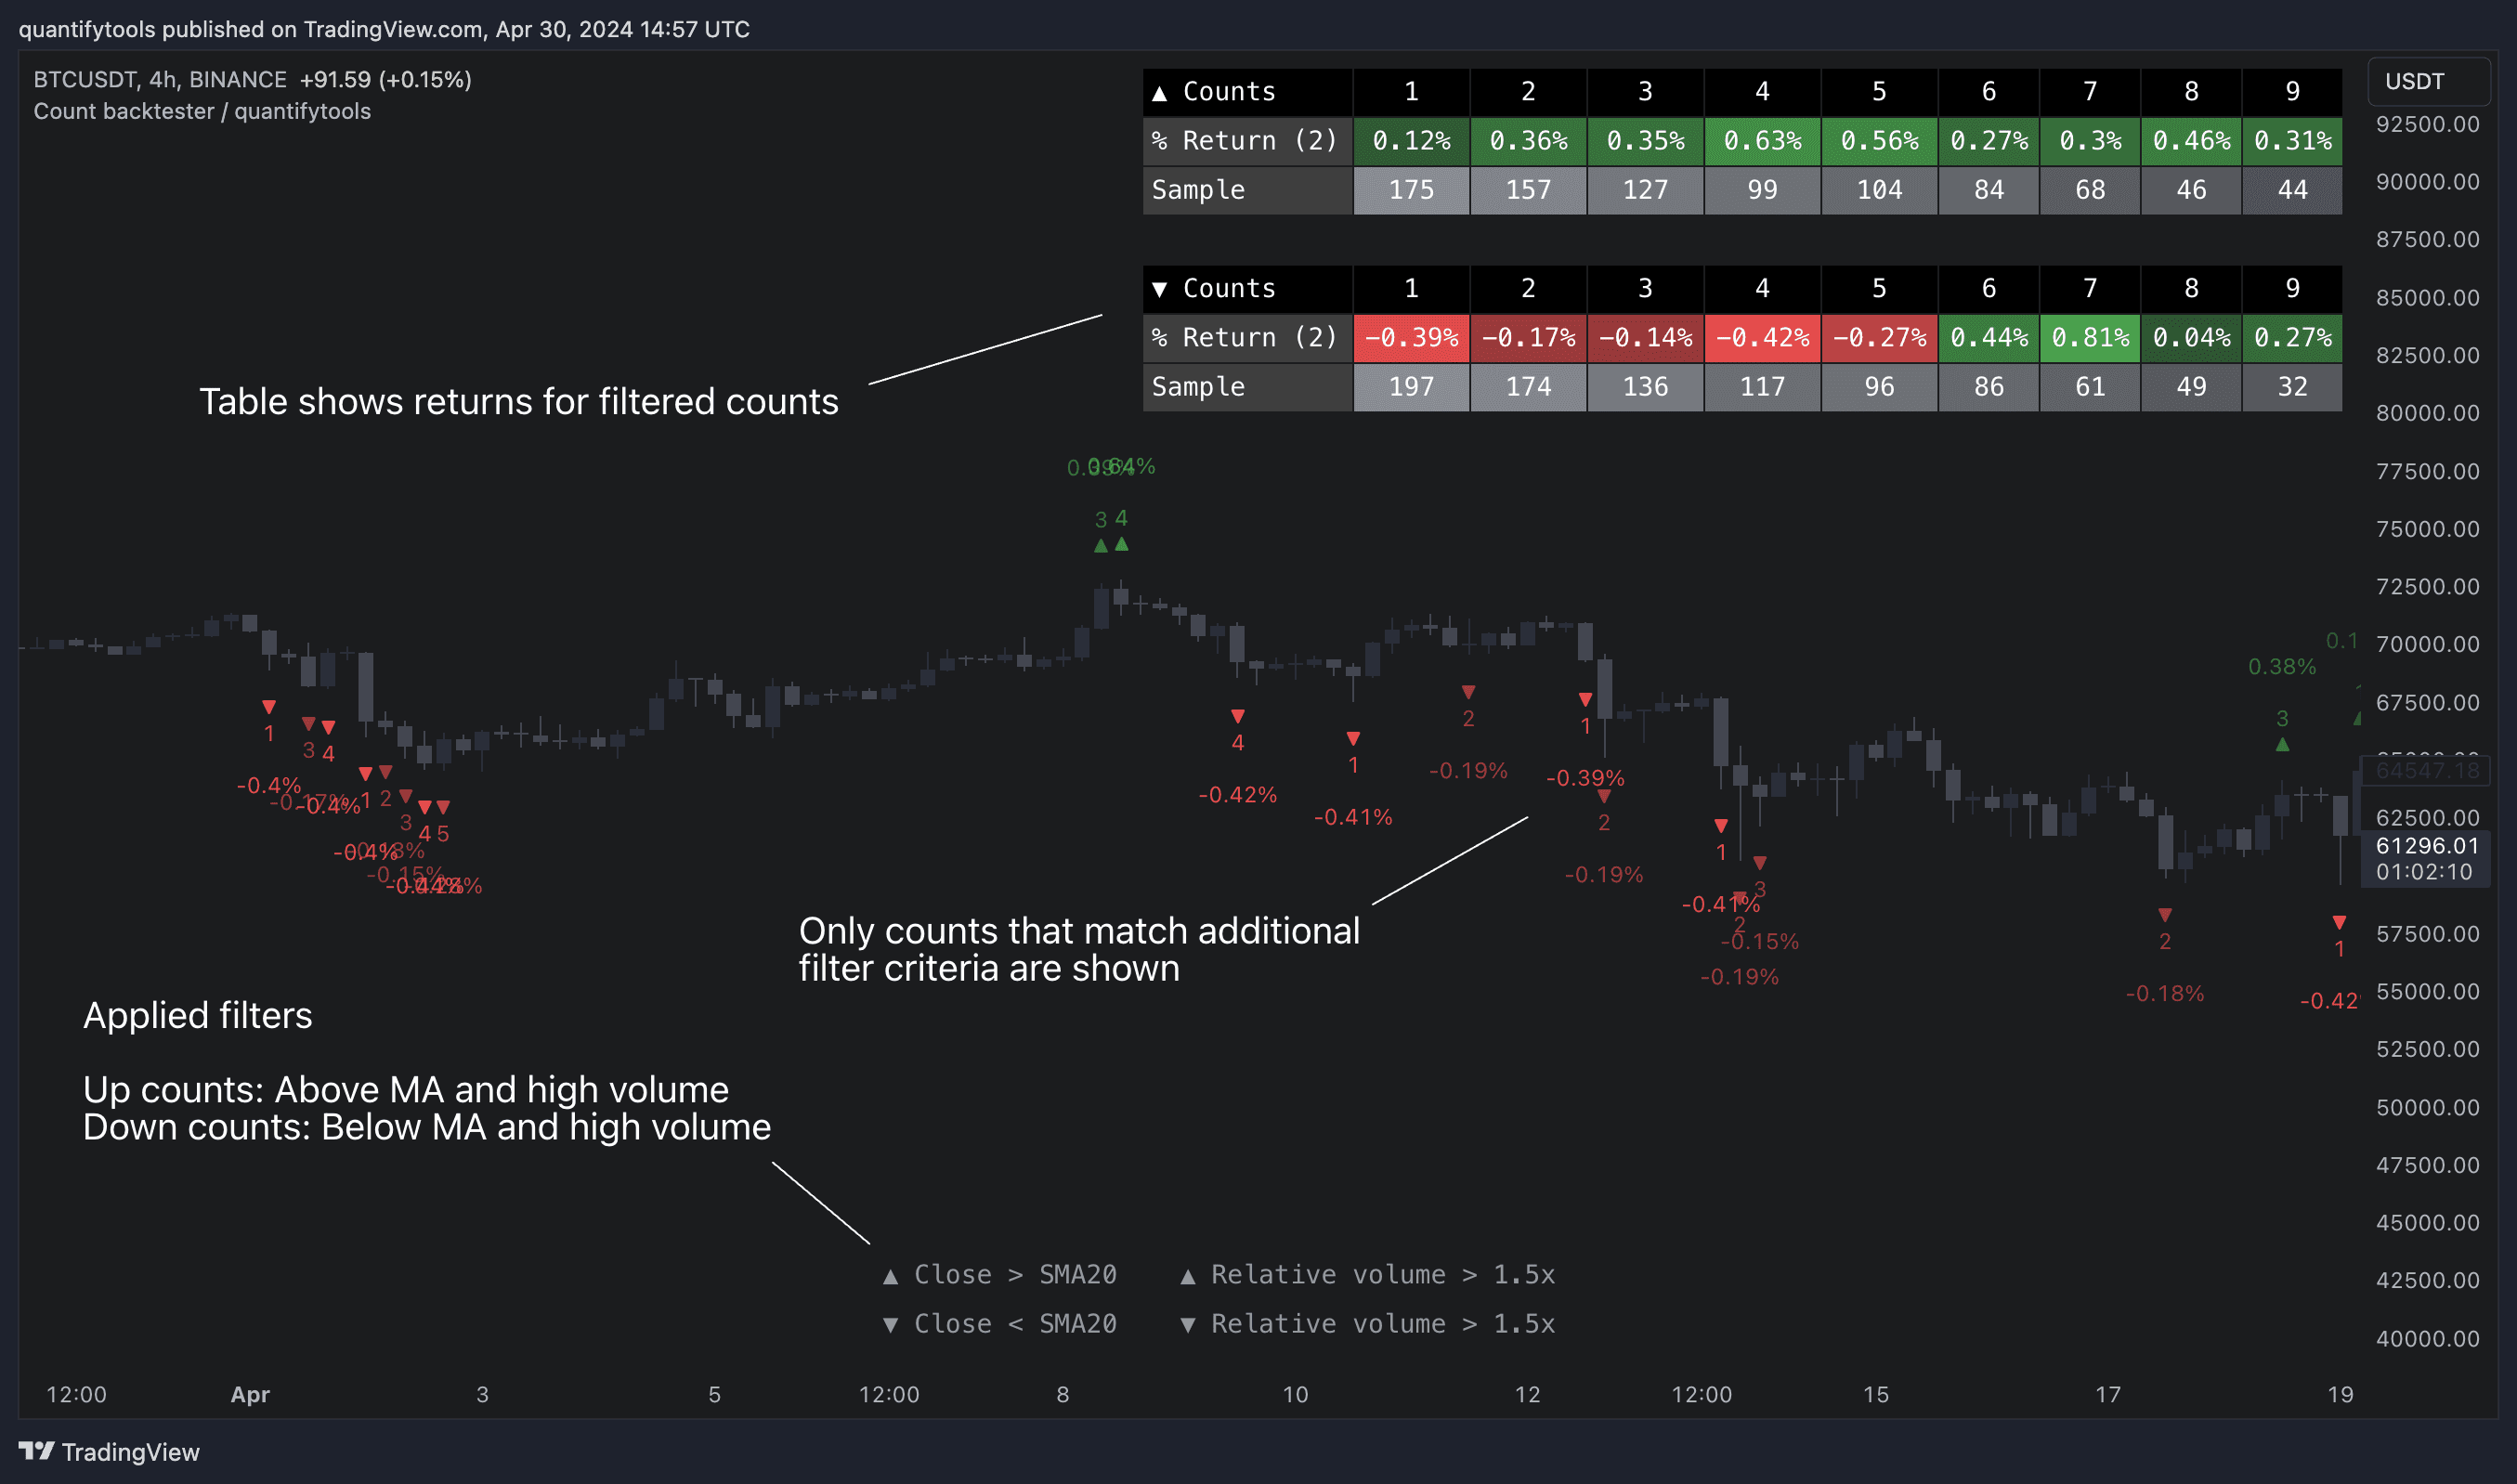
Add indicator filters
Filters add extra conditions that must be met on the consecutive count to qualify as valid, which are also reflected on the backtest metrics. The counts can be refined using the following filters:
- RSI above/below X
- Price above/below/at moving average of choice
- Relative volume above/below X
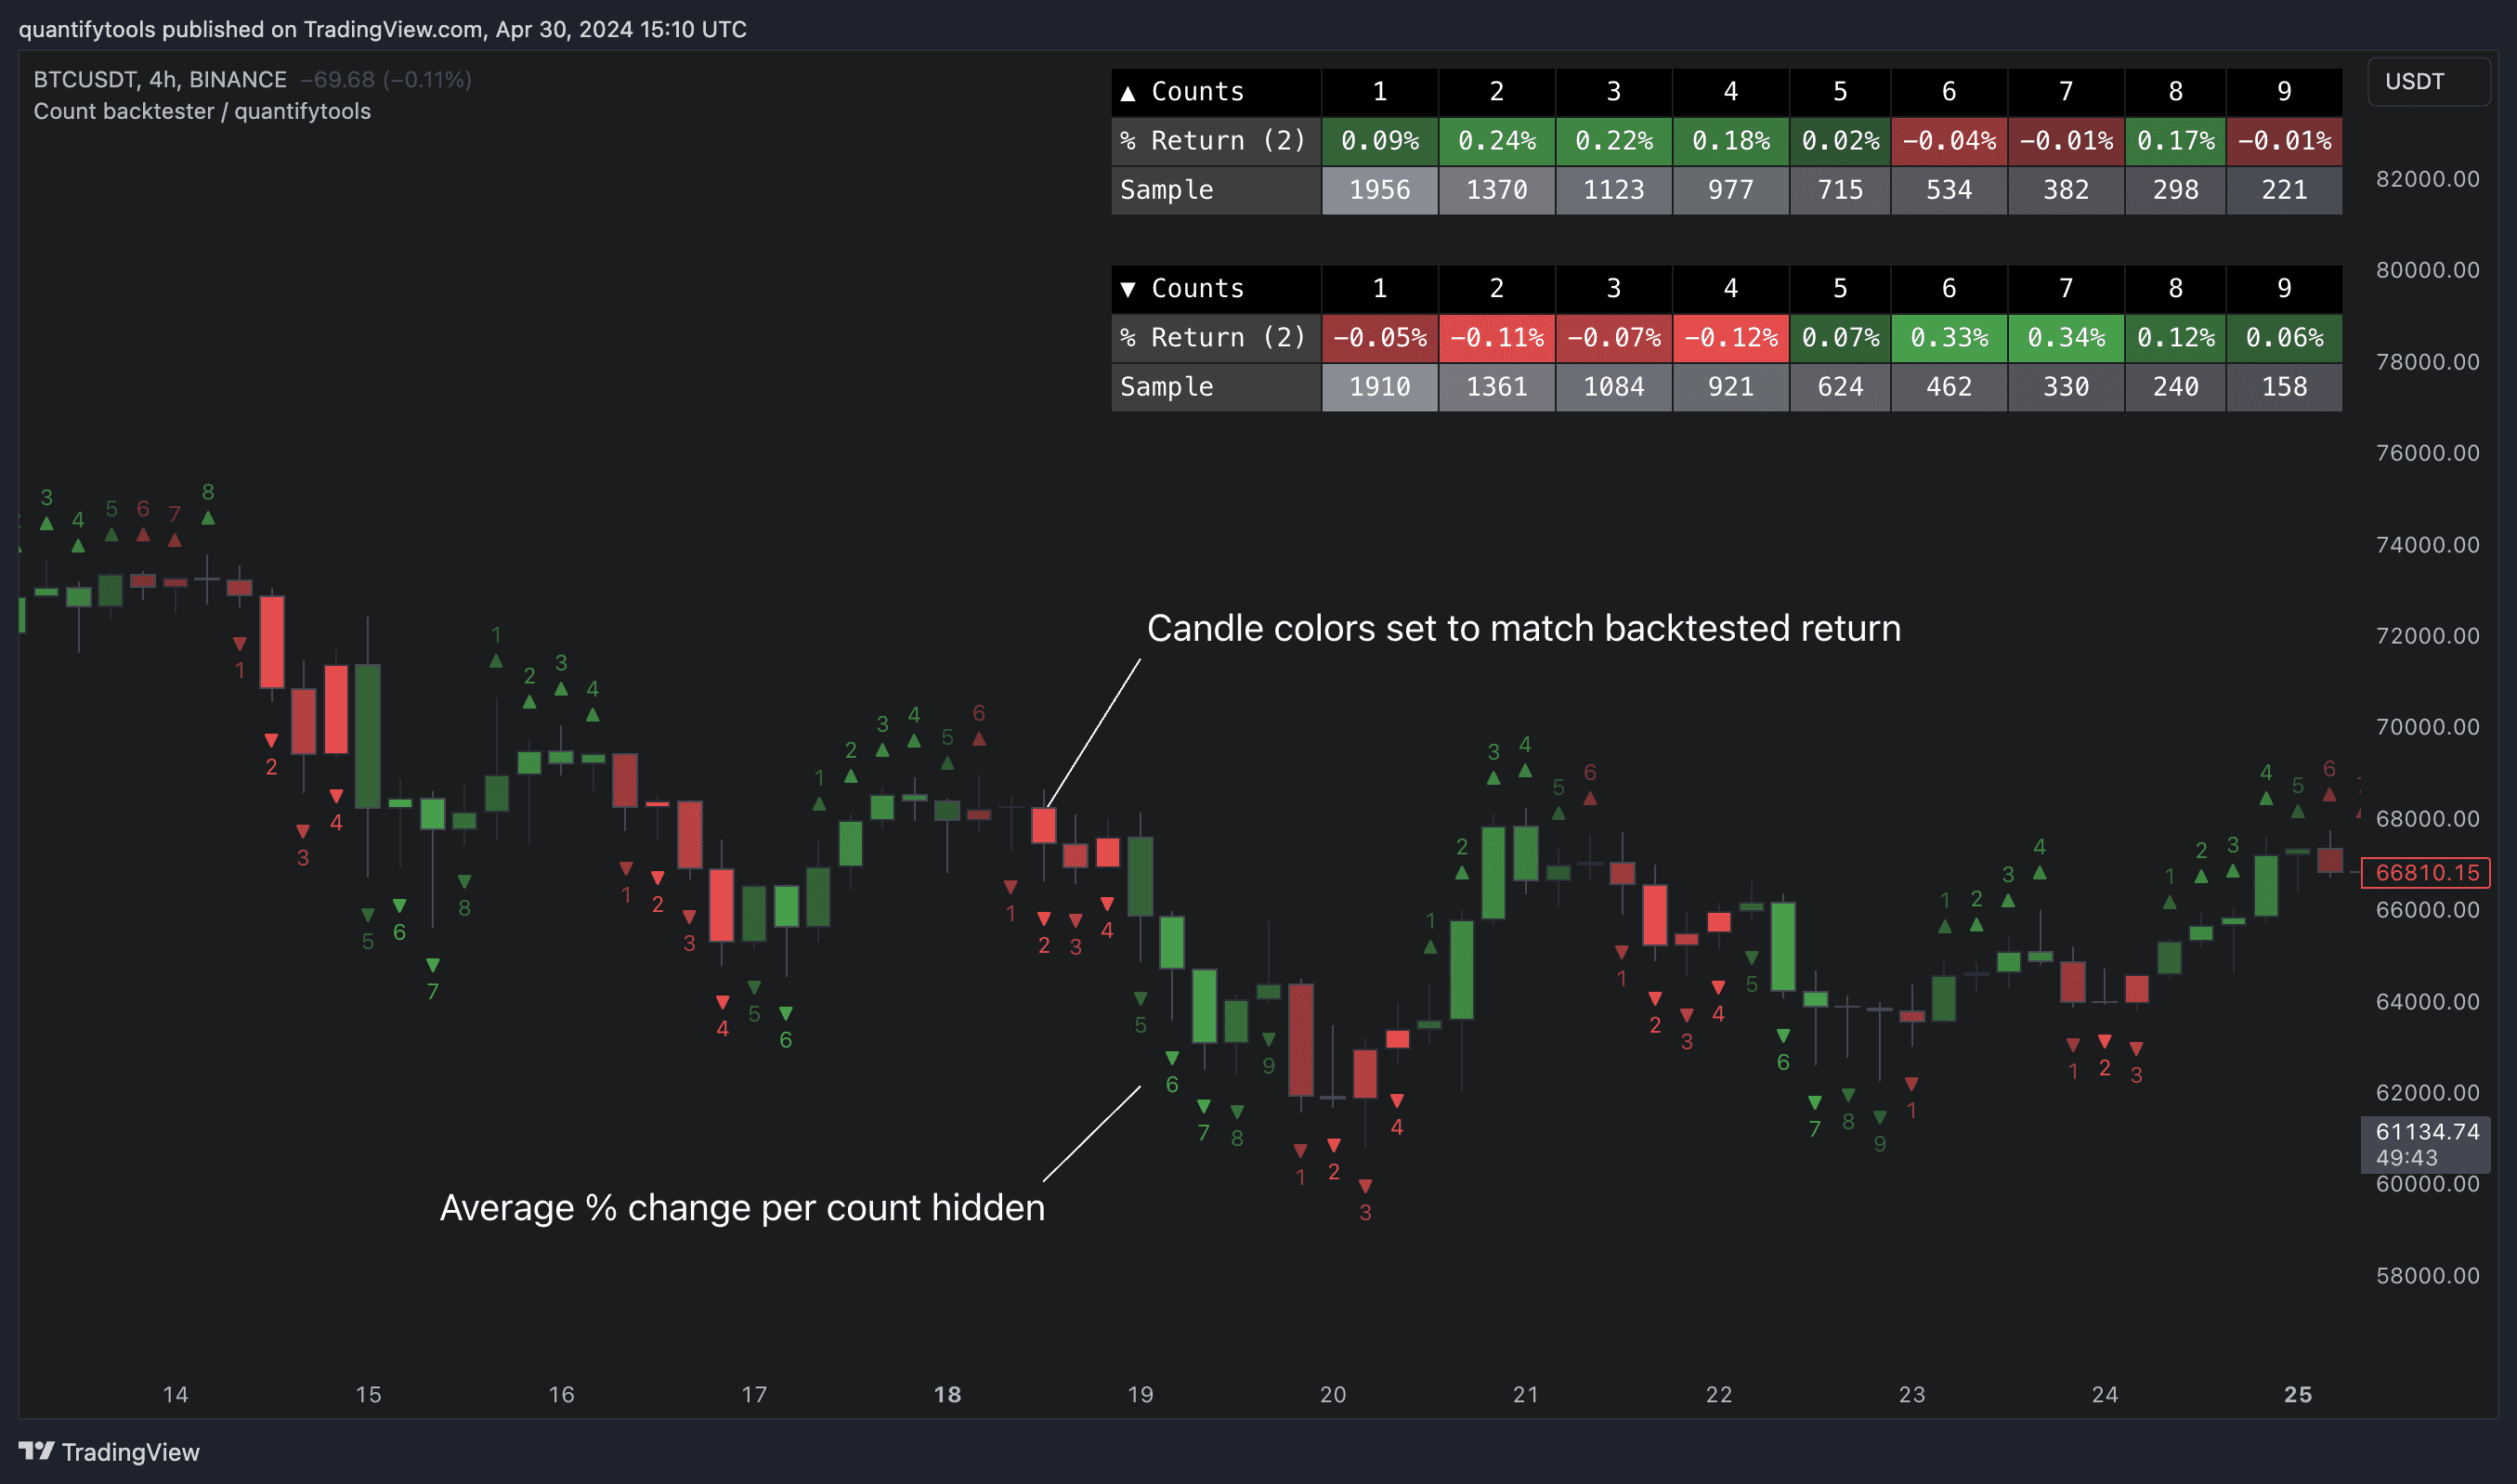
Backtest consecutive counts
Average gain corresponding to each count as they occur can be toggled off for less clutter. Average price change can also be visualized using candle color. Colors, gradient and table/label sizes are fully customizable.
Key features and settings
This tool provides the means to backtest each count by measuring % change in price after each count (e.g. % gain 2 candles after a given count).
Customize maximum count
Users can define reference source that starts the consecutive count (e.g. close 4 candles ago), maximum count where counter resets (e.g. after 9th count) and backtesting period (e.g. price change 2 candles after count).
Add indicator filters
Filters add extra conditions that must be met on the consecutive count to qualify as valid, which are also reflected on the backtest metrics. The counts can be refined using the following filters:
- RSI above/below X
- Price above/below/at moving average of choice
- Relative volume above/below X
Backtest consecutive counts
Average gain corresponding to each count as they occur can be toggled off for less clutter. Average price change can also be visualized using candle color. Colors, gradient and table/label sizes are fully customizable.
How to use consecutive counts in trading
Consecutive counting is a simple yet effective method to for detecting reversals, for which 7-9 counts are traditionally used. Whether that holds true or not can now be put through a test with different variations of the method as well as using additional filters to improve the probability of a turn.
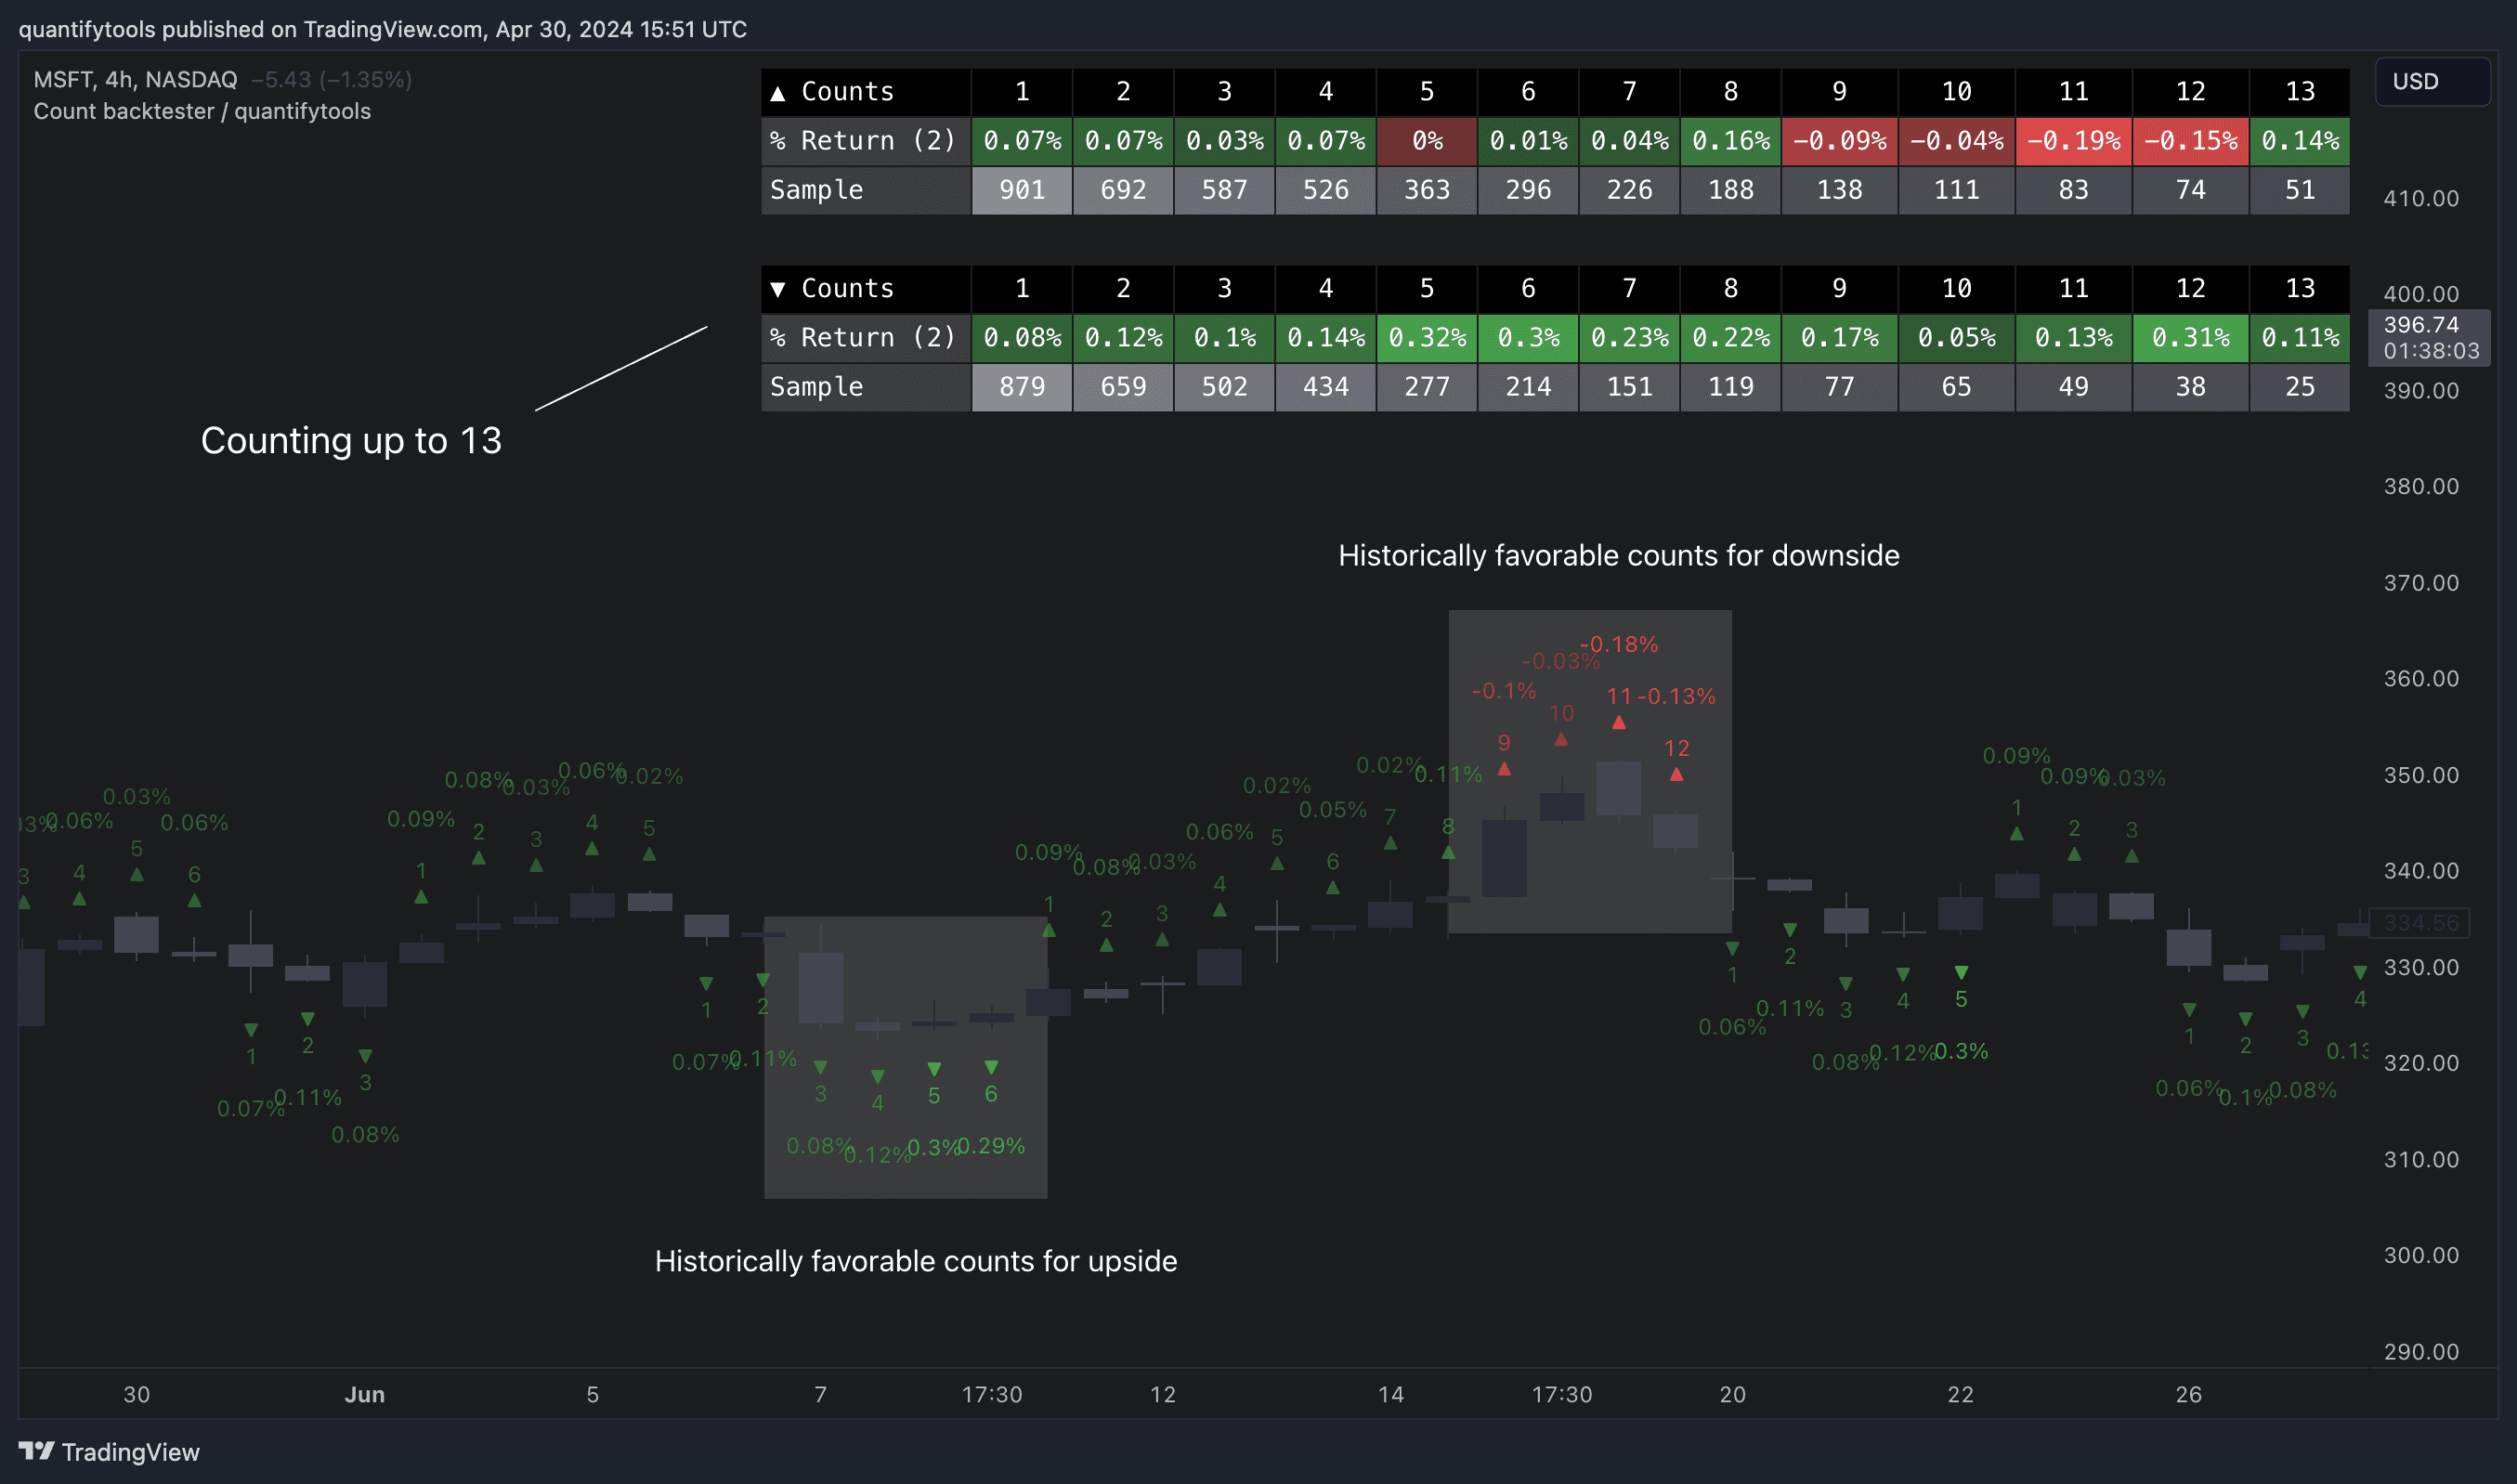
Identify reversal counts
Now that we have backtesting data, we can confirm which counts actually perform the best and see if popular ideas hold true, such as using the 9 count for reversals. In this example when counting up to 13, we can see that for up counts 11 and 12 are most favorable for downside. For down counts 4, 5 and 6 are most favorable.
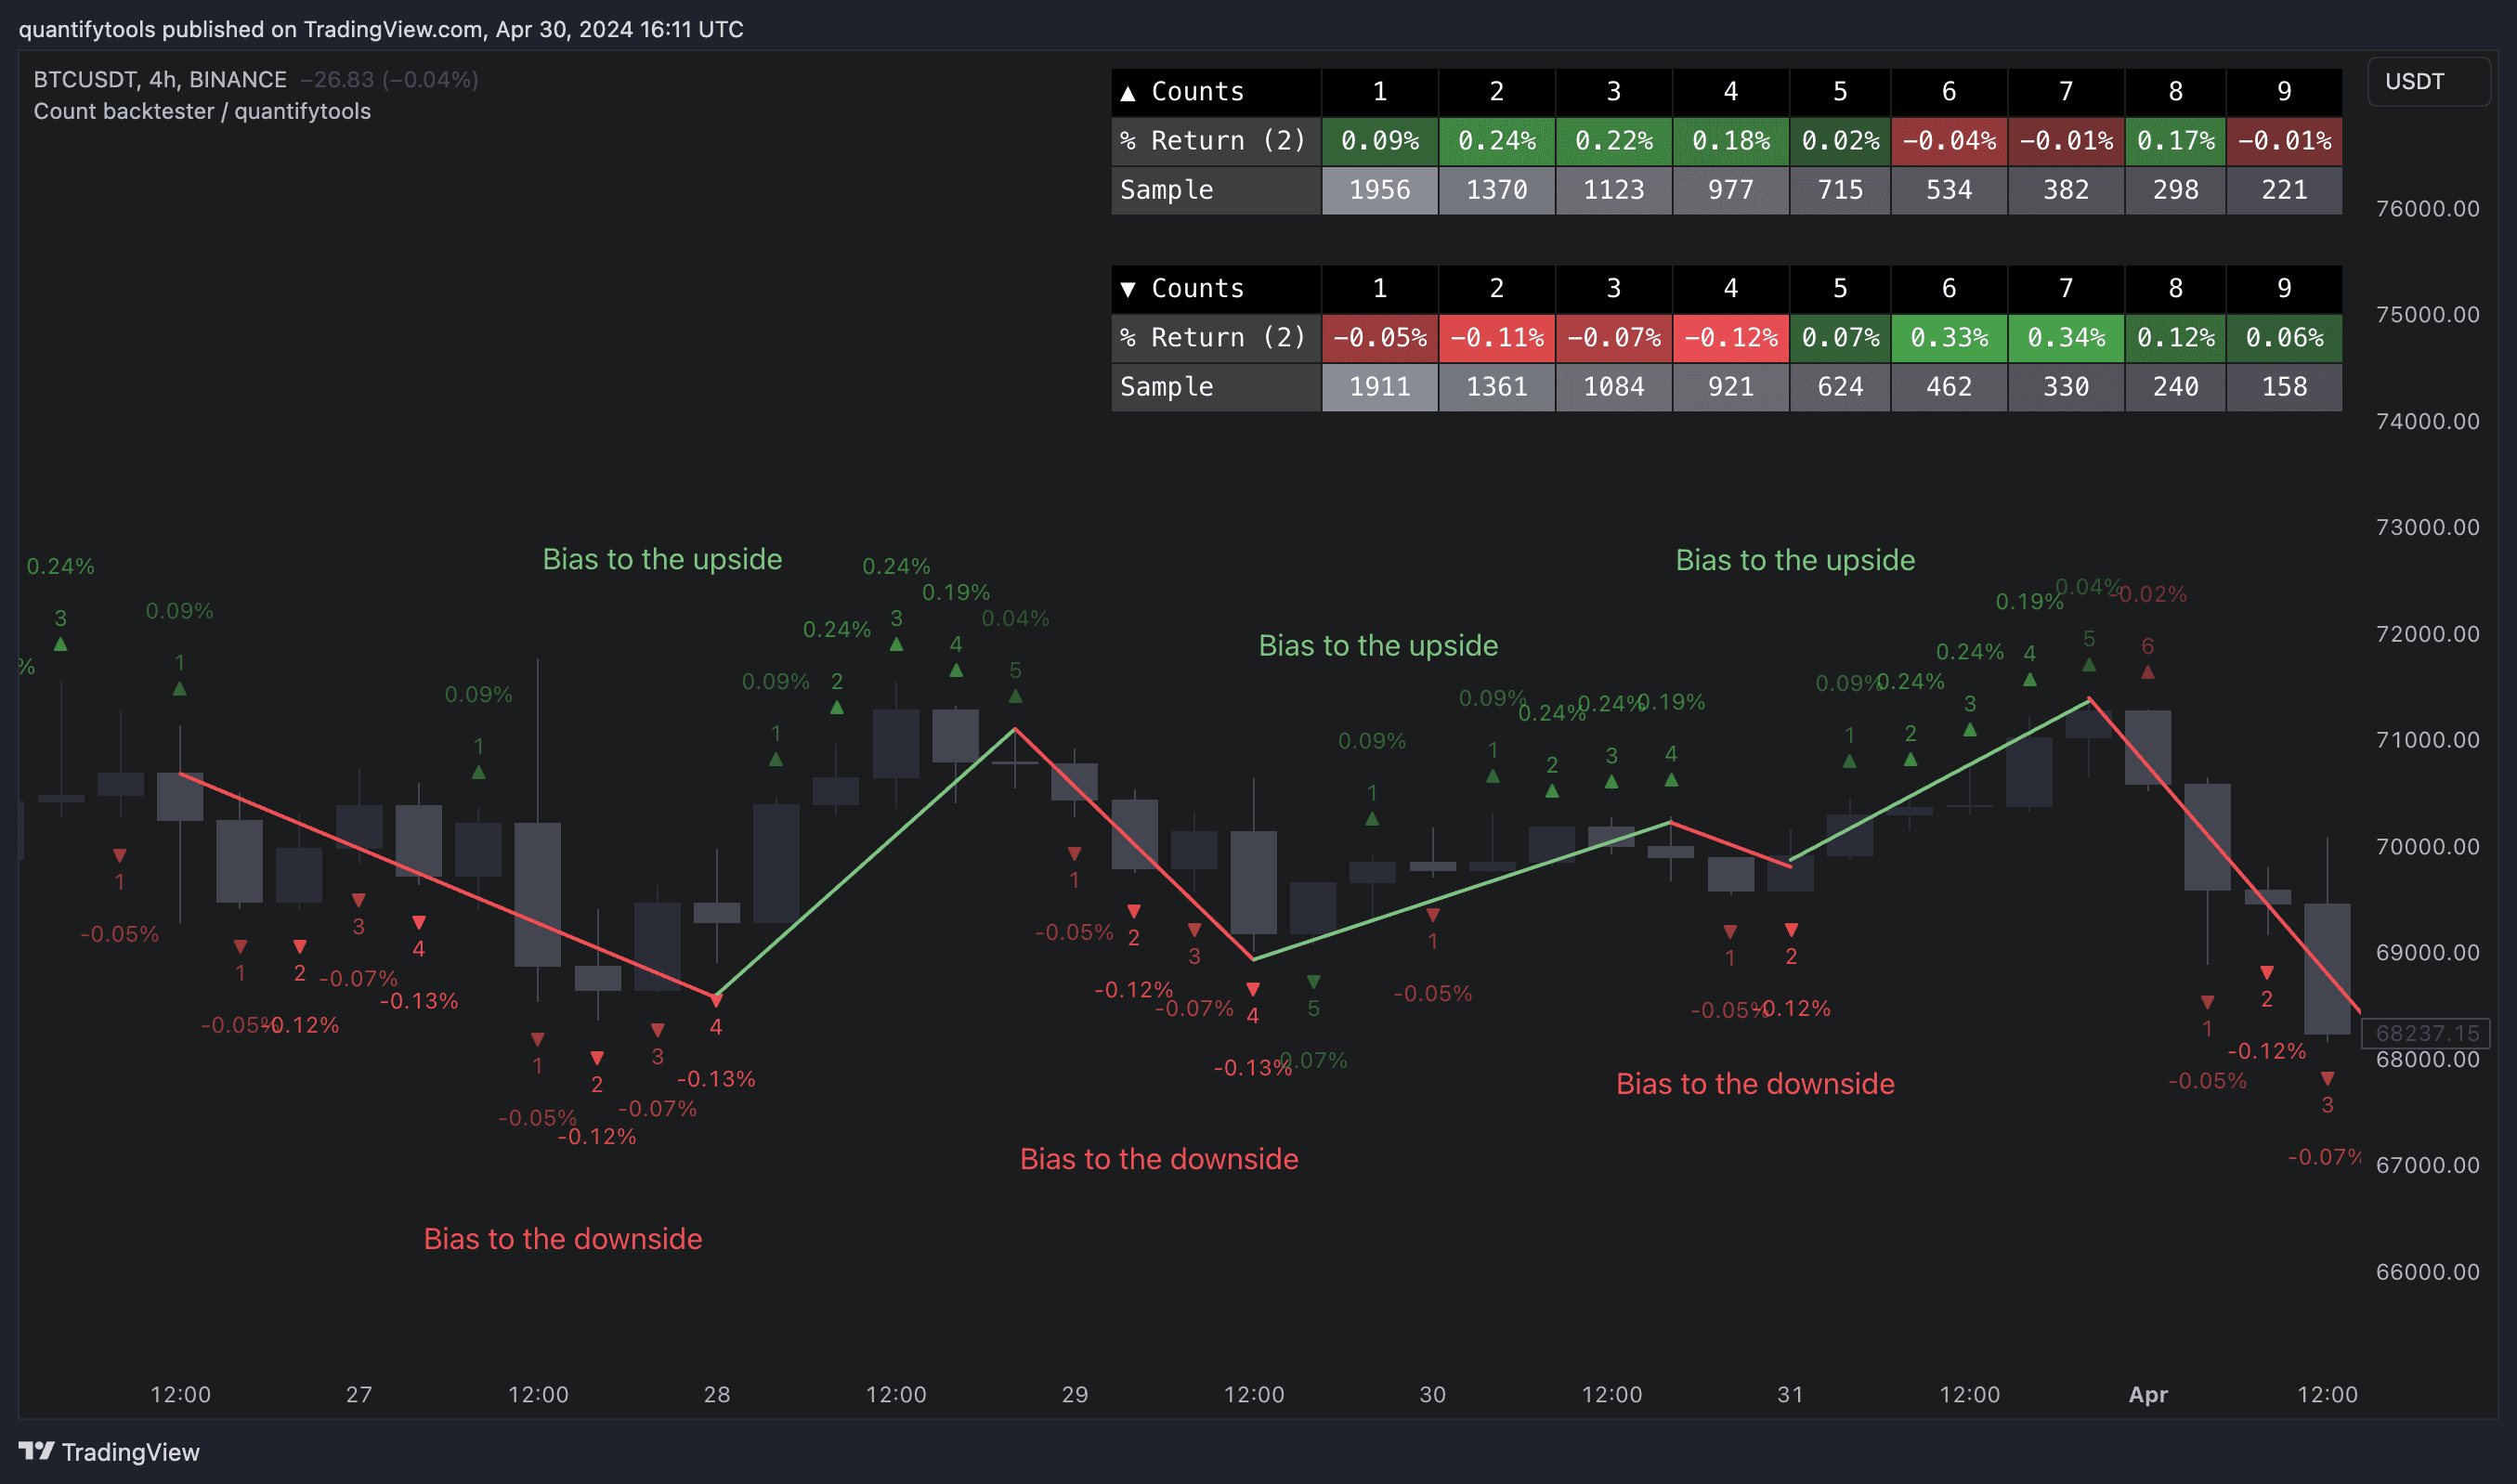
Identify trending counts
Consecutive counts can also have utility value for trend following. When historical short term change is to the downside, expect downside, when to the upside, expect upside.
How to use consecutive counts in trading
Consecutive counting is a simple yet effective method to for detecting reversals, for which 7-9 counts are traditionally used. Whether that holds true or not can now be put through a test with different variations of the method as well as using additional filters to improve the probability of a turn.
Identify reversal counts
Now that we have backtesting data, we can confirm which counts actually perform the best and see if popular ideas hold true, such as using the 9 count for reversals. In this example when counting up to 13, we can see that for up counts 11 and 12 are most favorable for downside. For down counts 4, 5 and 6 are most favorable.
Identify trending counts
Consecutive counts can also have utility value for trend following. When historical short term change is to the downside, expect downside, when to the upside, expect upside.
Get Consecutive count backtester on TradingView
Find TradingView indicators easily by opening up any chart on TradingView (e.g. TSLA) and clicking Indicators tab on top menu. To find all our tools, search "quantifytools" and click an indicator to add to your chart.
TradingView page
Consecutive count backtester on TradingView ↗


