

Key features and settings
Here's how you work with Auto-magnifier on TradingView.
Zoom in
Zoom into a portion of your chart by scrolling.
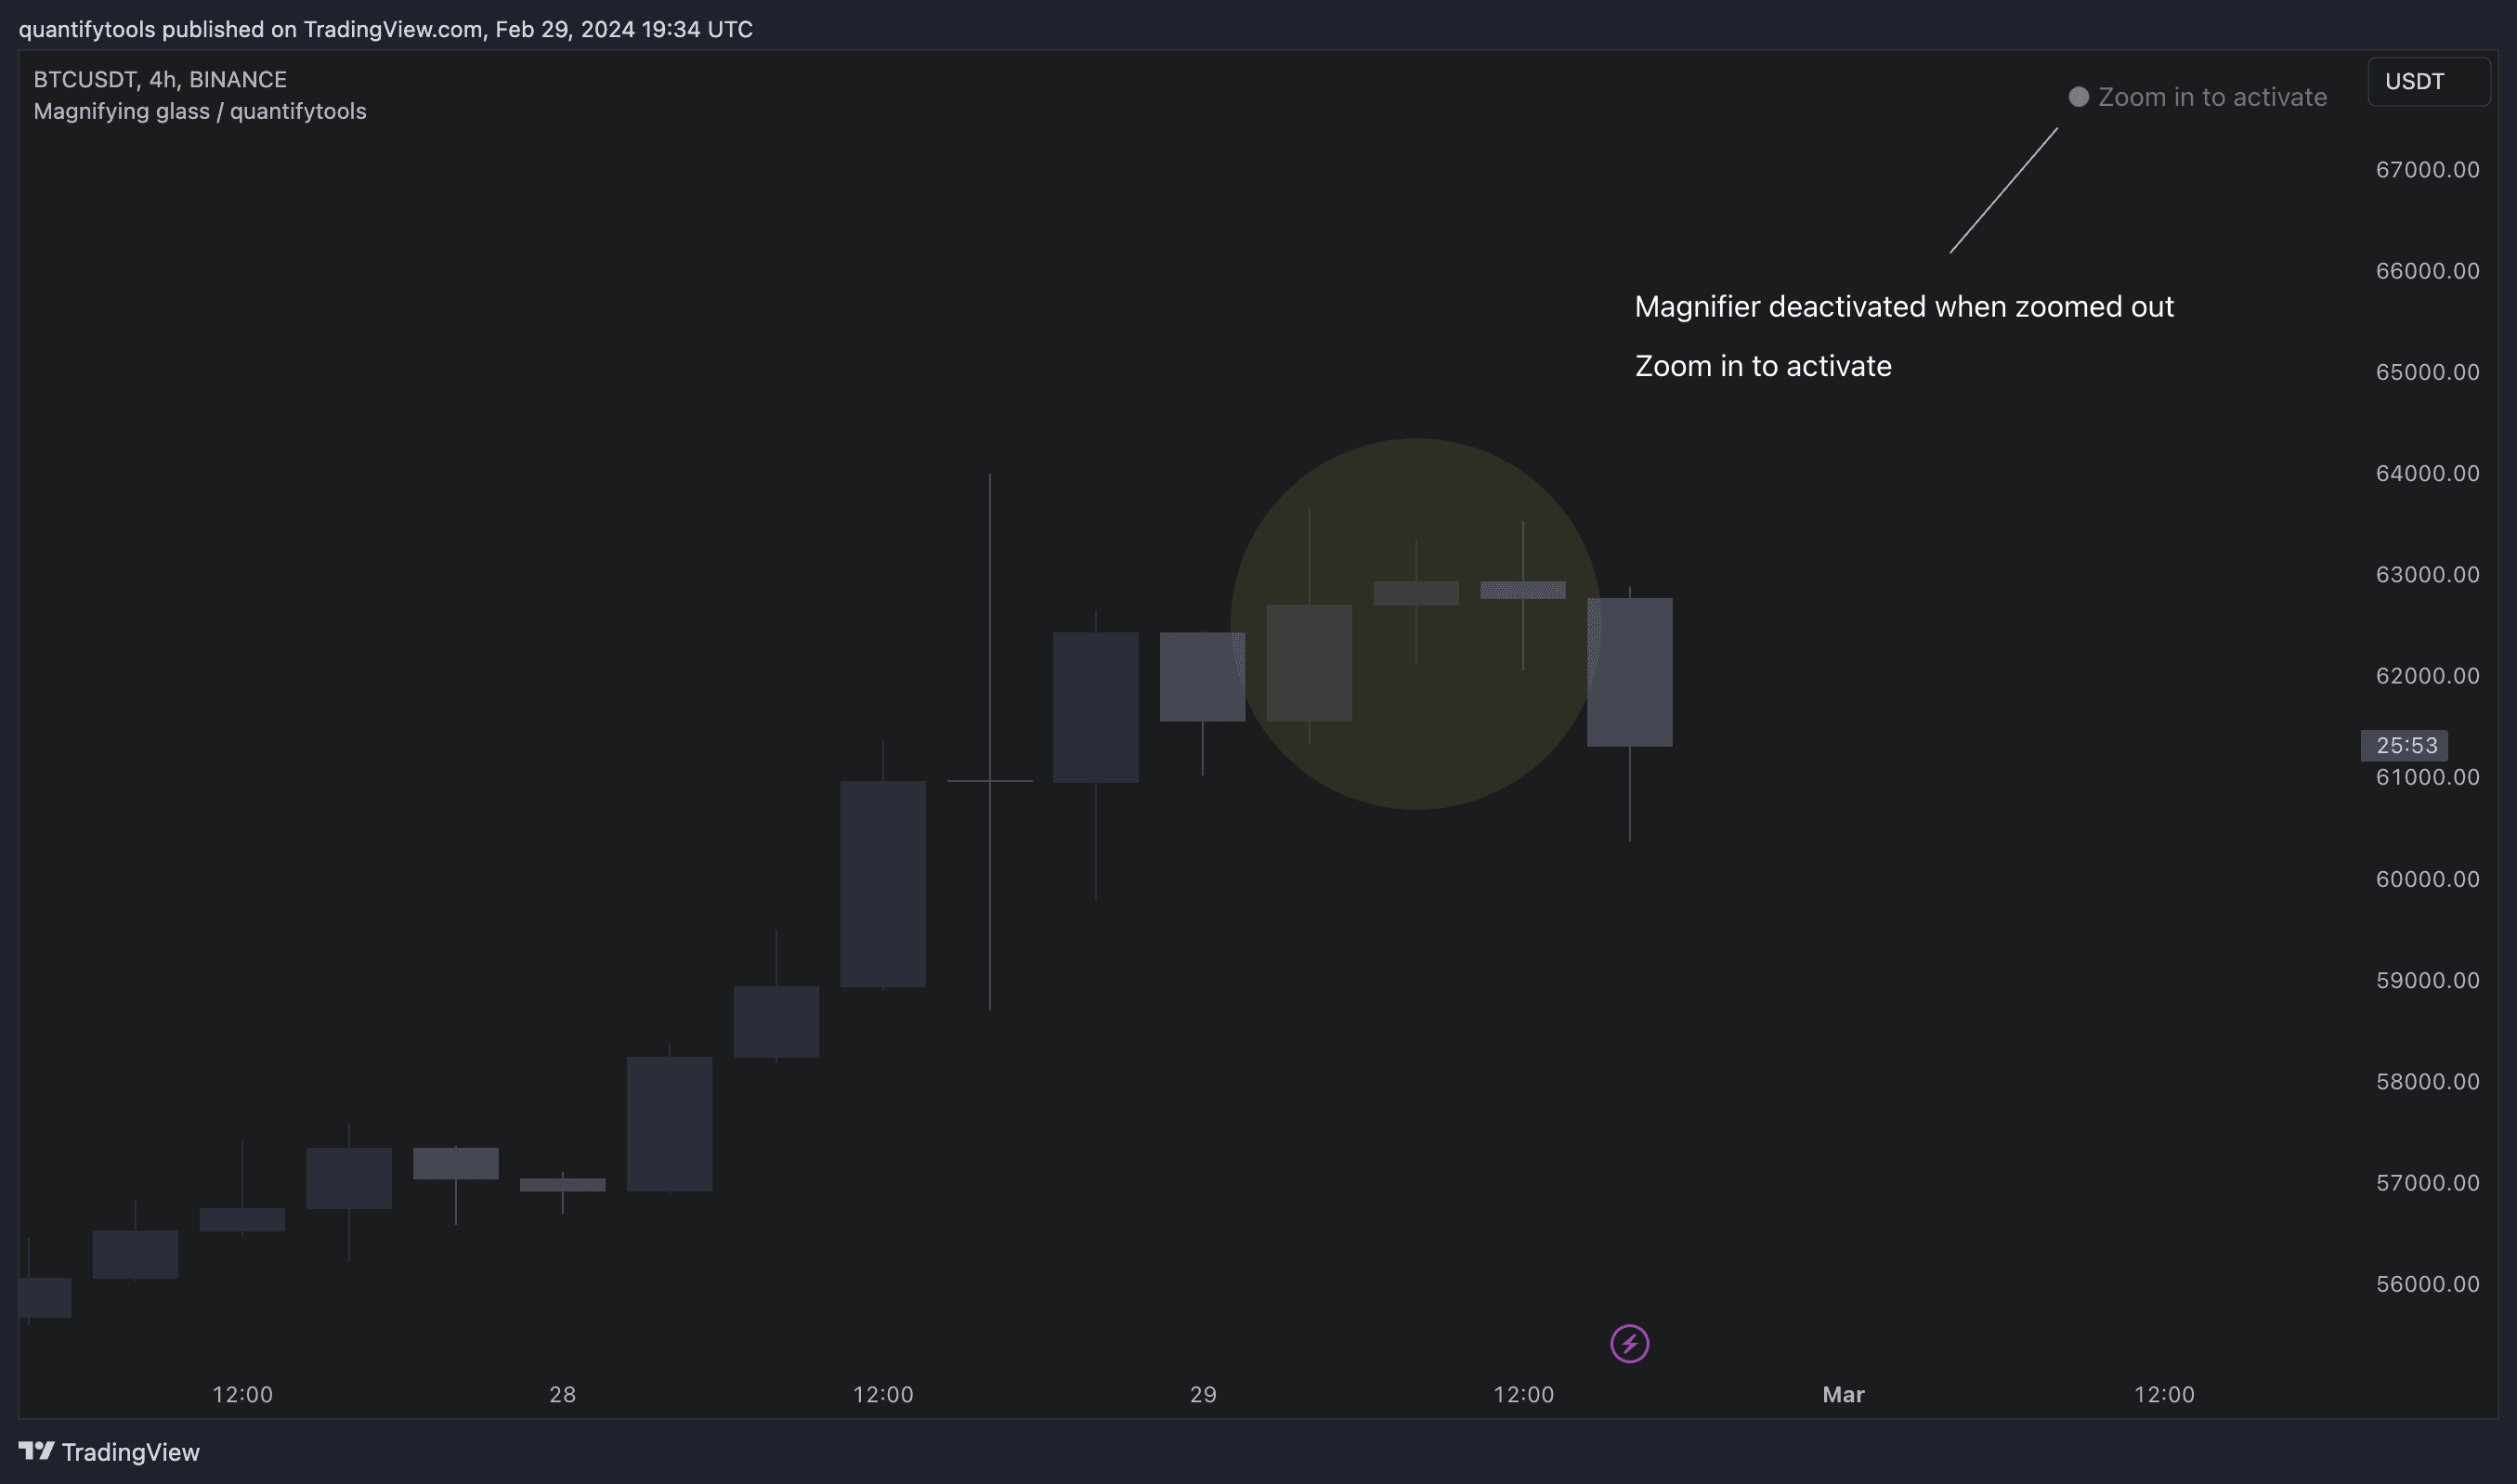
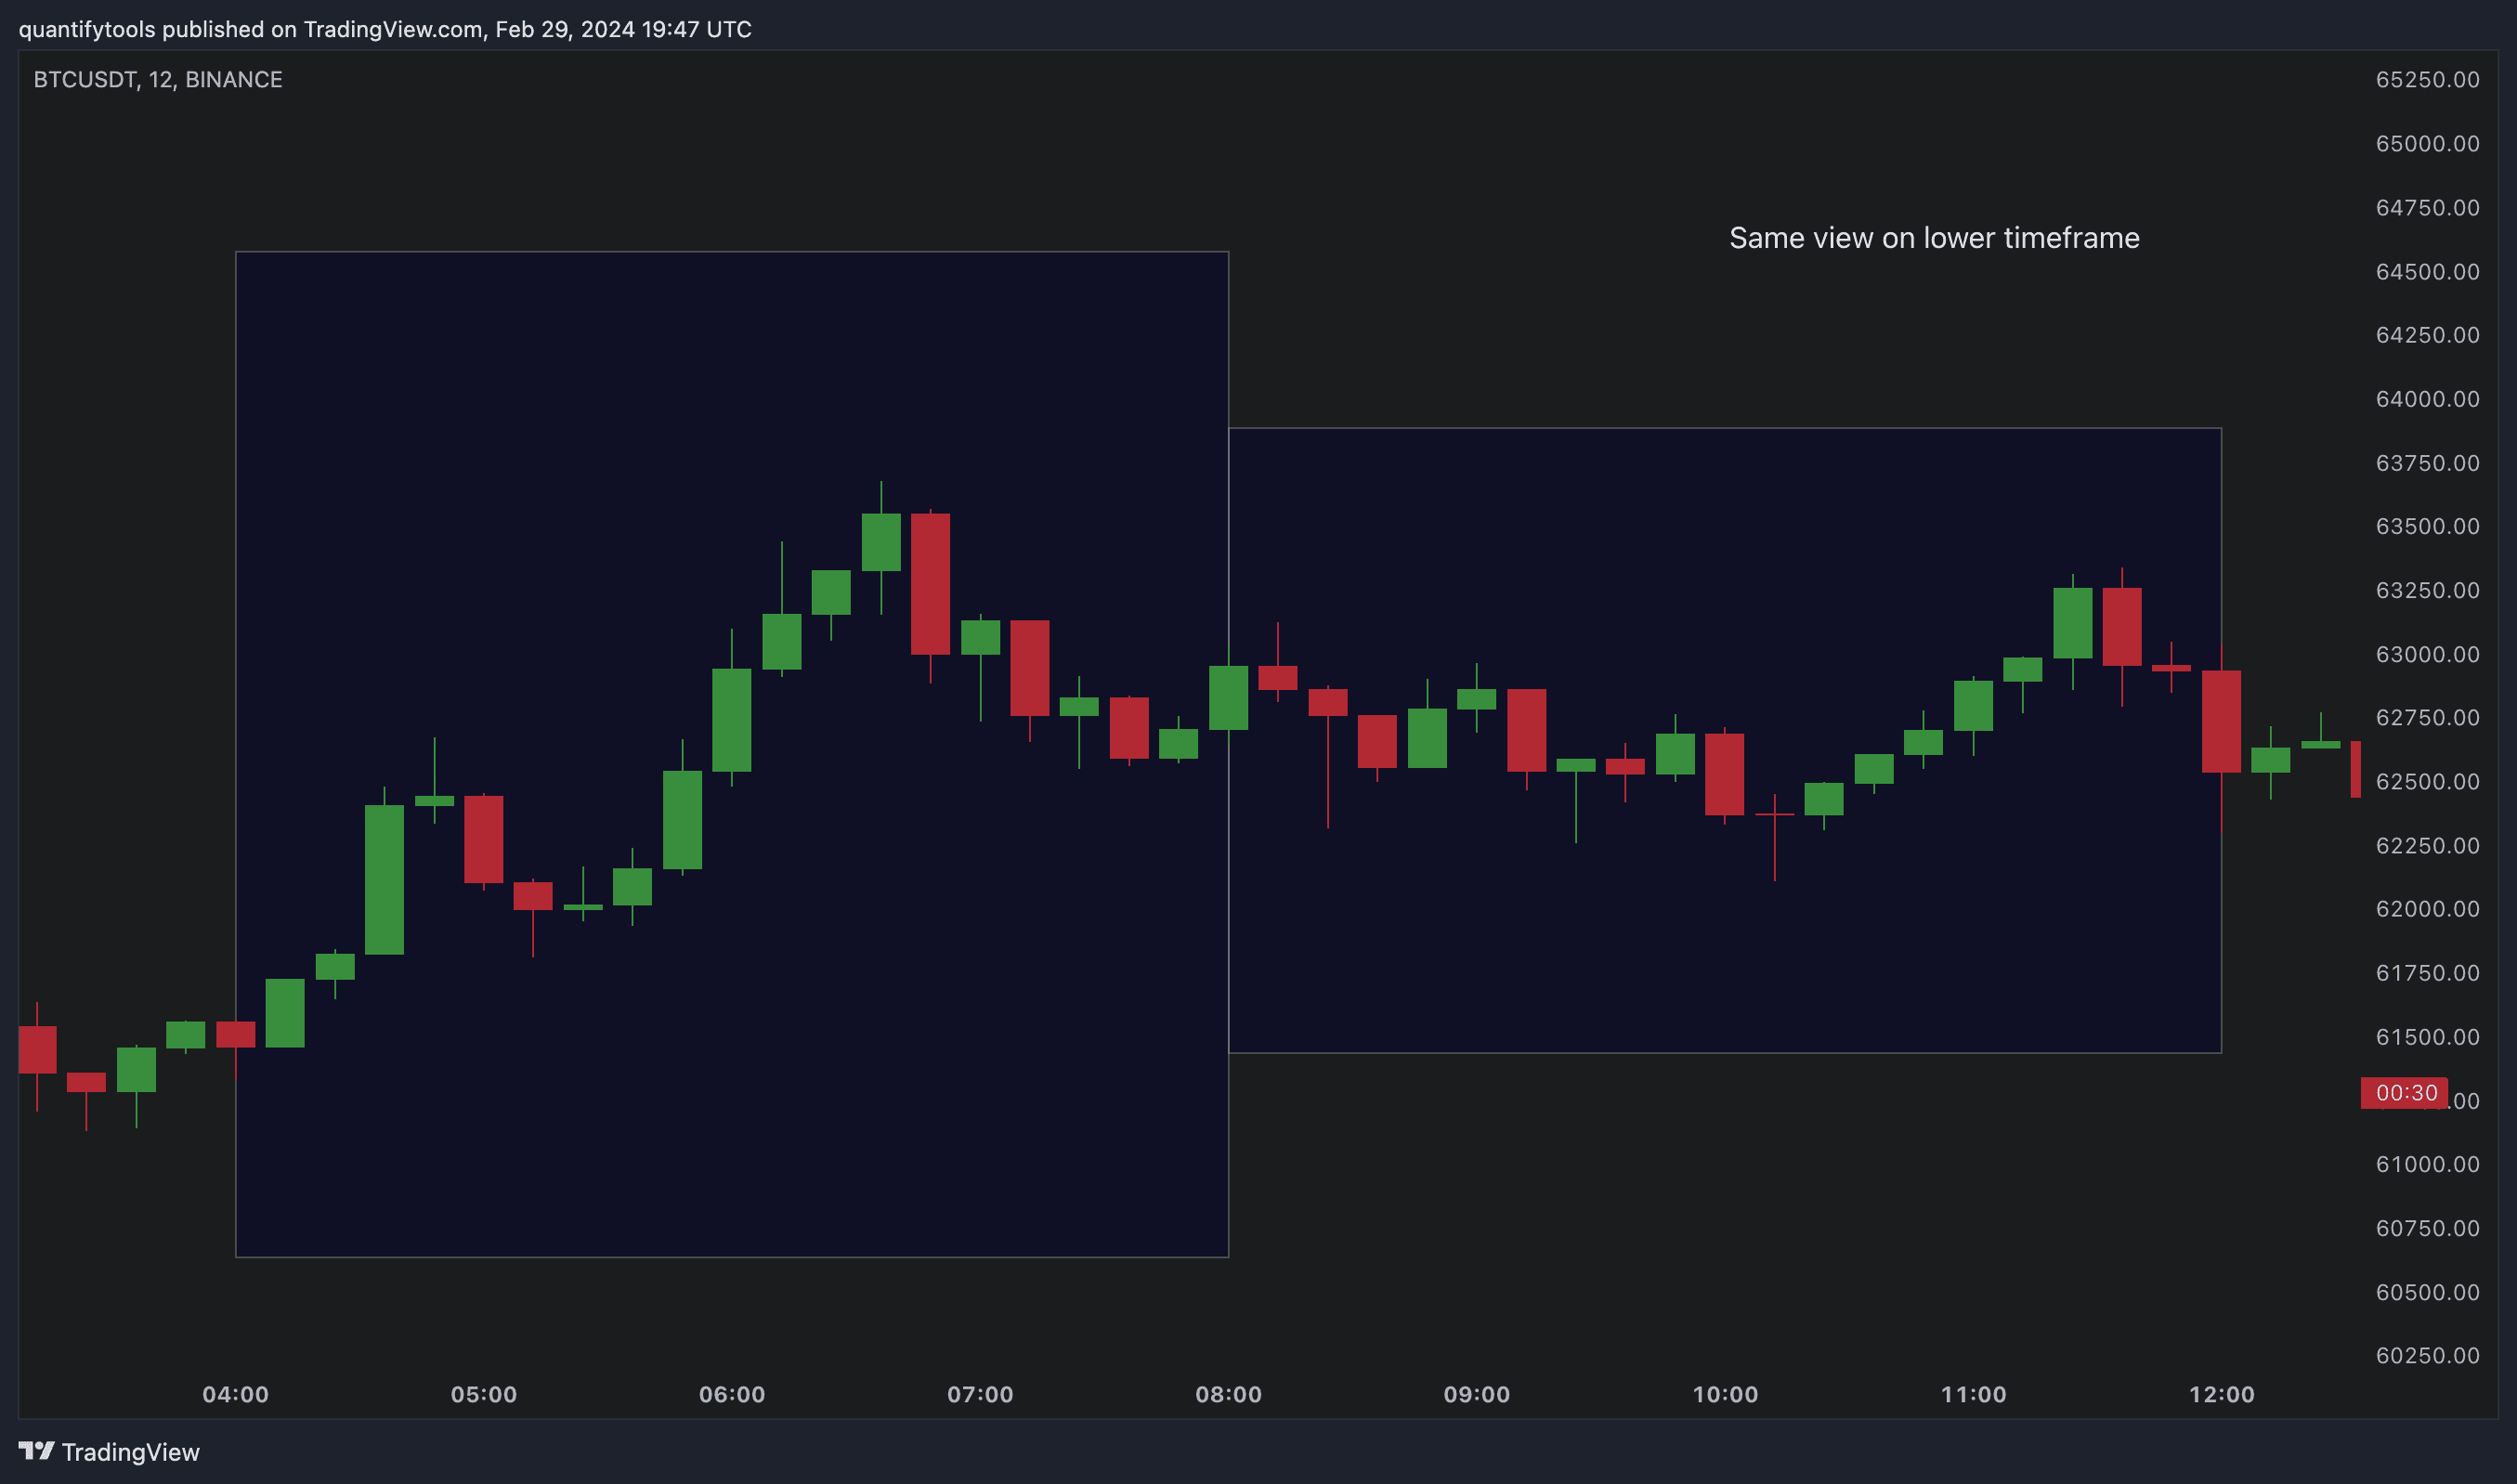
See lower timeframe price action
After a second or two, a view of lower timeframe price action and volume bars candles opens up.
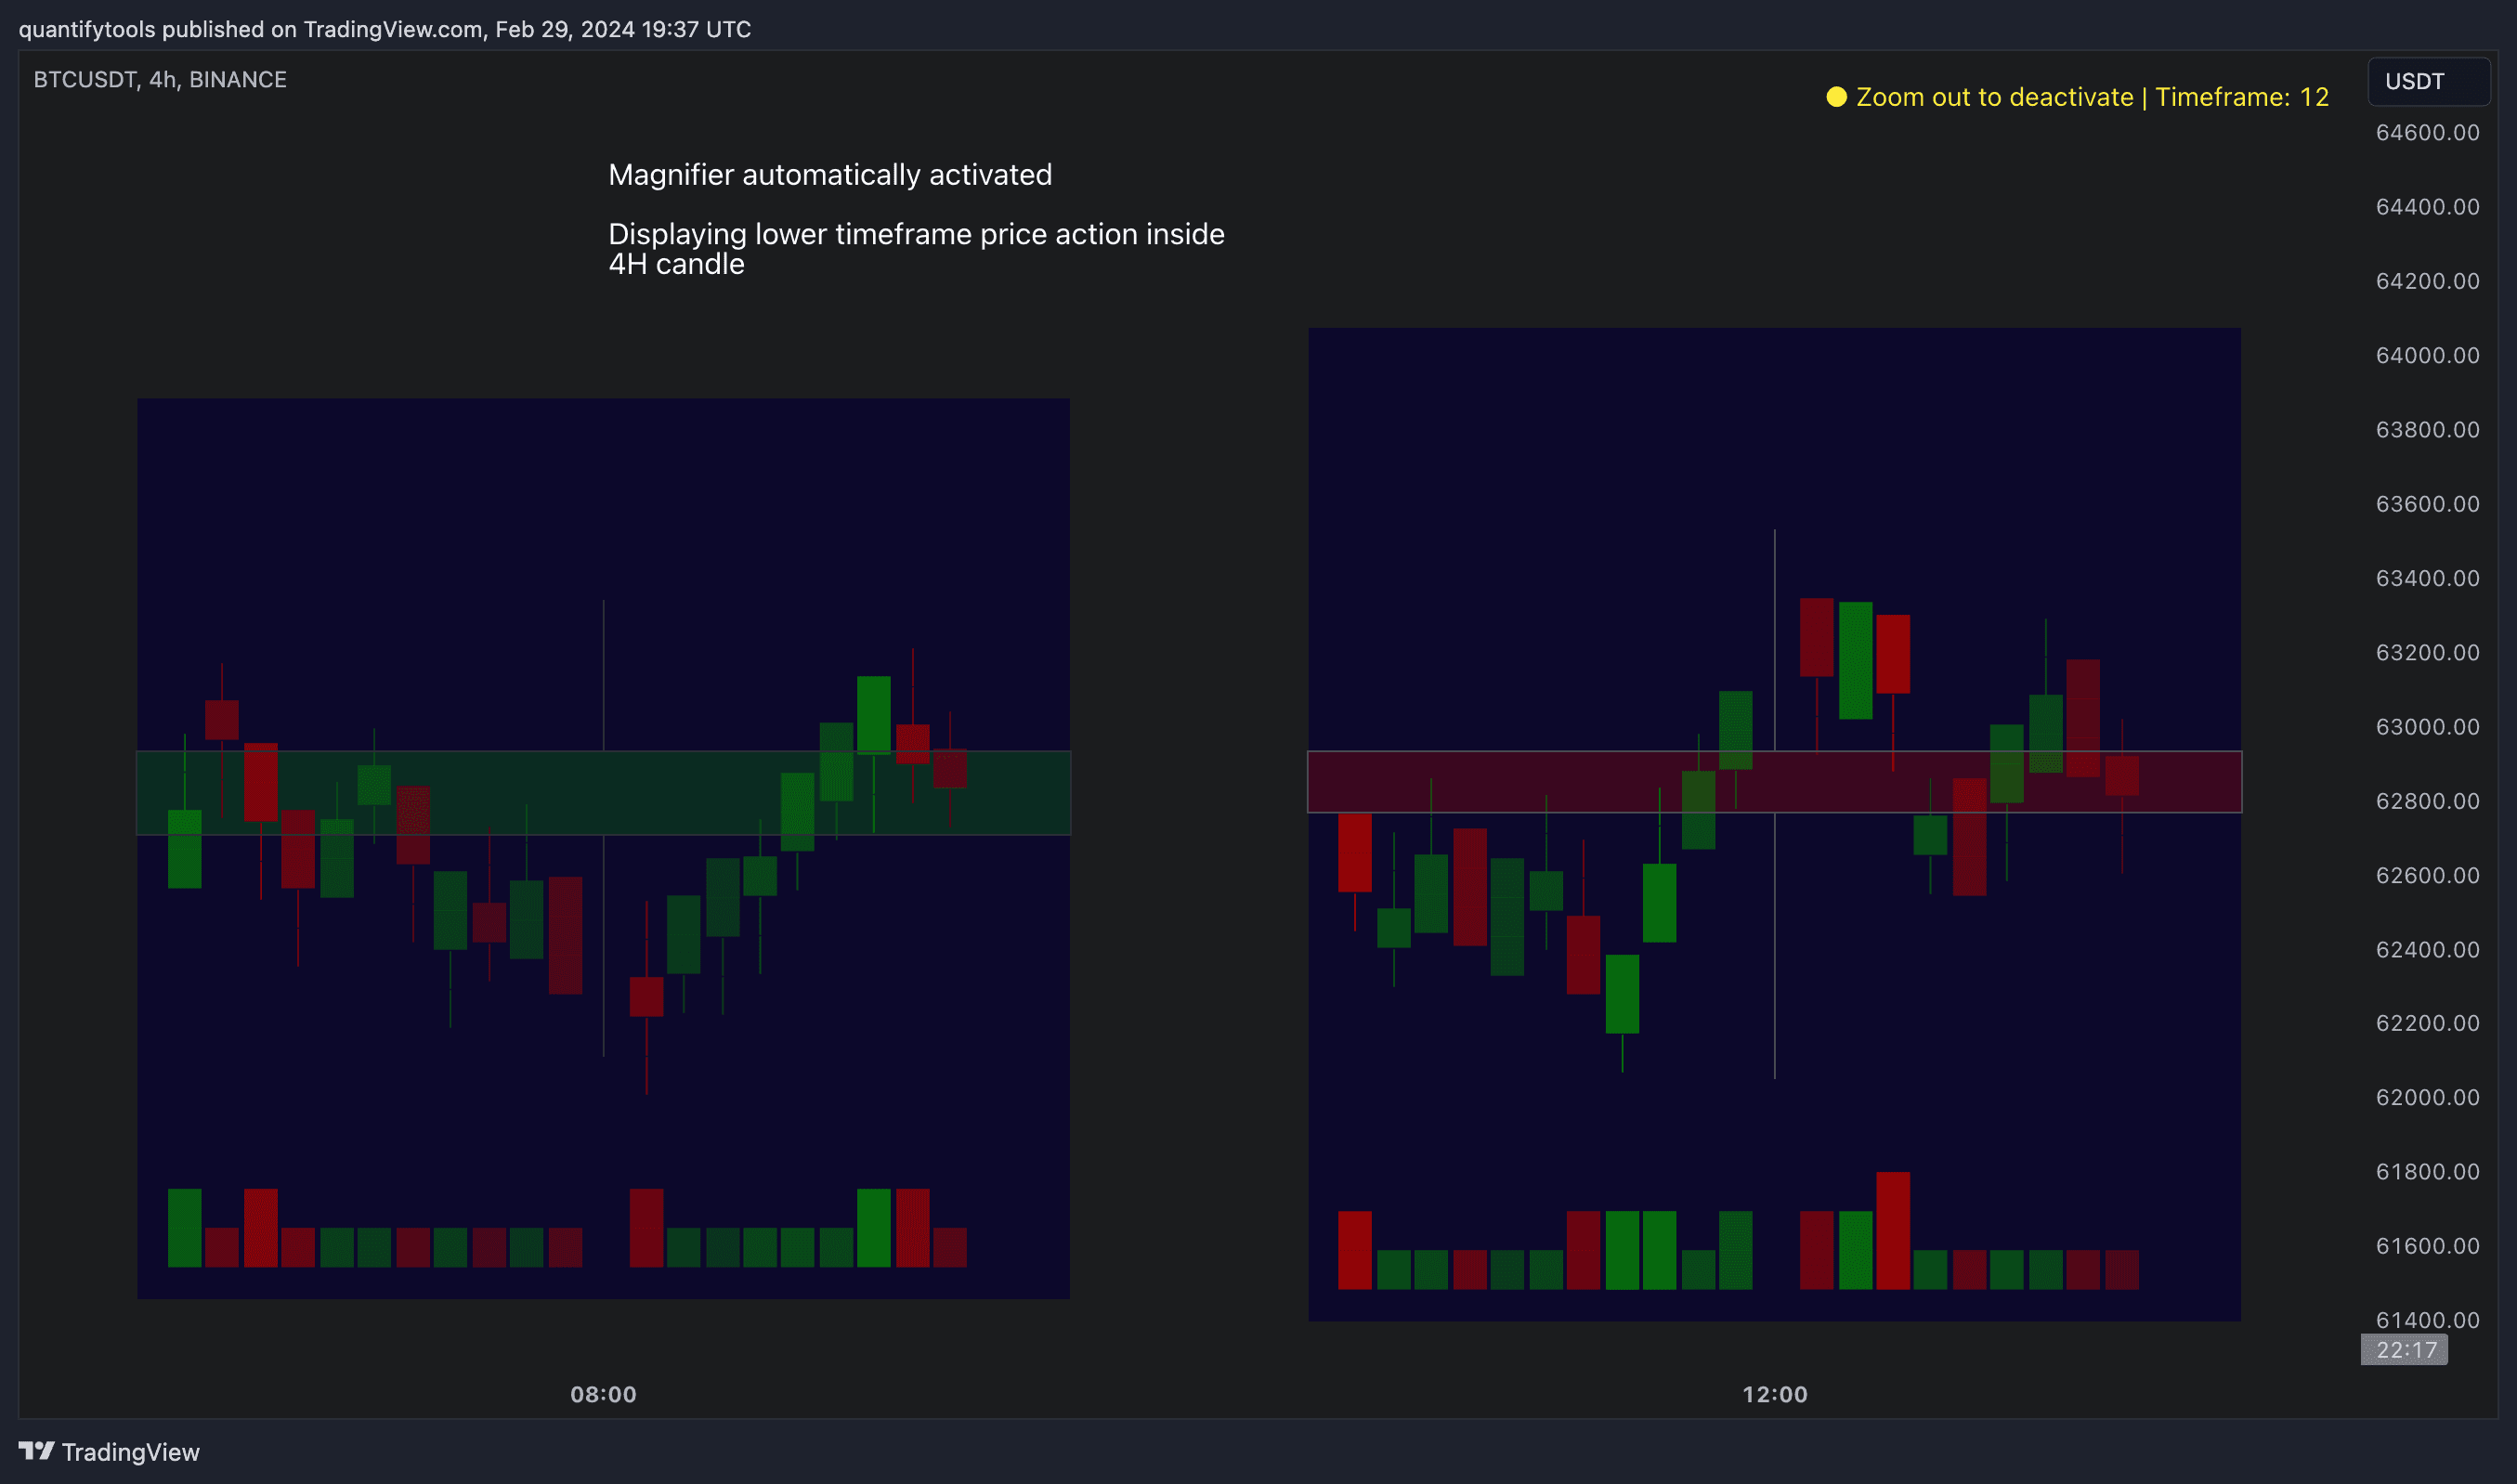
By default, main chart candles are splitted into 20 lower timeframe candles. The amount of candles displayed is a target rate, meaning the script will use a lower timeframe that has the closest match to 20 candles and therefore will vary a bit.
Users can override automatic timeframe calculation and display any specific lower timeframe, or adjust amount of candles shown (e.g. 20 -> 30 candles) per each main timeframe candle.
Example
Main timeframe set to 30 minute, candles displayed set to 20 -> Magnifying using 2 minute candles (30 minute/20 candles = 1.5 min, rounded to 2 min)
Main timeframe set to 30 minute, override set to 5 minutes -> Displaying 5 minute candles
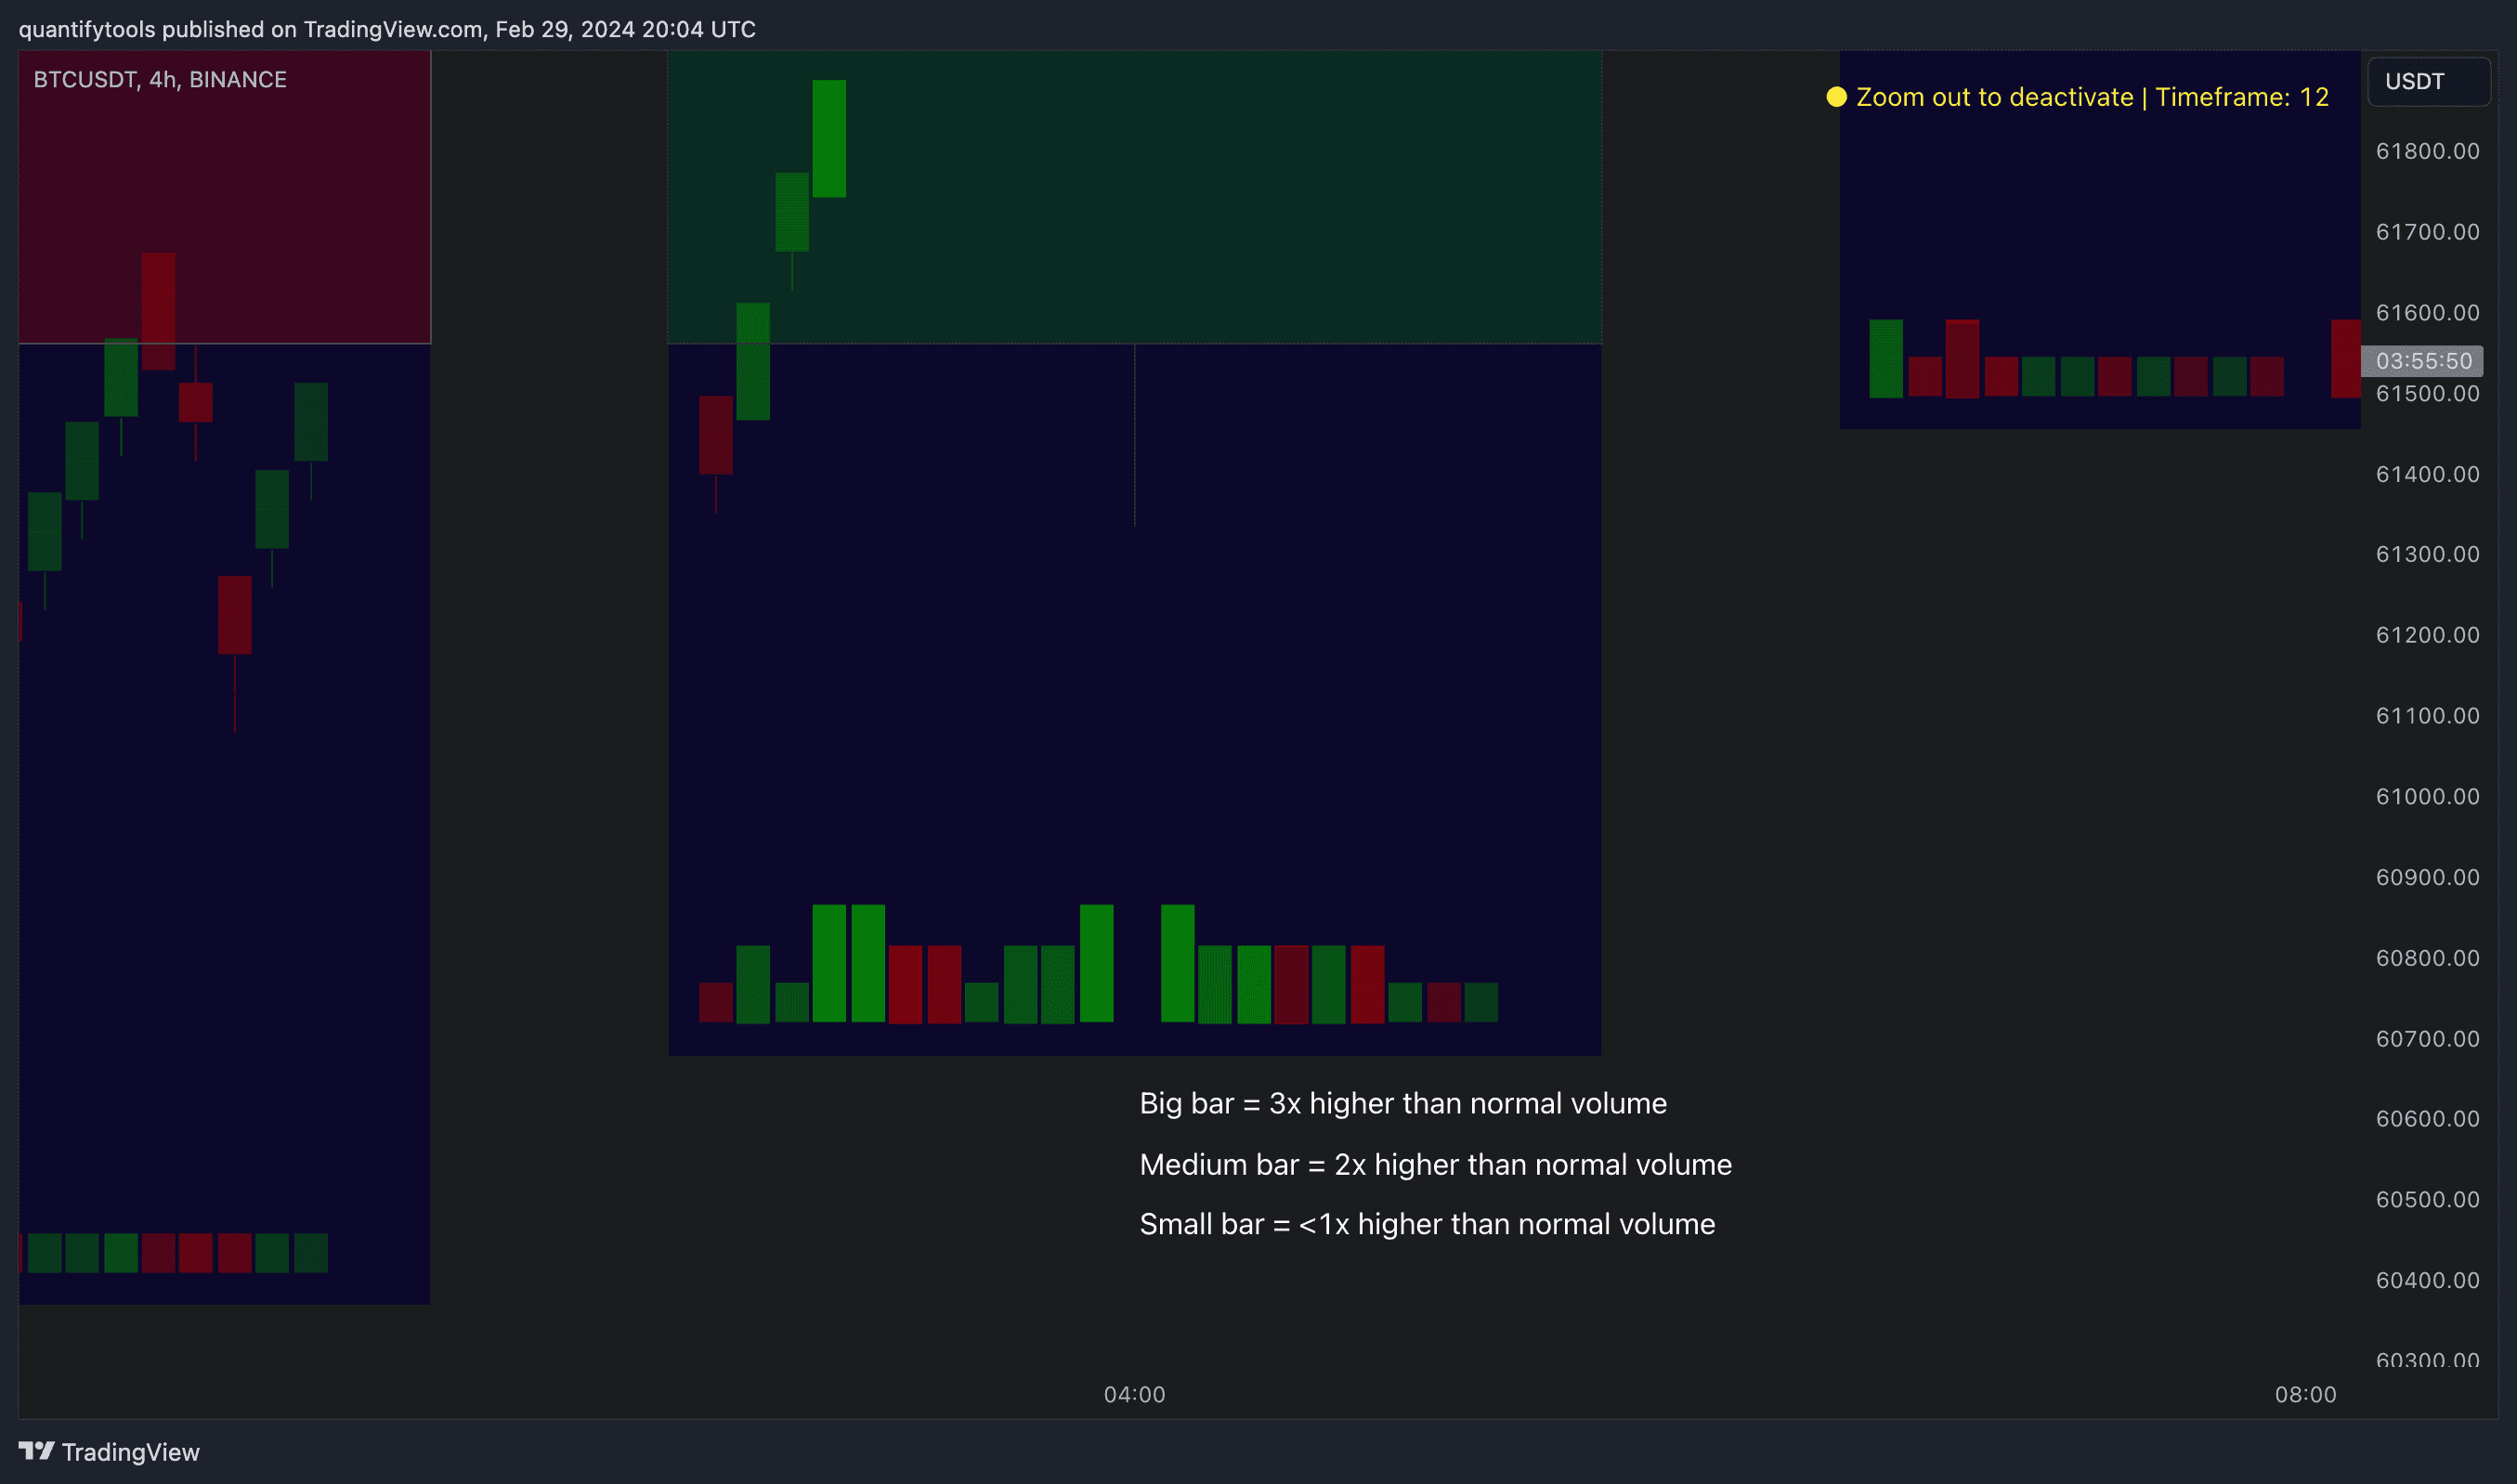
Size of volume bars is calculated using relative volume (volume relative to volume SMA20), lowest bar representing relative volume values of under or equal to 1x the moving average and from there onwards progressively growing.
Limitations and considerations
Amount of candles shown might flow over from the background on smaller screen sizes, in which case you would want to decrease the amount shown. Opposite is true for bigger screens, this value can be increased as more candles fit.
Magnified chart vs. Actual chart
This indicator involves a lot of tricks with text elements to make it work automatically by zooming in. Size of wicks, bodies and volume bars are calculated by adding more text elements on big candles and less text elements on smaller candles.
This means the displayed candles won’t be a 100% match, but a rather a fair representation of the view, e.g. candle is green = lower timeframe candle is green, candle has a big wick = lower timeframe candle has a big wick (but not a 100% match).
Magnified chart
Here's how a lower timeframe chart looks like on Auto-magnifier.
Actual chart
Here's how a lower timeframe chart looks like on Auto-magnifier.
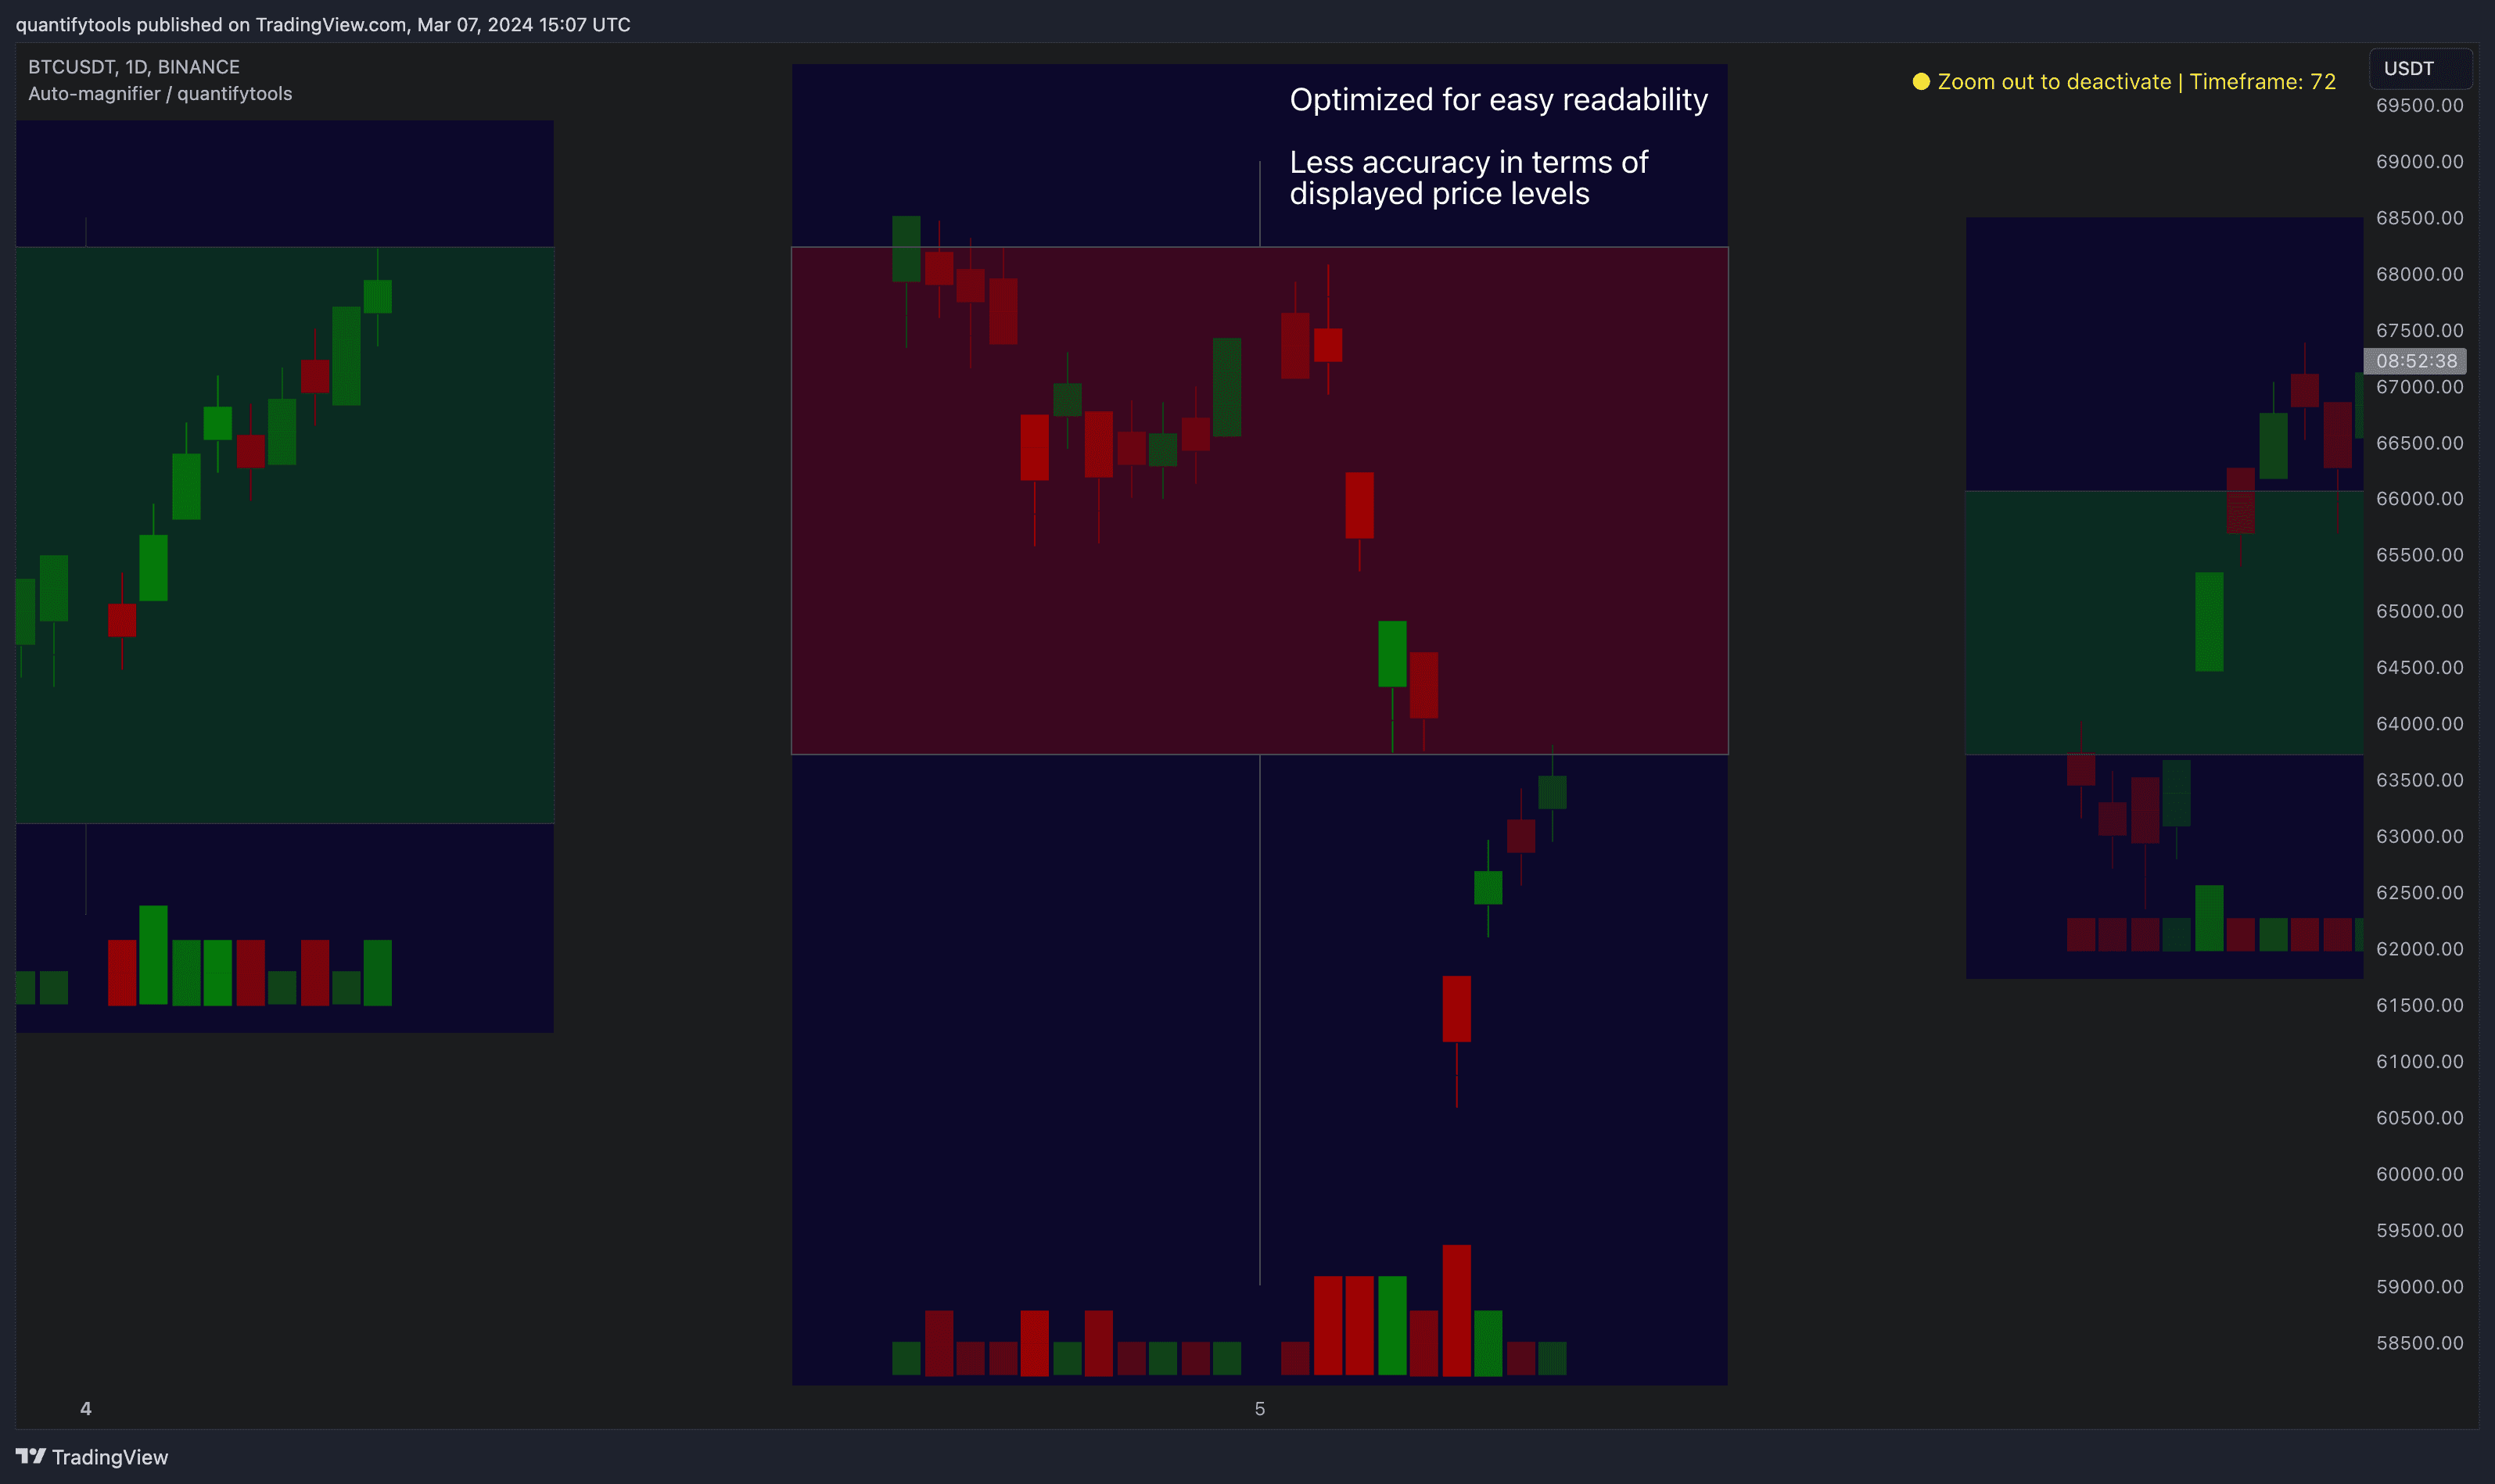
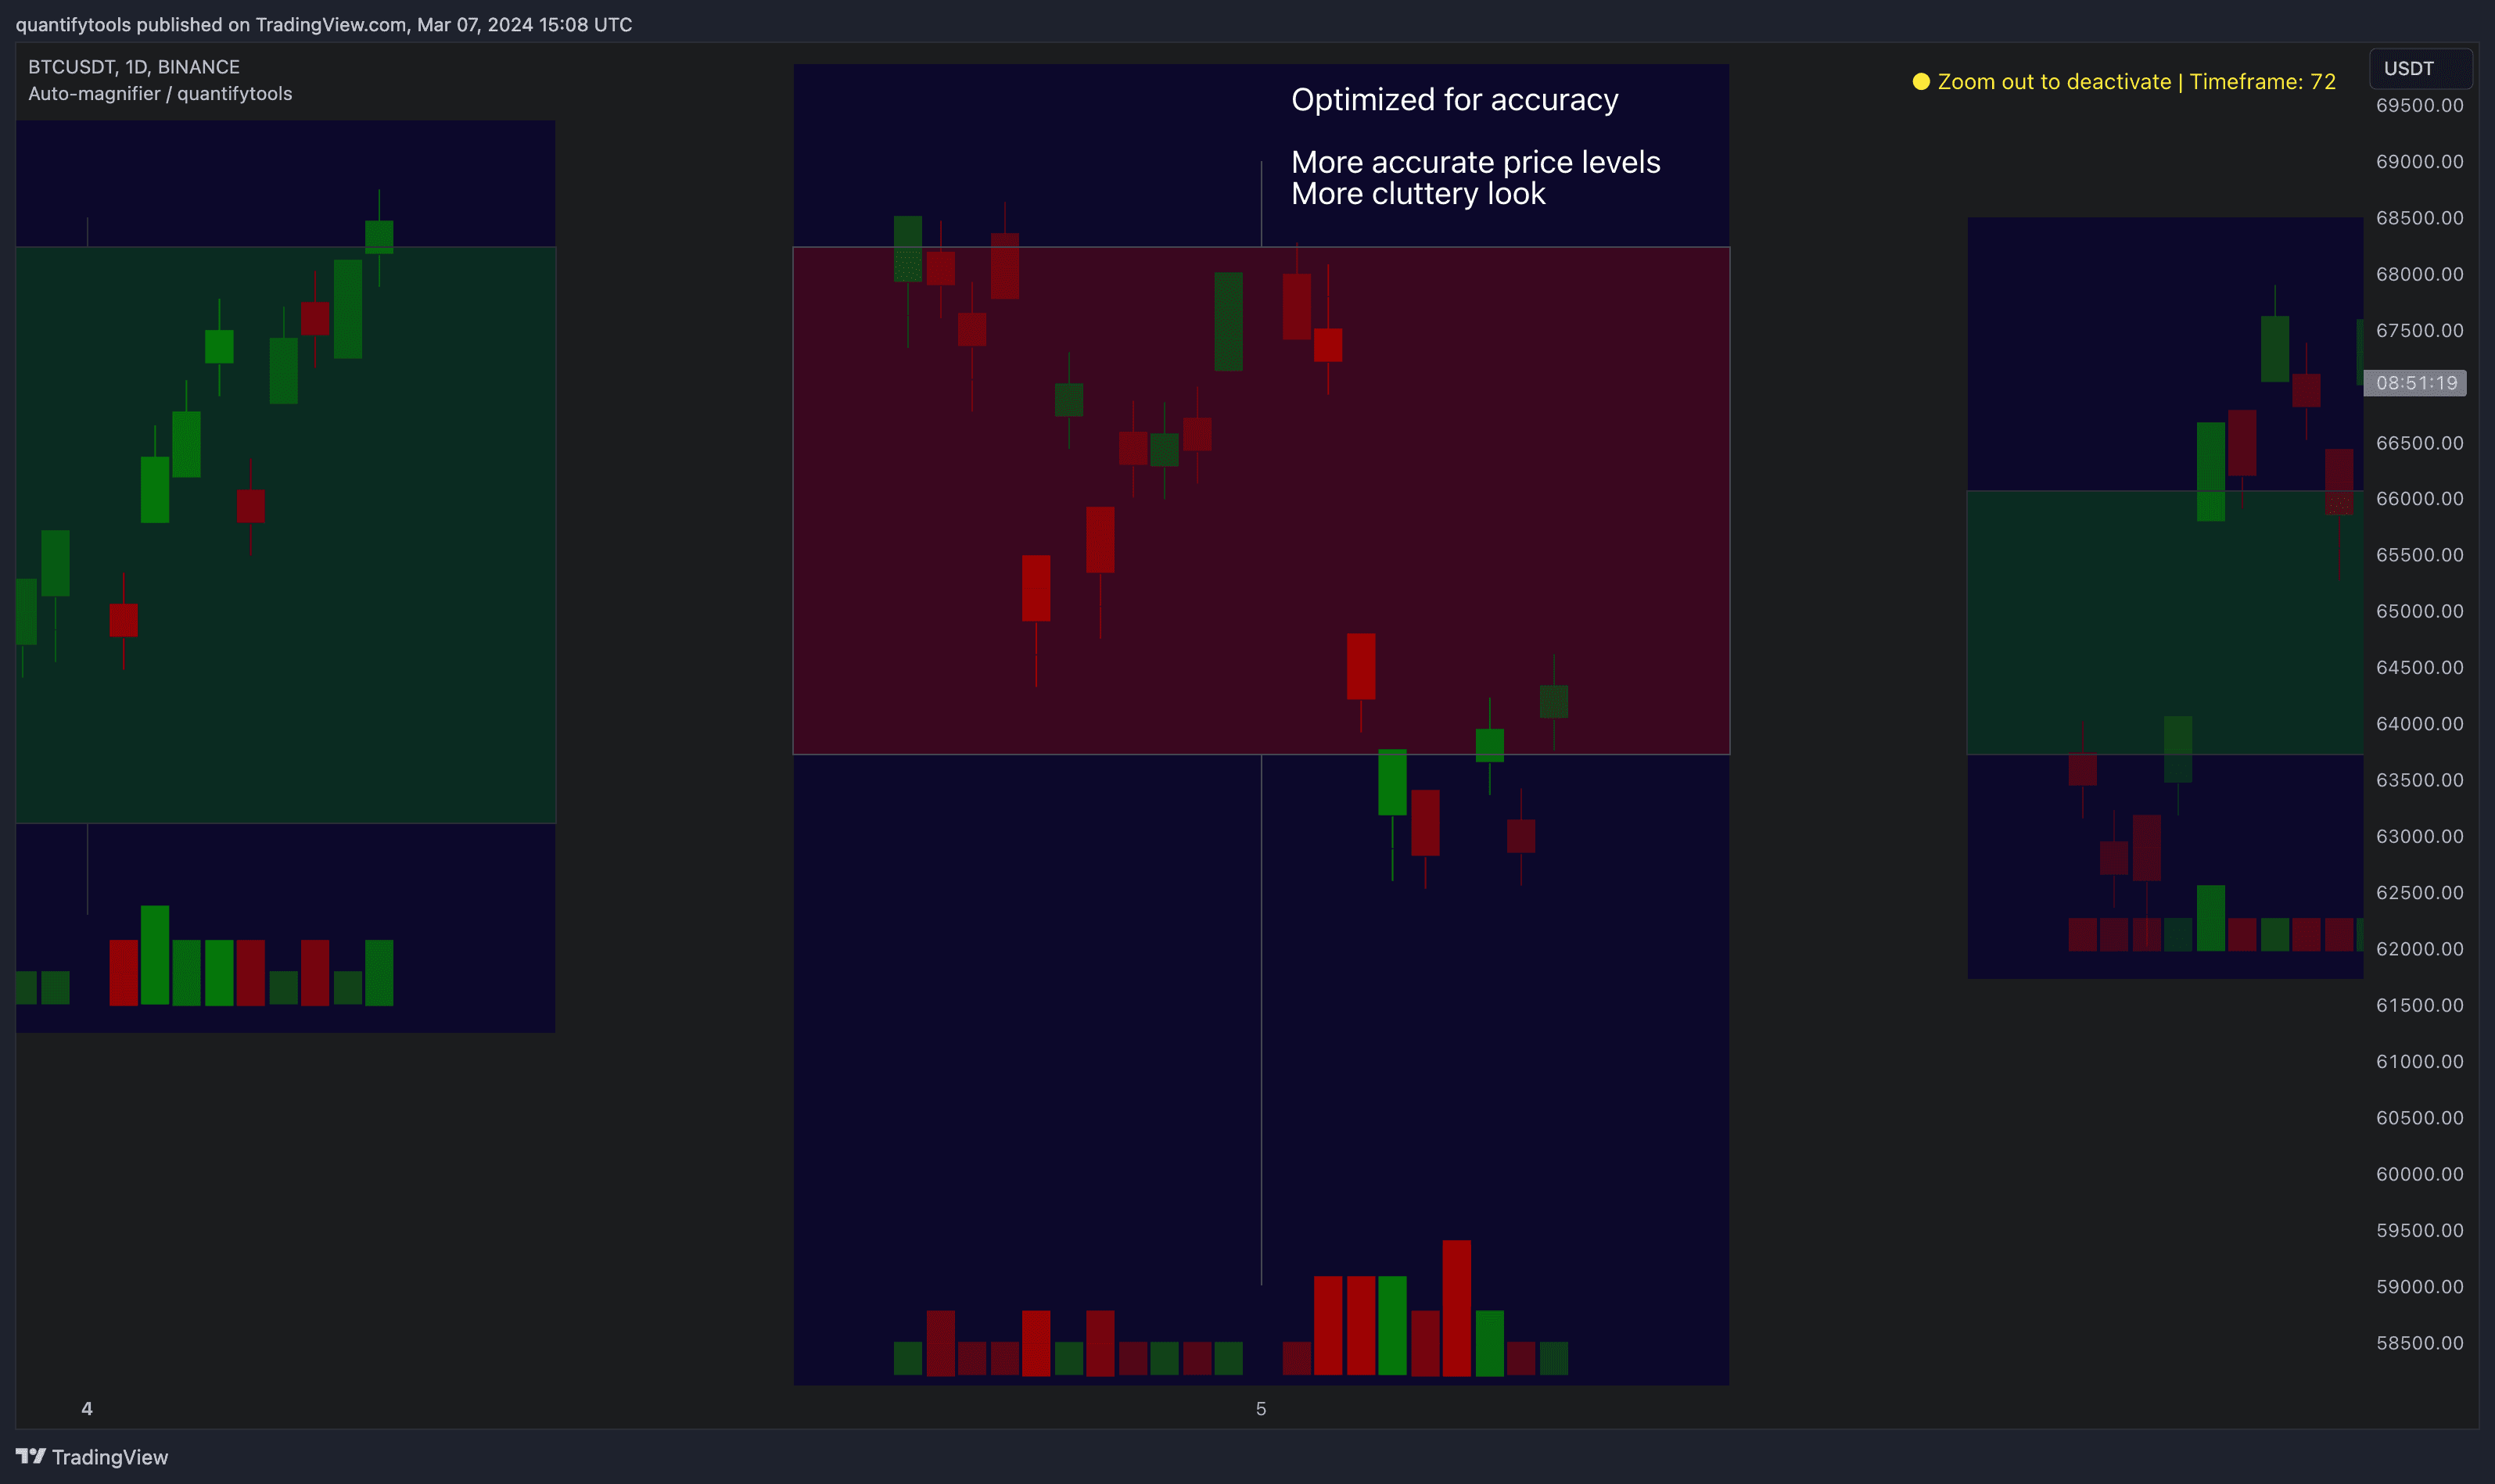
Most mismatch will be found on the price levels where lower timeframe candles are shown, which is sacrificed for the sake of getting a better readability on the overall shape of lower timeframe price action. Users can alternatively optimize calculations for more accuracy, giving a better representation of the price levels where candles truly originated. This typically comes with the cost of worse readability however.
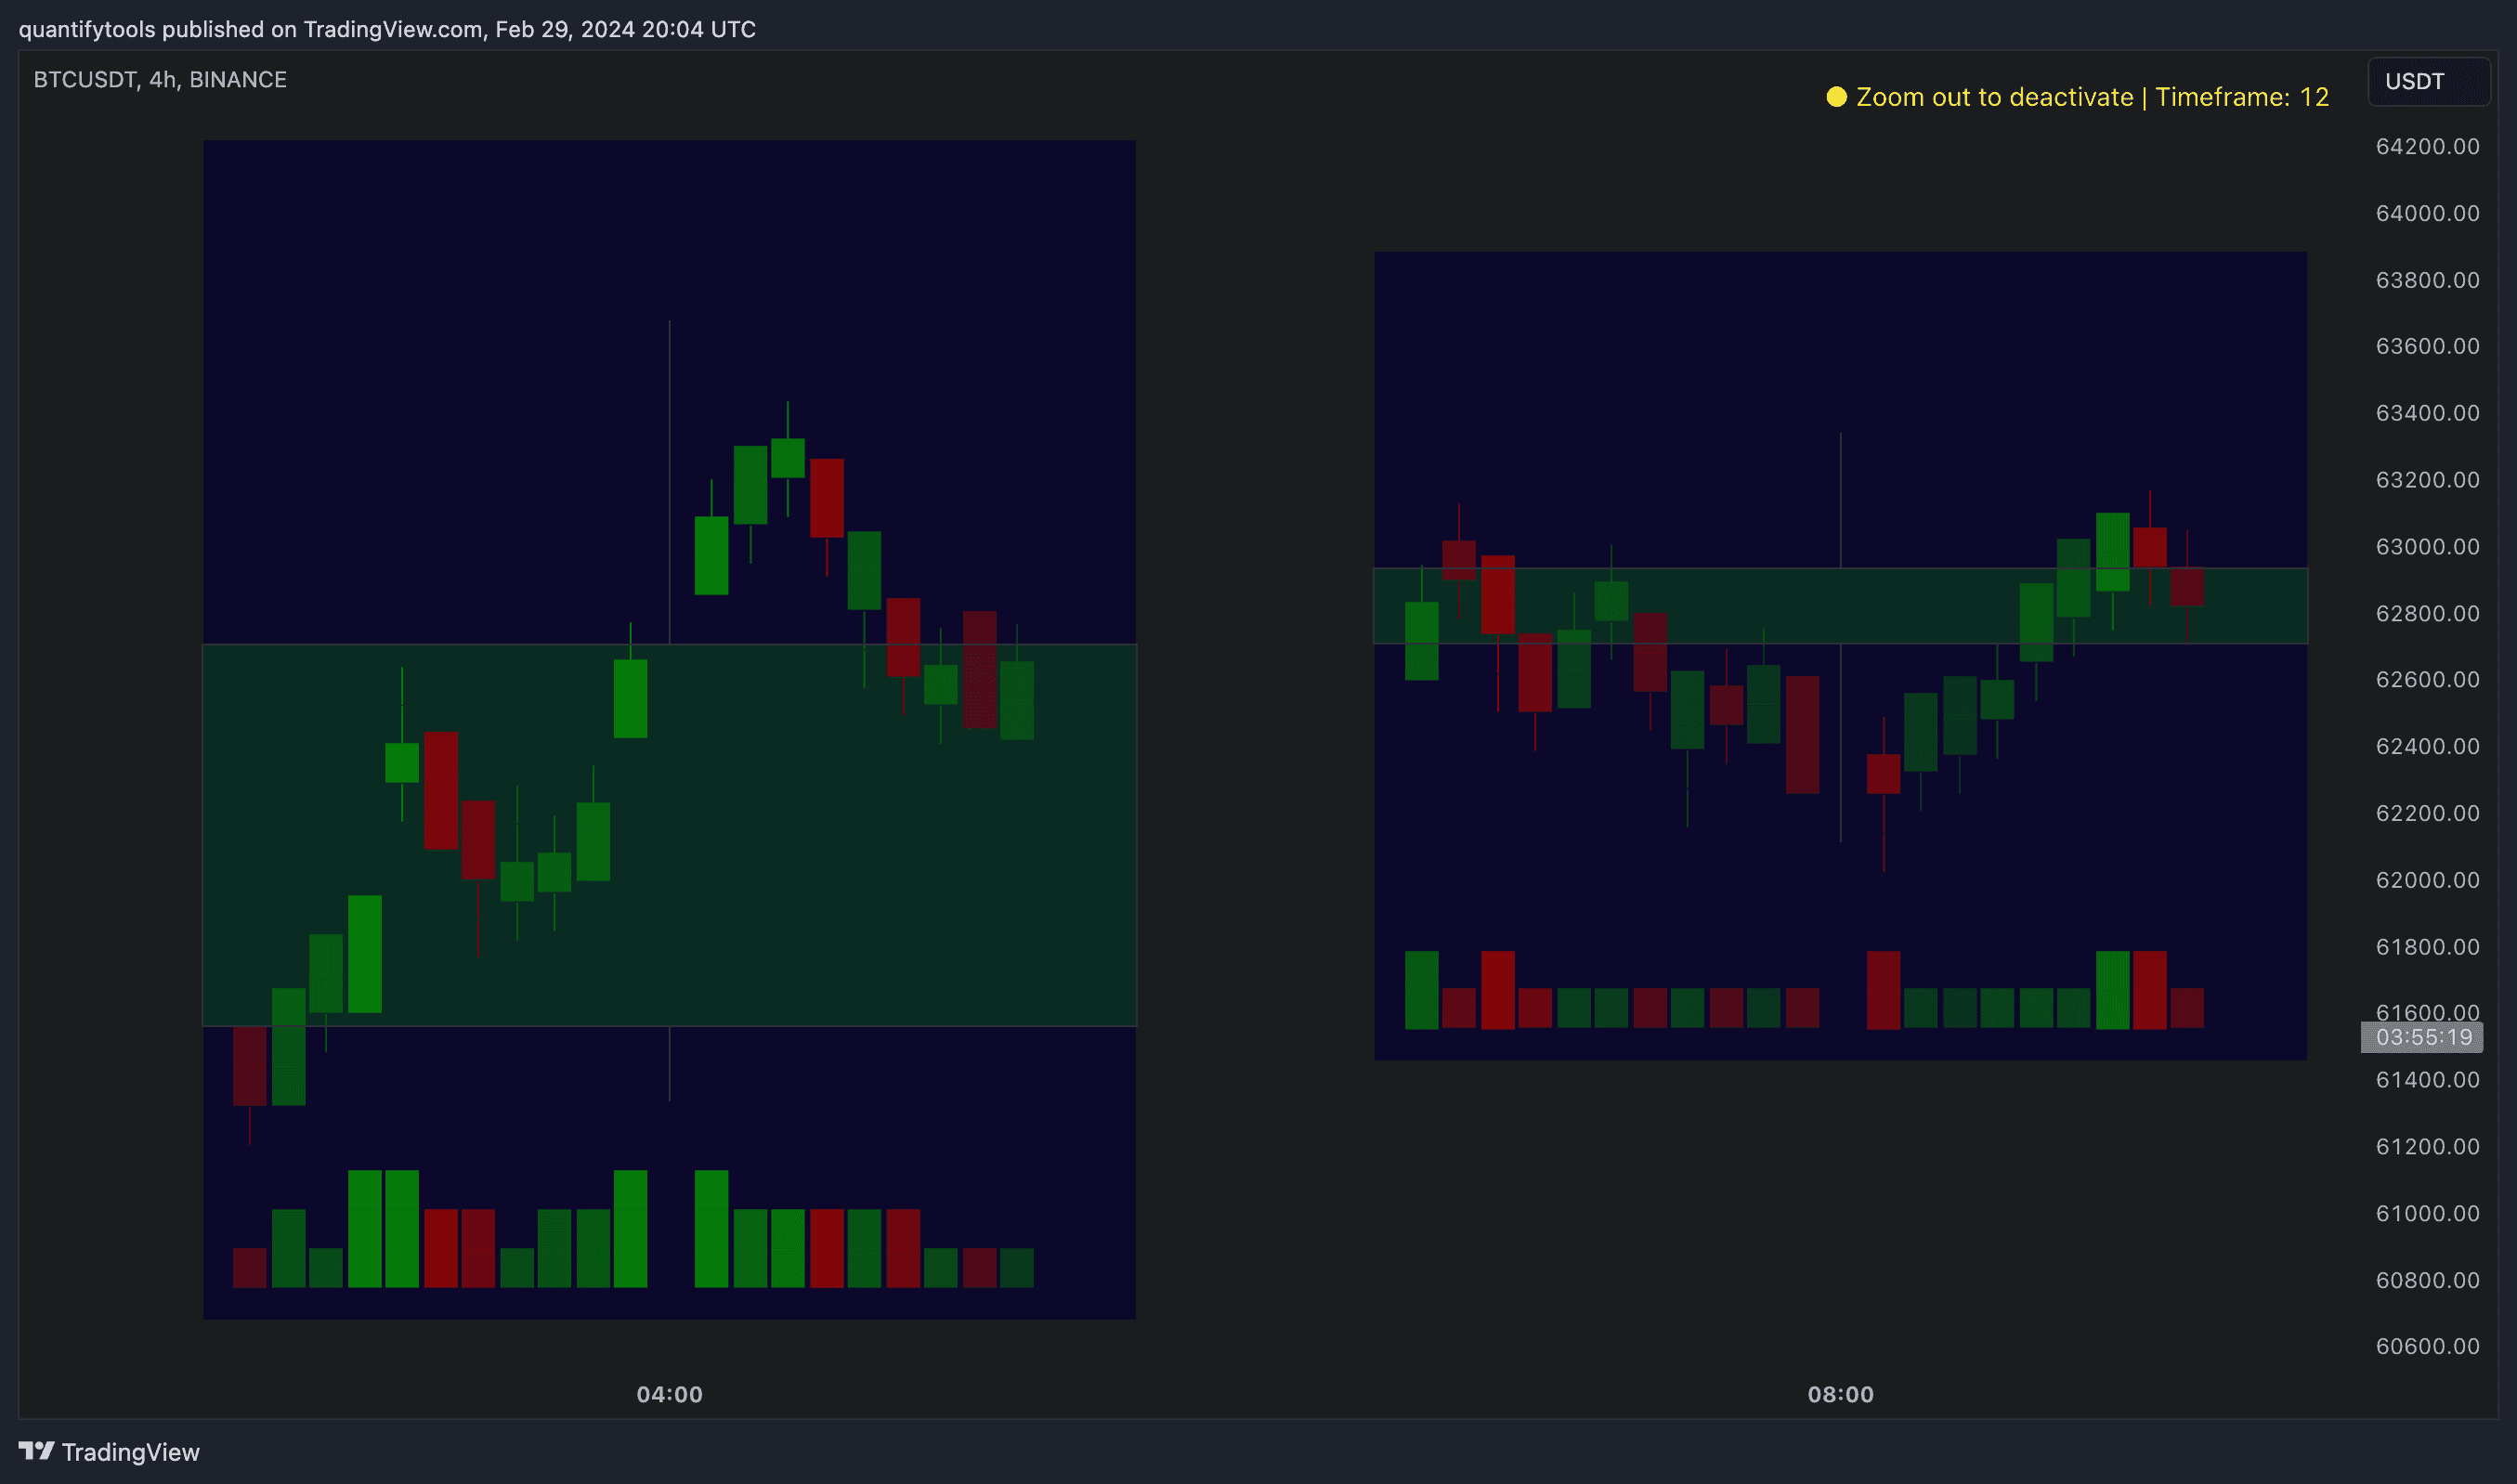
Optimized for readability vs. Optimized for accuracy
Auto-magnifier can be optimized for either readability, attempting to capture the price action movement better, or accuracy, plotting lower timeframe candles at their closing price.
Optimized for readability
When optimizing for readability, reading Auto-magnifier becomes easier and more intuitive. Note that price levels are not exact and precise using this setting, but the overall shape of price action is conveyed better.
Optimized for accuracy
When optimizing for accuracy, Auto-magnifier uses the exact price levels on lower timeframe.
Key features and settings
Here's how you work with Auto-magnifier on TradingView.
Zoom in
Zoom into a portion of your chart by scrolling.
See lower timeframe price action
After a second or two, a view of lower timeframe price action and volume bars candles opens up.
By default, main chart candles are splitted into 20 lower timeframe candles. The amount of candles displayed is a target rate, meaning the script will use a lower timeframe that has the closest match to 20 candles and therefore will vary a bit.
Users can override automatic timeframe calculation and display any specific lower timeframe, or adjust amount of candles shown (e.g. 20 -> 30 candles) per each main timeframe candle.
Example
Main timeframe set to 30 minute, candles displayed set to 20 -> Magnifying using 2 minute candles (30 minute/20 candles = 1.5 min, rounded to 2 min)
Main timeframe set to 30 minute, override set to 5 minutes -> Displaying 5 minute candles
Size of volume bars is calculated using relative volume (volume relative to volume SMA20), lowest bar representing relative volume values of under or equal to 1x the moving average and from there onwards progressively growing.
Limitations and considerations
Amount of candles shown might flow over from the background on smaller screen sizes, in which case you would want to decrease the amount shown. Opposite is true for bigger screens, this value can be increased as more candles fit.
Magnified chart vs. Actual chart
This indicator involves a lot of tricks with text elements to make it work automatically by zooming in. Size of wicks, bodies and volume bars are calculated by adding more text elements on big candles and less text elements on smaller candles.
This means the displayed candles won’t be a 100% match, but a rather a fair representation of the view, e.g. candle is green = lower timeframe candle is green, candle has a big wick = lower timeframe candle has a big wick (but not a 100% match).
Magnified chart
Here's how a lower timeframe chart looks like on Auto-magnifier.
Actual chart
Here's how a lower timeframe chart looks like on Auto-magnifier.
Most mismatch will be found on the price levels where lower timeframe candles are shown, which is sacrificed for the sake of getting a better readability on the overall shape of lower timeframe price action. Users can alternatively optimize calculations for more accuracy, giving a better representation of the price levels where candles truly originated. This typically comes with the cost of worse readability however.
Optimized for readability vs. Optimized for accuracy
Auto-magnifier can be optimized for either readability, attempting to capture the price action movement better, or accuracy, plotting lower timeframe candles at their closing price.
Optimized for readability
When optimizing for readability, reading Auto-magnifier becomes easier and more intuitive. Note that price levels are not exact and precise using this setting, but the overall shape of price action is conveyed better.
Optimized for accuracy
When optimizing for accuracy, Auto-magnifier uses the exact price levels on lower timeframe.
Get Auto-magnifier on TradingView
Find TradingView indicators easily by opening up any chart on TradingView (e.g. TSLA) and clicking Indicators tab on top menu. To find all our tools, search "quantifytools" and click an indicator to add to your chart.
TradingView page
Auto-magnifier on TradingView ↗


